SCANNING TECHNIQUE AND NORMAL ANATOMY
Duplex ultrasound (DUS) evaluation of the hepatic vasculature is best performed using a 2- to 5-MHz curved array transducer in a fasting (8 to 12 hours) patient. Gray-scale imaging of the liver is initially performed and is optimized by using harmonic imaging, spatial compounding, and multiple acoustic windows. The size, echotexture, and surface contour of the liver should be noted and focal liver lesions excluded. The use of a high-frequency (5 to 10 MHz) linear array transducer may aid in evaluating the liver surface for nodularity suggestive of cirrhosis. The spleen is evaluated for size and focal lesions, and the upper abdomen is screened for ascites and varices.
Oblique imaging, aiming toward the right shoulder, is particularly useful for visualization of the main PV. The porta hepatis is often best visualized in the right decubitus position, as artifact from bowel gas will be eliminated or reduced when the patient turns on the right side, allowing gas in the bowel to rise into the gastric fundus in the left upper quadrant and fluid in the bowel to collect in the gastric antrum and duodenum providing a good acoustic window. When evaluating the hepatic vasculature with pulsed Doppler, spectral waveforms should be obtained from the following vessels: upper abdominal aorta; main, right, and left hepatic arteries; main, right, and left PVs; splenic vein (SV) at the splenic hilum and under the pancreas; superior mesenteric vein (SMV) at the portal confluence; right, middle, and left HVs; and inferior vena cava (IVC). Peak systolic velocity (PSV) is measured in the hepatic arteries as well as in the aorta, and peak velocity is measured in the PVs. Optimally, at least three Doppler spectral waveforms should be obtained in the main PV and main hepatic artery (HA). The highest velocity is recorded.
Machine settings will vary depending upon the vessel examined. When evaluating the PVs, settings should be optimized for the detection of slow flow. The color box should be small; the pulse repetition frequency (PRF) or scale should be set as low as possible before aliasing occurs; the wall filter should be as low as possible until motion artifact occurs; and the gain should be maximized until artifact from noise obscures the image. Spectral Doppler waveforms from the portal and HVs should be obtained during quiet respiration, as deep inspiration will flatten venous waveforms and decrease PV velocity. However, when evaluating the HA, the PRF and wall filter will need to be increased to avoid aliasing and motion artifact. When measuring PSV with spectral Doppler, the angle of insonation should be 60 degrees or less and the sample volume should encompass the width of the HA. The PRF should be adjusted such that the Doppler waveform is as large as possible before aliasing occurs.
The PV contributes approximately 75% of the blood supply to the liver and is formed by the confluence of the splenic and SMVs. The Doppler spectral waveform from a normal PV demonstrates low-velocity continuous hepatopetal flow. Peak velocity ranges from 10 to 40 cm/s, and normal PV flow demonstrates mild respiratory variation (Fig. 22.1A). During quiet respiration, the PV is normally less than 13 mm in diameter.8,9 However, diameter and velocity are inversely related. Hence, due to increased intra-abdominal pressure with deep inspiration, PV diameter increases, reaching a maximum of 16 mm, and velocity decreases slightly.8–11 Occasionally, PV flow may be more pulsatile in the normal patient (see Fig. 22.1B) as cardiac pulsatility is transmitted through the HVs and hepatic sinusoids to the PVs. Contraction of the right atrium at end diastole transmits back pressure to the portal circulation, decreasing forward portal venous flow. Thus, the trough in a pulsatile portal venous waveform corresponds to end diastole.11 Flow in the SV and SMV is hepatopetal in direction and also demonstrates mild respiratory variation, as well as an increase in diameter on deep inspiration.10
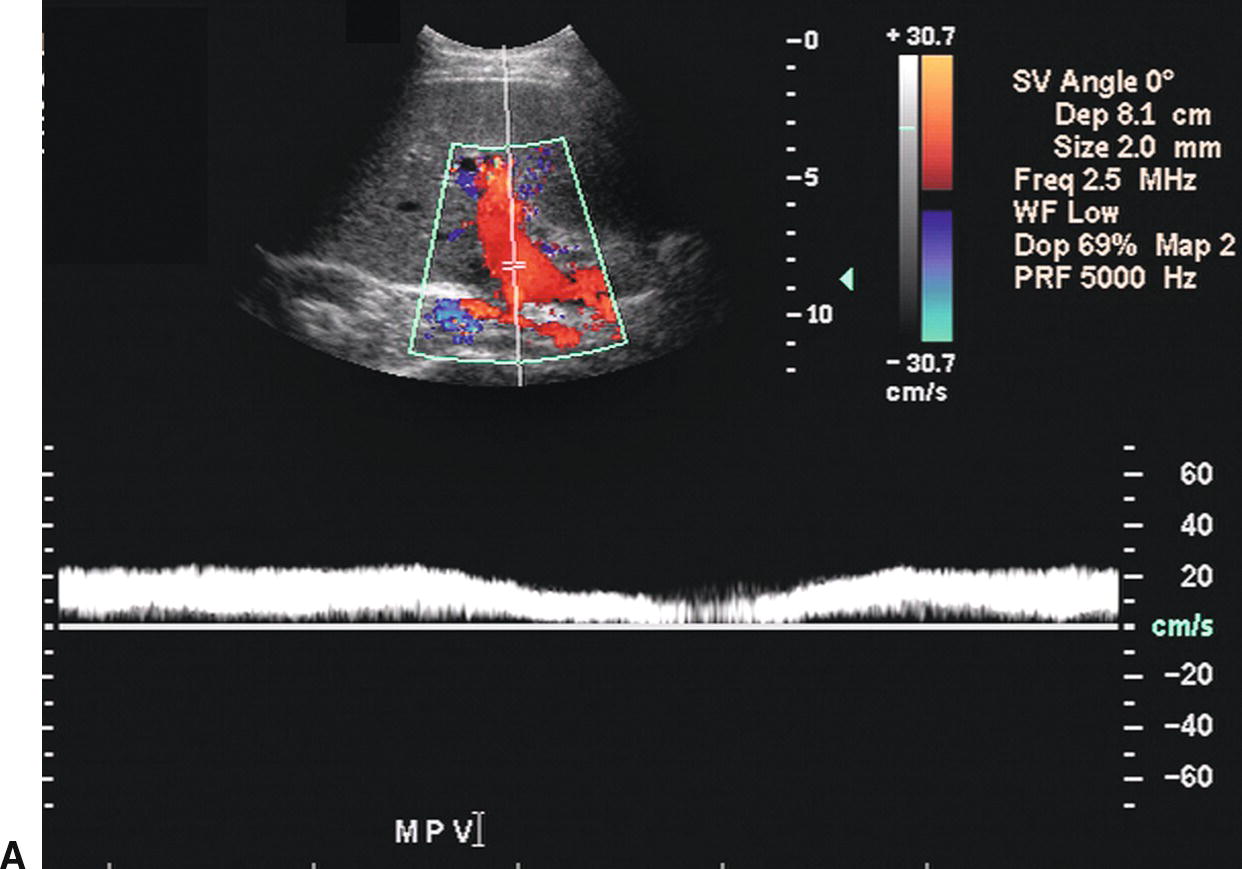
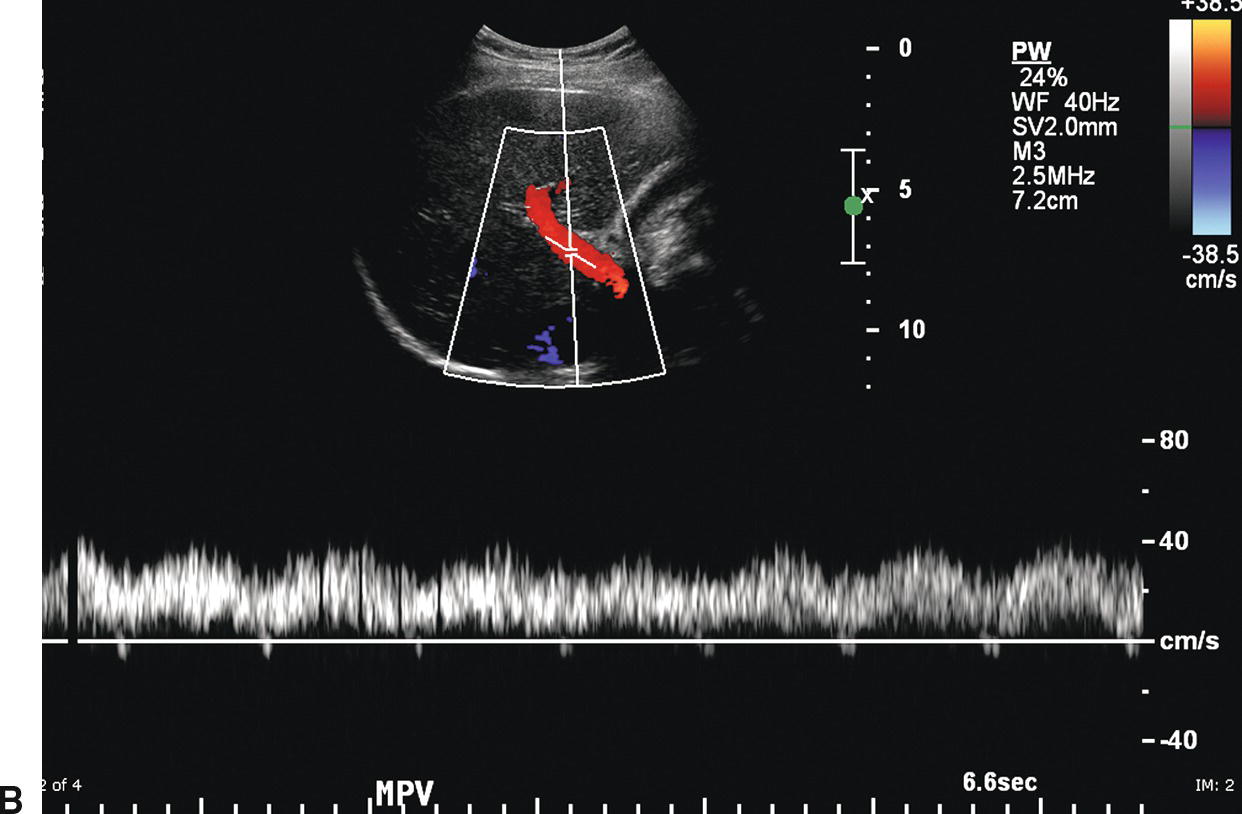
FIGURE 22.1. Normal portal vein. A,Spectral waveform from the main portal vein demonstrates flow toward the liver (red) with a peak velocity of approximately 25 cm/s. Note the mild respiratory variation. Velocity in the portal vein normally decreases slightly with inspiration. B,Spectral waveform from the main portal vein demonstrating mild pulsatility. This can be a normal finding, particularly in thin, athletic patients.
In most patients, the celiac artery bifurcates into the common HA and the splenic artery (see Fig. 22.2A). The common HA courses in the hepatoduodenal ligament toward the liver, lying anterior and medial to the PV and inferior to the common bile duct (see Fig. 22.2B). However, in approximately 11% of patients, the right HA arises from the superior mesenteric artery (SMA), and in 4% of patients, the common HA will arise from the SMA. Replaced right or common hepatic arteries course inferior and lateral to the PV. The spectral waveform from the HA demonstrates a sharp systolic upstroke with continuous forward diastolic flow (see Fig. 22.2B). PSV is related to systemic blood pressure and is typically around 100 cm/s, and the resistive index (RI) of the HA normally ranges between 0.55 and 0.7.11
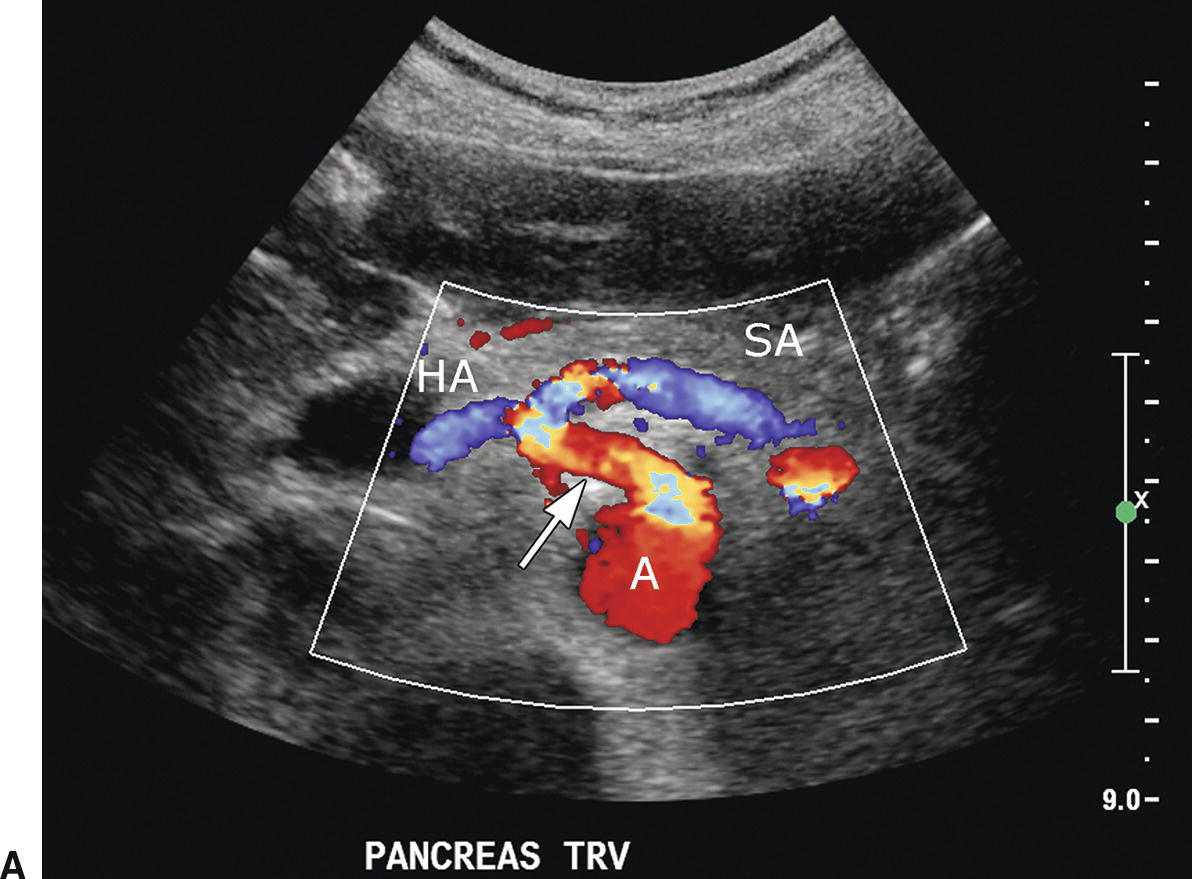
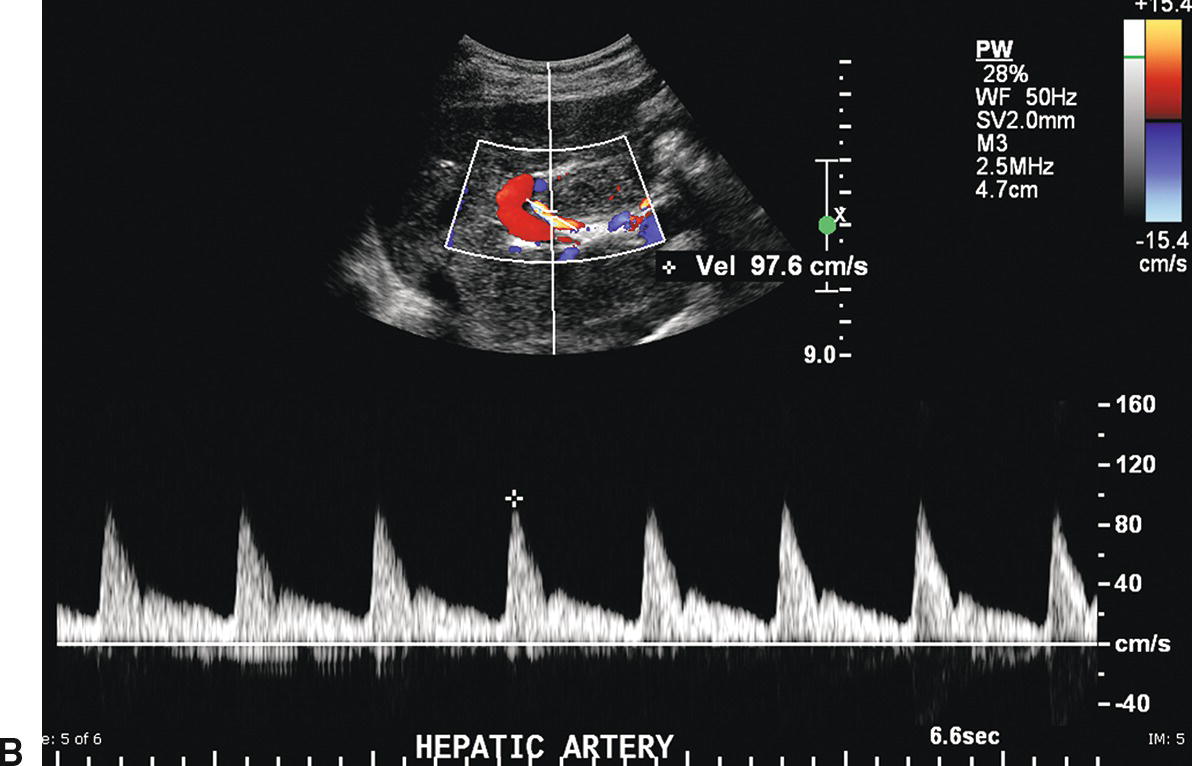
FIGURE 22.2. Normal hepatic artery. A,Transverse color Doppler image demonstrating the celiac artery (arrow) arising anteriorly from the aorta (A). The celiac artery branches in a T-shape configuration into the hepatic artery (HA), which courses to the right, and the splenic artery (SA), which courses to the left. B,Spectral Doppler waveform from the main hepatic artery demonstrates a sharp systolic upstroke with continuous forward diastolic flow. In the porta hepatis, the main hepatic artery is found anterior to the main portal vein.
The right, middle, and left HVs typically join the IVC near the dome of the liver; however, congenital variations of HV anatomy are common. Normal HV and IVC spectral waveforms are pulsatile, reflecting the variations in right atrial pressure during the cardiac cycle. Flow is primarily directed away from the liver capsule (Fig. 22.3A). The initial S wave is due to filling of the right atrium in early to mid systole. This is followed by the V wave due to overfilling of the right atrium at the end of systole just before the tricuspid valve opens. The subsequent D wave reflects filling of the right atrium in diastole. Lastly, there is a brief reversal of flow heading back toward the liver, the A wave, which corresponds to the right atrial “kick” or contraction at end diastole (see Fig. 22.3B). These changes in HV velocity are extremely sensitive to intra-abdominal pressure. Therefore, if a spectral waveform is obtained in deep inspiration, or if the IVC is compressed by an enlarged liver, ascites, or a large amount of fat in the anterior abdominal wall, the HV and IVC waveforms in may appear artifactually flattened.
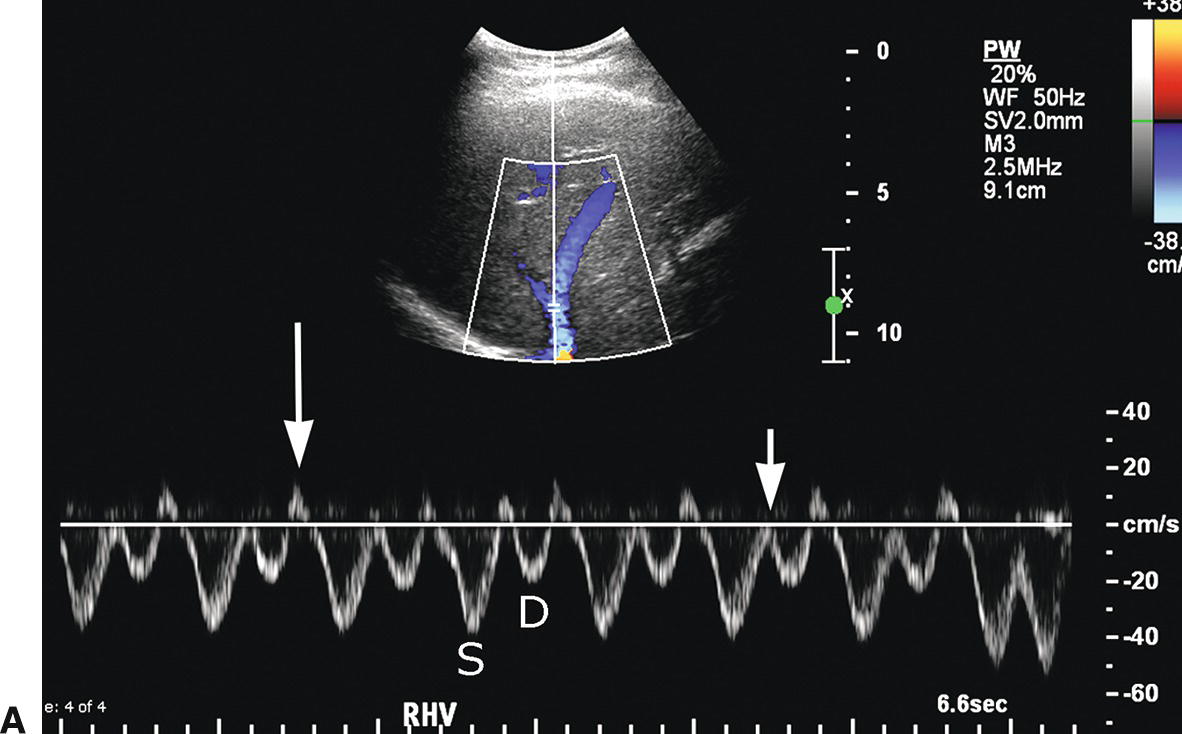
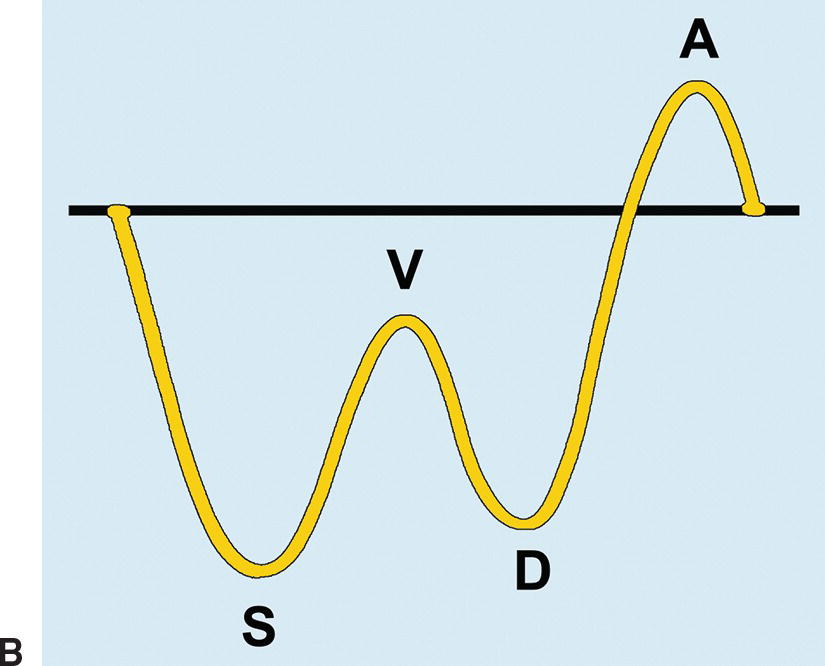
FIGURE 22.3. Normal hepatic vein. A,The Doppler waveform from a normal HV is pulsatile, reflecting pressure changes in the right heart. Flow is hepatofugal or directed away from the liver (blue). The initial S wave occurs during filling of the right atrium (S). The V trough (short arrow) reflects overfilling of the right atrium before the tricuspid valve opens. Subsequent hepatofugal flow as the right atrium fills in diastole creates the D wave. Last, flow is pushed back toward the liver (hepatopetal) as the right atrium contracts causing the A wave (long arrow), a short reversal of flow above the baseline. B,Schematic representation of the effect of transmitted right heart pressure on the hepatic venous waveform. S, V, D, and A as described above for 22.3A.
ULTRASOUND FINDINGS IN PORTAL HYPERTENSION
Patients with PHT frequently develop splenomegaly (>13 cm in maximal diameter) and ascites (Fig. 22.4). Gamna-Gandy bodies (siderotic nodules containing fibrous tissue, hemosiderin, and calcium salts) may be identified in the spleen as multiple punctate echogenic foci (Fig. 22.5).12 In the liver, the stigmata of cirrhosis, namely volume redistribution with a decrease in size of the right lobe and relative increase in size of the caudate lobe and lateral segment of the left lobe, coarse echotexture, surface nodularity, and focal masses may be noted (Fig. 22.6). Any focal mass noted on DUS in a patient with cirrhosis should be presumed to be HCC, irrespective of size and echogenicity, until proven otherwise (see Fig. 22.6E and F). Although regenerative nodules are the most common cause of focal liver lesions in patients with cirrhosis, they are uncommonly visualized on ultrasound examination. While cirrhosis is the most common cause of PHT in the United States, it should be remembered that cirrhosis can be present in the absence of PHT, and PHT can occur without cirrhosis.
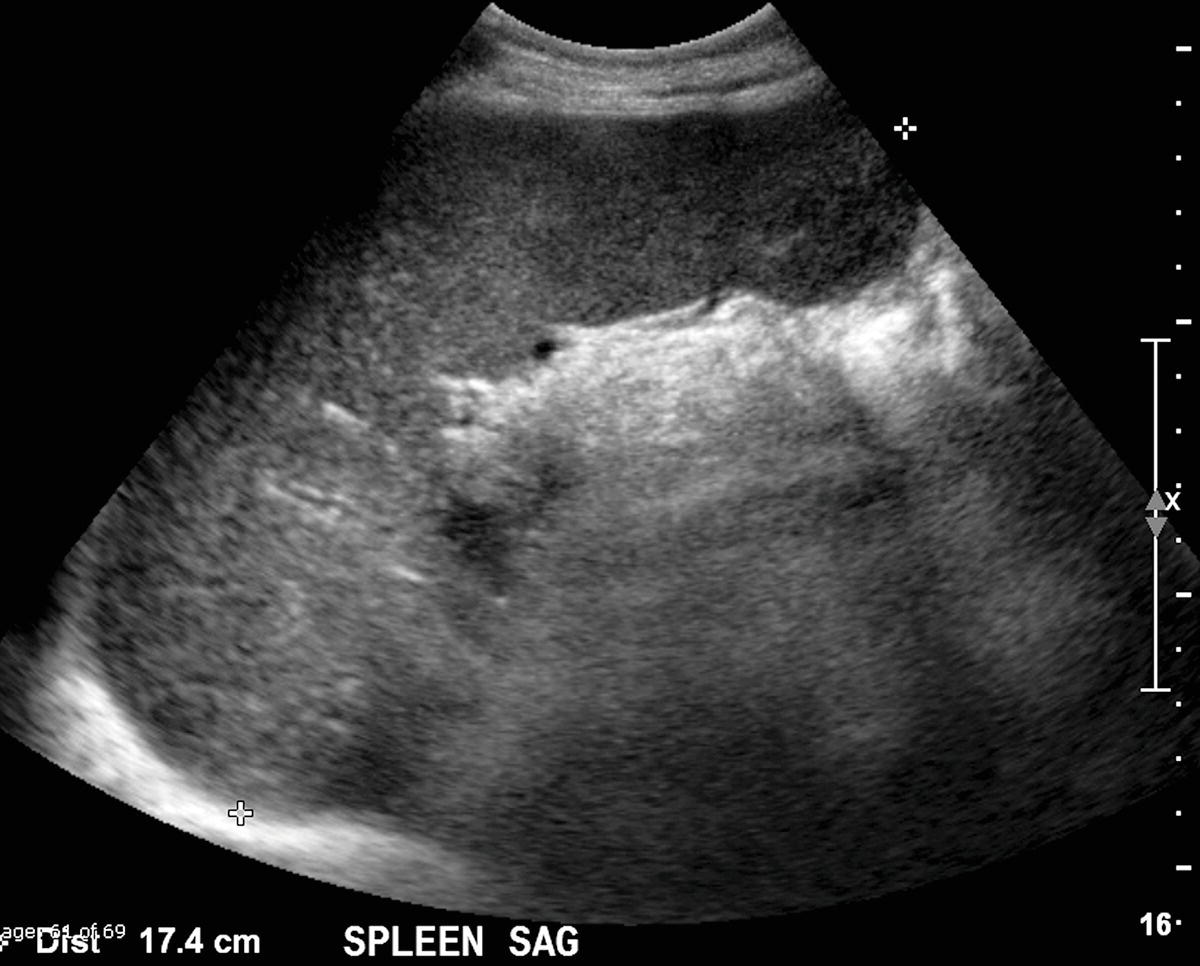
FIGURE 22.4. Splenomegaly. The spleen in this patient with cirrhosis measures 17.4 cm in maximum sagittal dimension. The spleen should normally measure less than 13 cm in an adult. Splenomegaly is a nonspecific finding. In addition to cirrhosis, other causes of splenomegaly include myeloproliferative disorders and infection.
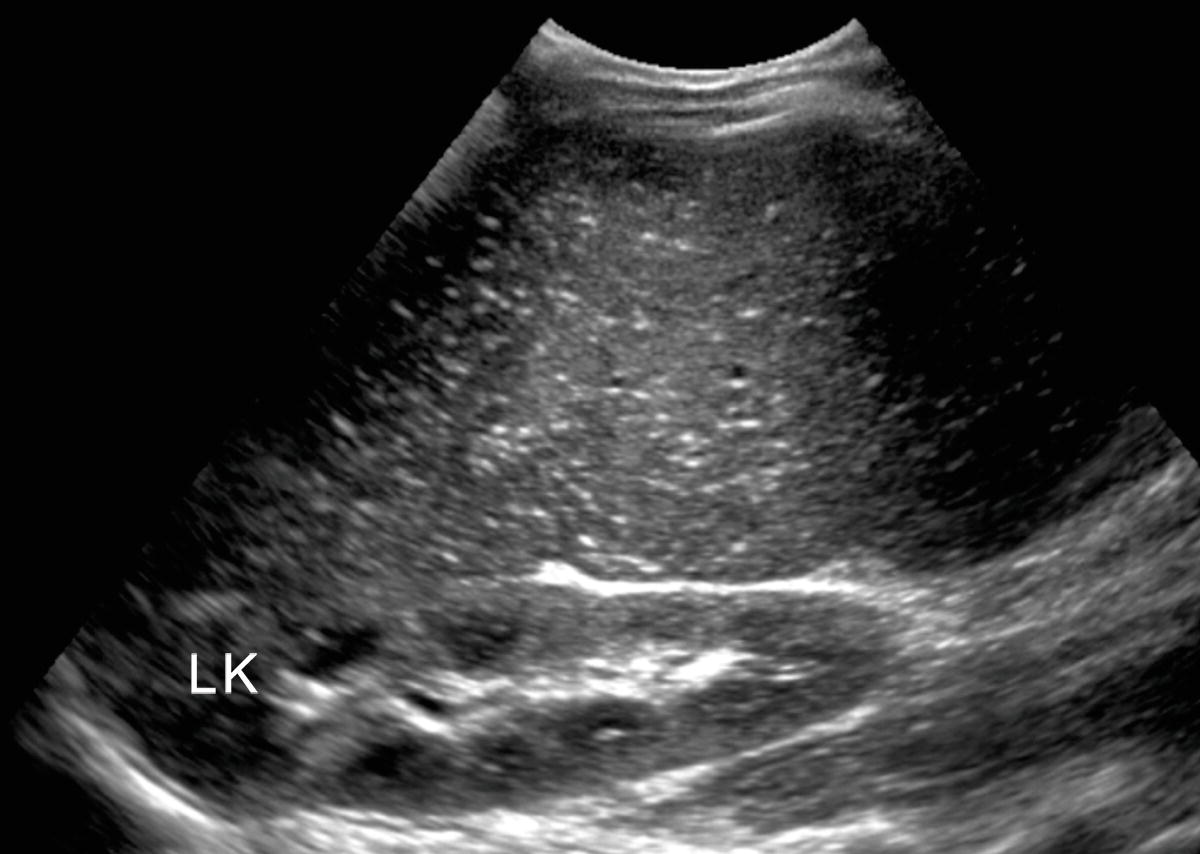
FIGURE 22.5. Gamna-Gandy bodies. Note multiple tiny punctate echogenic foci that represent the siderotic nodules found in the spleen in patients with cirrhosis. Gamna-Gandy bodies are visualized more commonly on magnetic resonance imaging than on ultrasound. LK, left kidney.
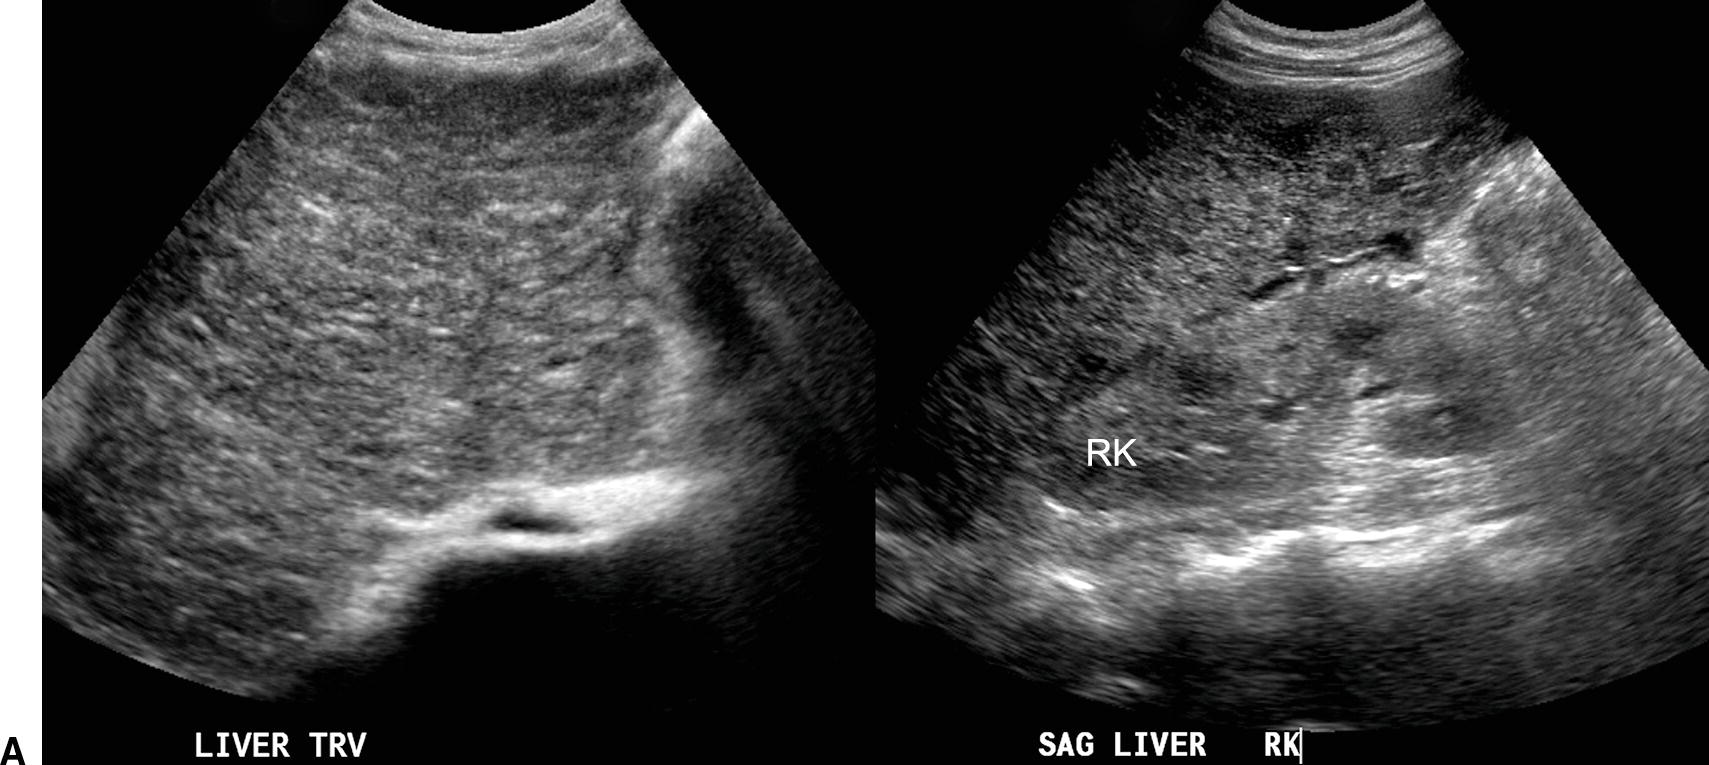
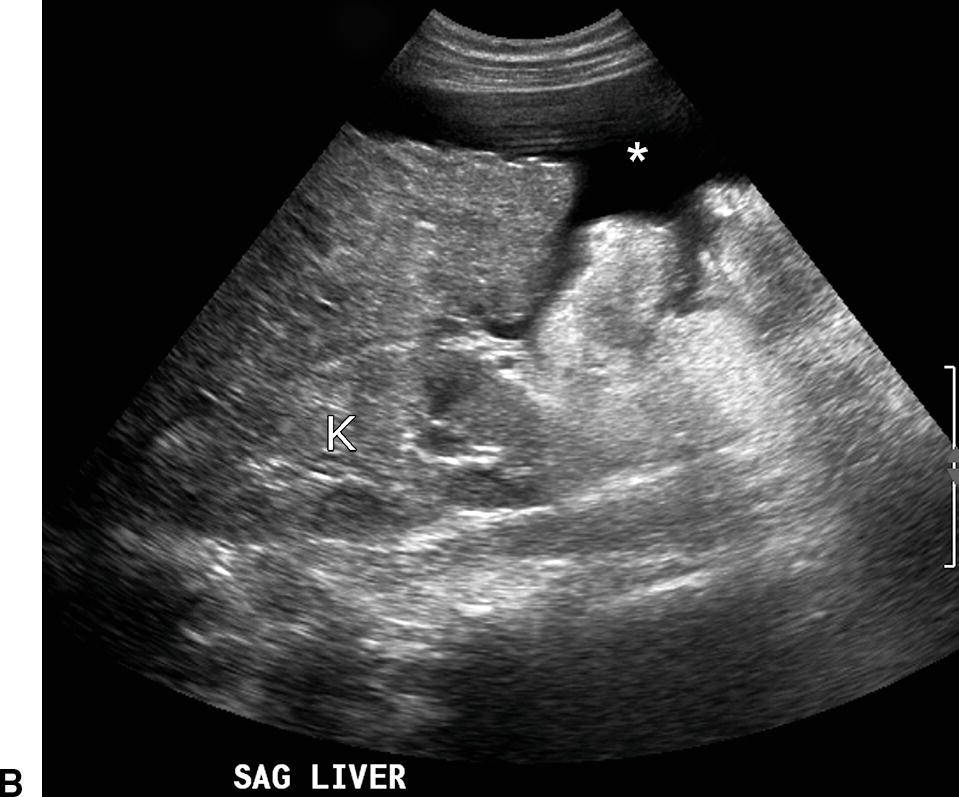
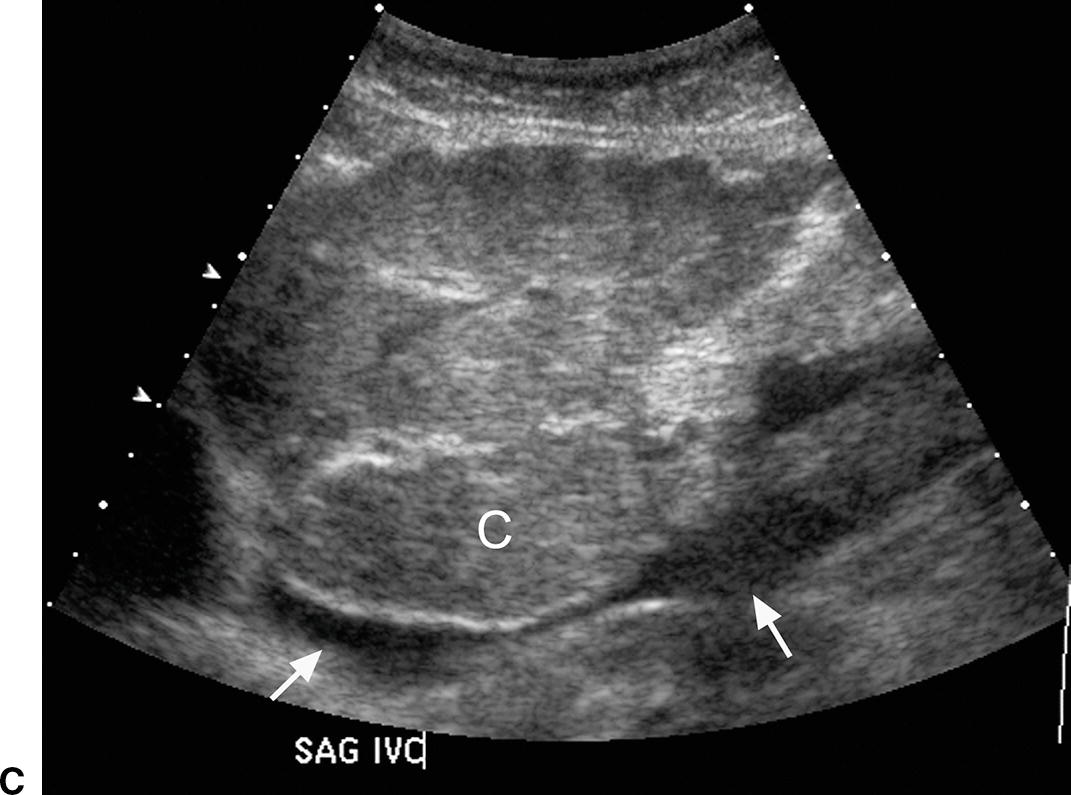
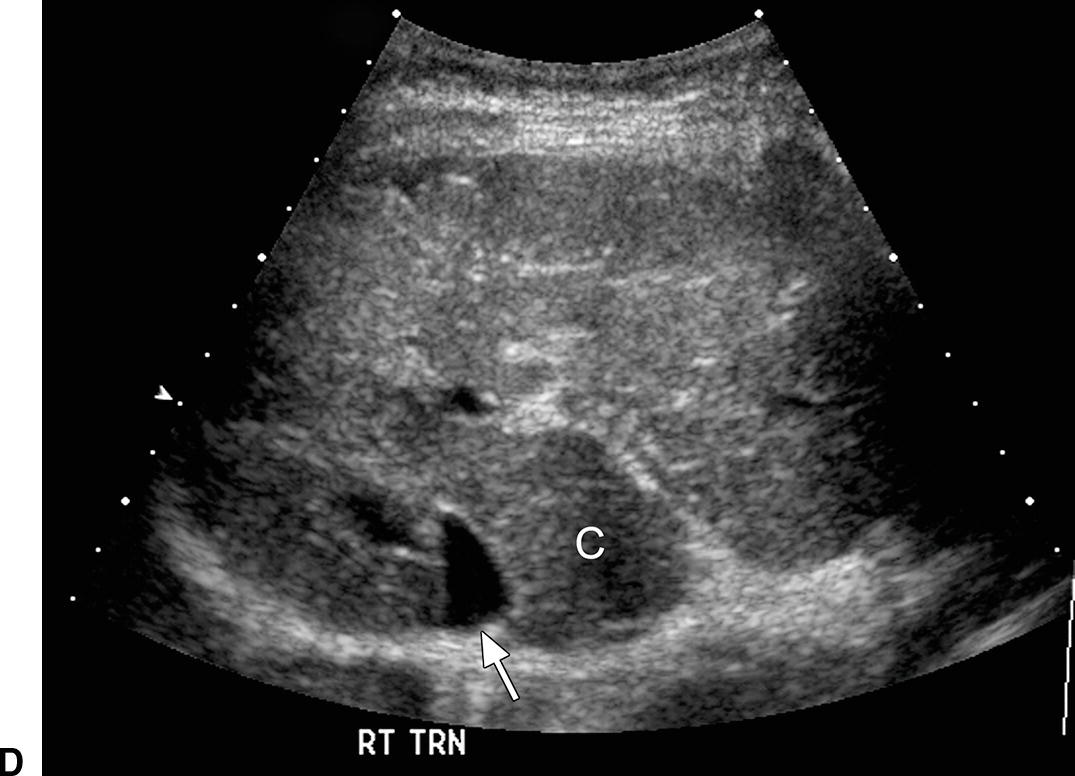
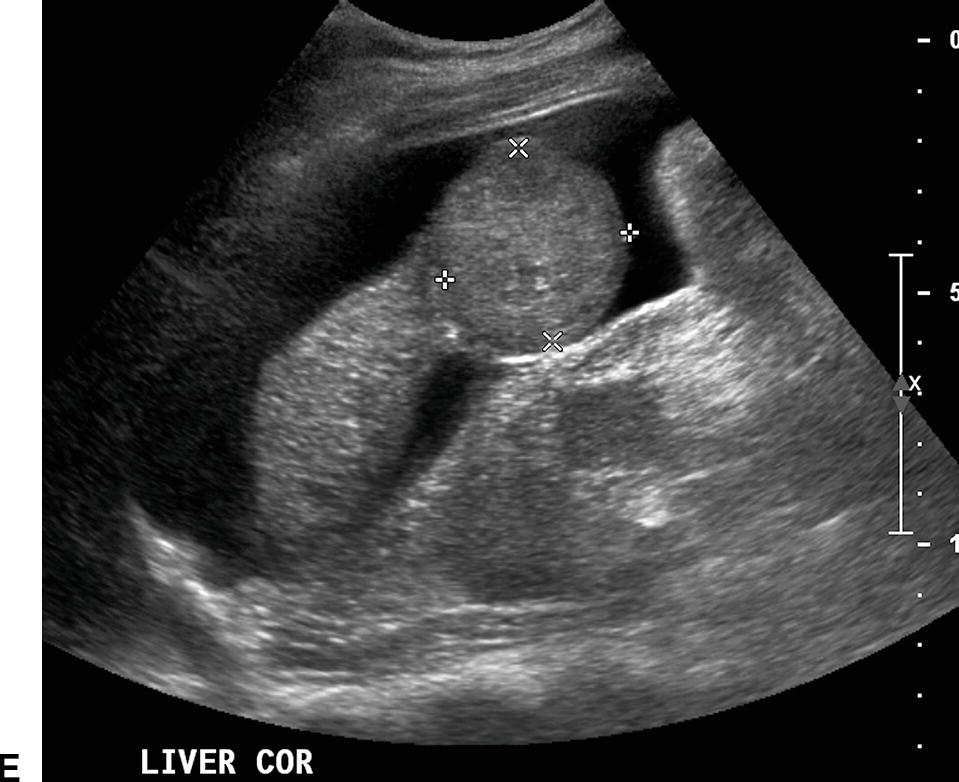
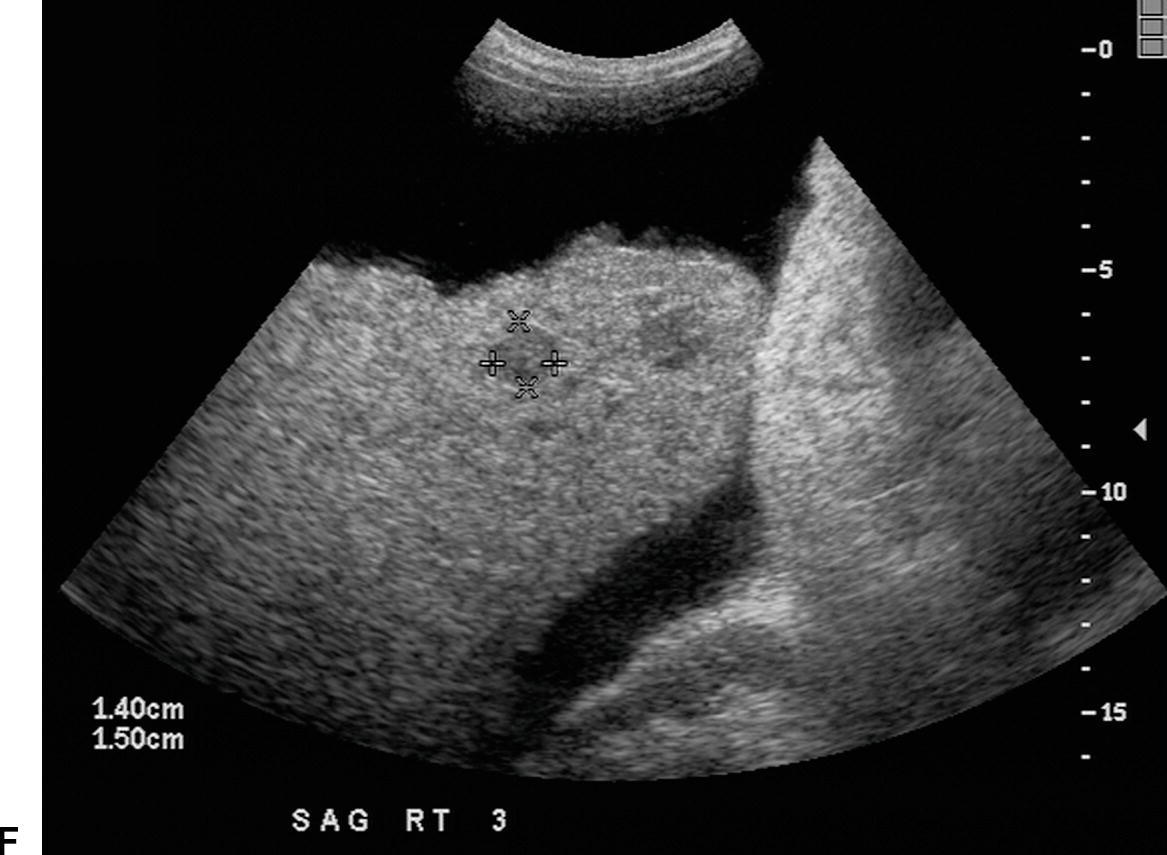
FIGURE 22.6. Ultrasound findings in cirrhosis. A,Gray-scale images of the liver from two patients with cirrhosis demonstrating coarse echotexture of the liver parenchyma. The coarseness or graininess of the parenchymal echotexture in the patient on the right is so pronounced with scattered ill-defined areas of decreased echogenicity that it is difficult to exclude underlying focal masses. RK, right kidney. B,Note the nodular surface of the liver. Nodularity of the liver surface is often best appreciated in patients with ascites (*) and by using a high-frequency linear array transducer. K, right kidney. Sagittal (C) and transverse (D) views of the liver demonstrating an enlarged caudate lobe (C). Arrows indicate the IVC. E,Note coarsened echotexture of the liver, ascites, and exophytic liver mass (calipers). This HCC was relatively isoechoic to the liver parenchyma. F,Note two small hypoechoic nodules (calipers), biopsy-proven HCCs. The liver is coarse in echotexture, the liver surface is nodular, and ascites is present in this patient with long-standing cirrhosis.
Ultrasound findings of PHT progress as the portosystemic gradient increases. Initially, the diameter of the PV increases: greater than 13 mm in quiet respiration and greater than 16 mm in deep inspiration (Fig. 22.7A). This change in PV diameter has been reported to have a very high specificity (near 100%) though a low sensitivity (~45% to 50%) for PHT.13,14 In addition, the PV, SV, and SMV will not increase in diameter with deep inspiration in patients with PHT. A less than 20% increase in the diameter of the SV and SMV following deep inspiration has been reported to have a sensitivity of 81% and specificity of 100% for the diagnosis of PHT.10–14 On spectral Doppler interrogation, loss of respiratory variation occurs in the PV, and the waveform will flatten. As PV diameter increases, velocity decreases (see Fig. 22.7B). Eventually, bidirectional flow (above and below the baseline) will be observed (see Fig. 22.7C), and ultimately flow in the PV will reverse, becoming hepatofugal (see Fig. 22.7D).15–18 As flow in the PV decreases, flow in the HA typically increases, and the HA becomes dilated and tortuous with a so-called corkscrew appearance (Fig. 22.8). Waveforms in the HVs may also flatten (Fig. 22.9).19
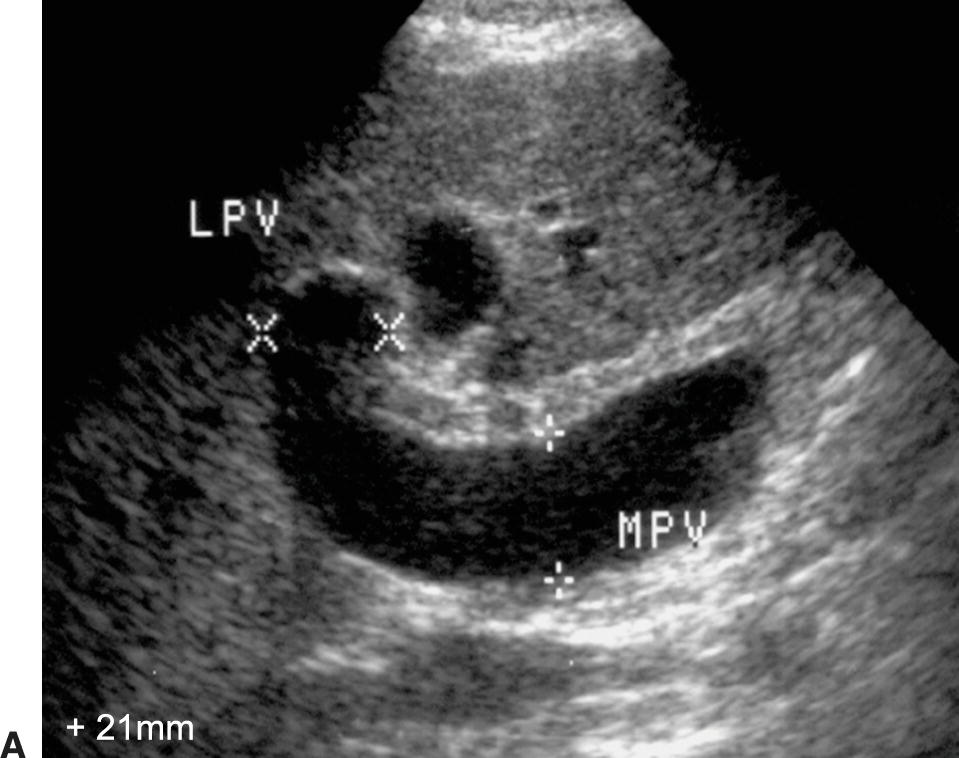
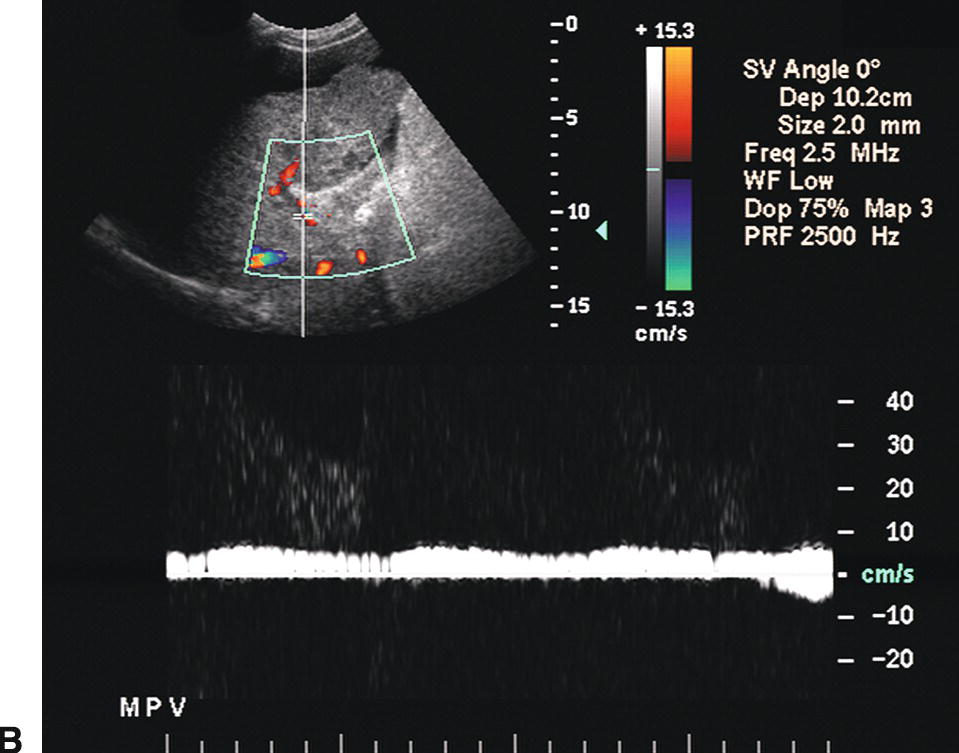
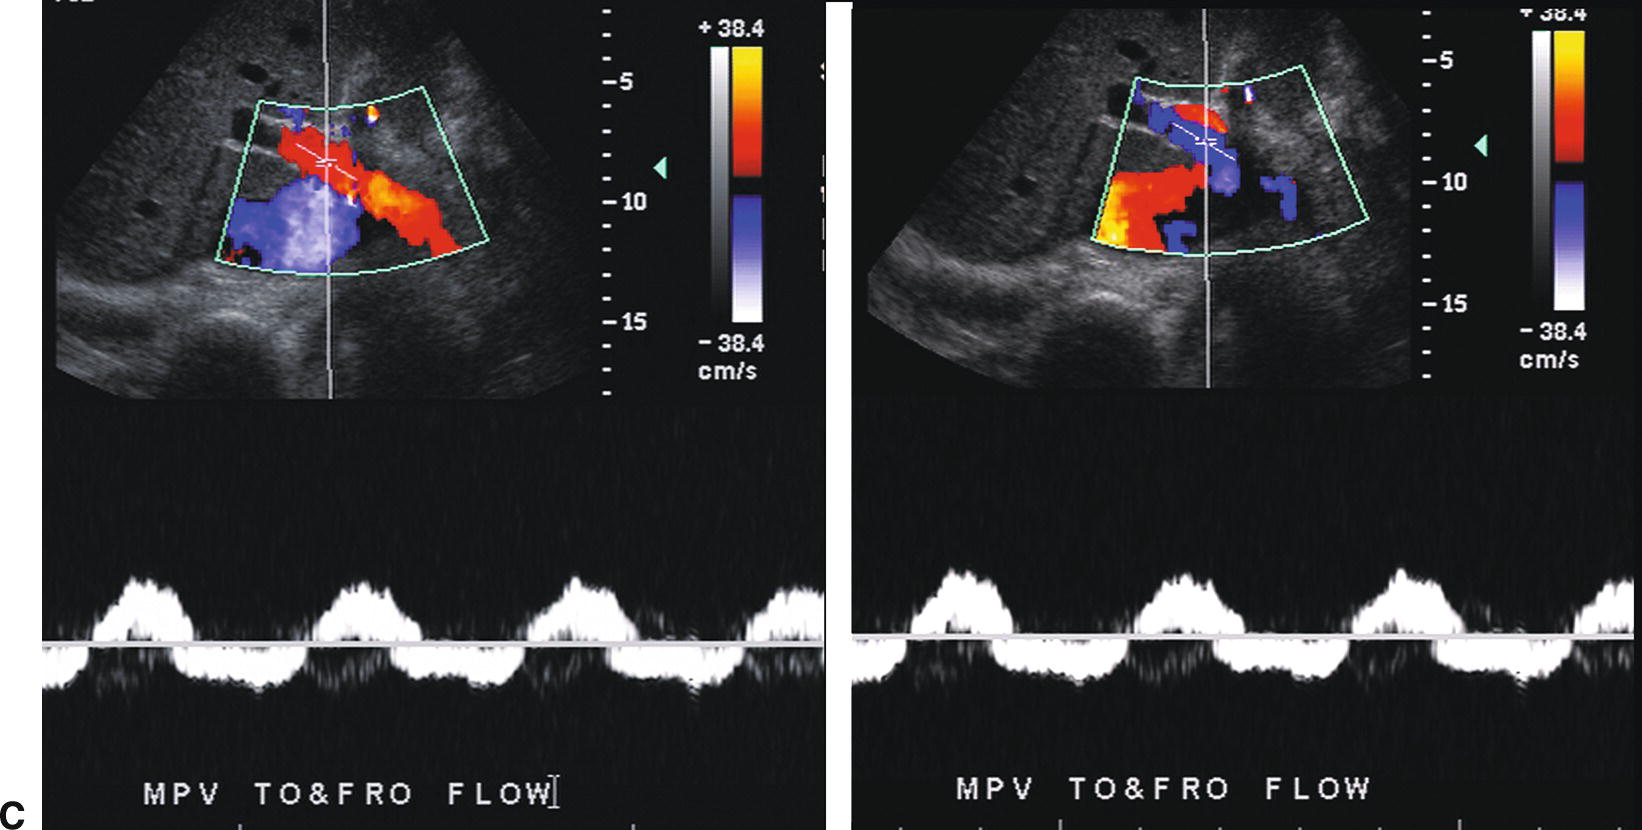
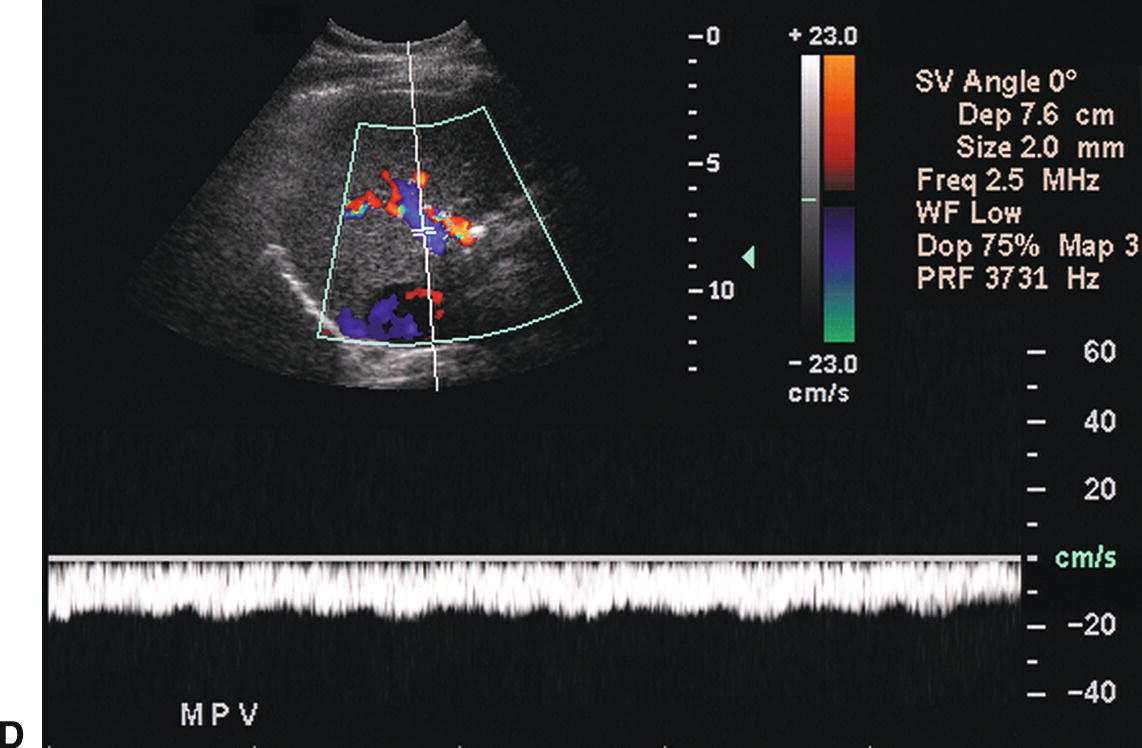
FIGURE 22.7. Portal Hypertension: Doppler findings in the portal vein. A,Enlargement of the portal vein. The PV (calipers) is 21 mm in diameter in this patient with PHT. The normal portal vein measures less than 13 mm during quiet respiration. Color Doppler interrogation revealed no evidence of thrombus. MPV, main portal vein, LPV, left portal vein. B,Spectral Doppler waveform from the portal vein demonstrating decreased velocity (<10 cm/s). Flow remains hepatopetal, heading toward the liver. C,Spectral waveform from the portal vein demonstrating “to-and-fro” flow, above and below the baseline. Depending on when the color image is frozen, flow may be red/hepatopetal (left image) or blue/hepatofugal (right image). D,Spectral Doppler waveform demonstrating reversed flow in the main portal vein (blue). Flow is in the opposite direction (red) in the hepatic artery, which lies anterior to the main portal vein. Reversed flow in the portal vein usually indicates relatively severe PHT and is a late finding.
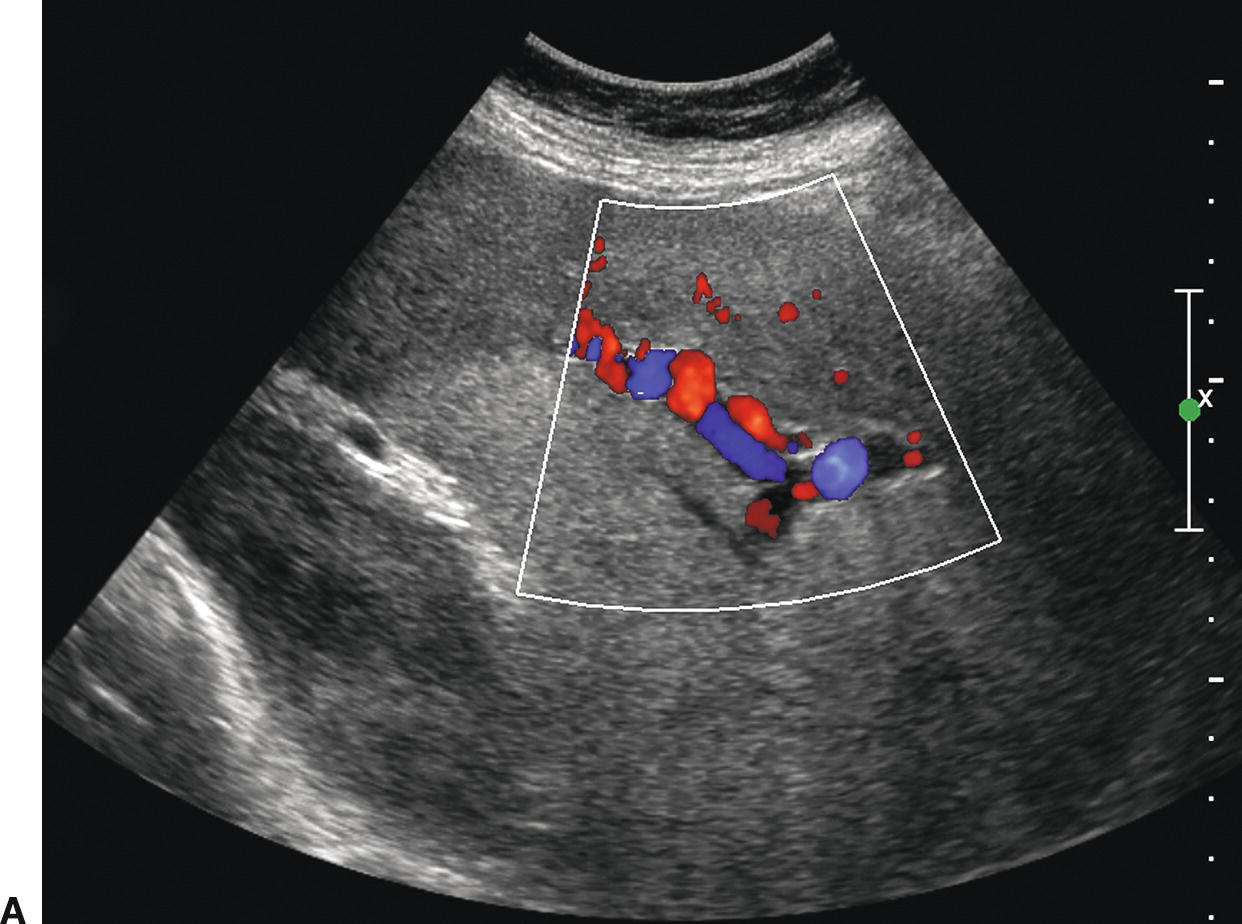
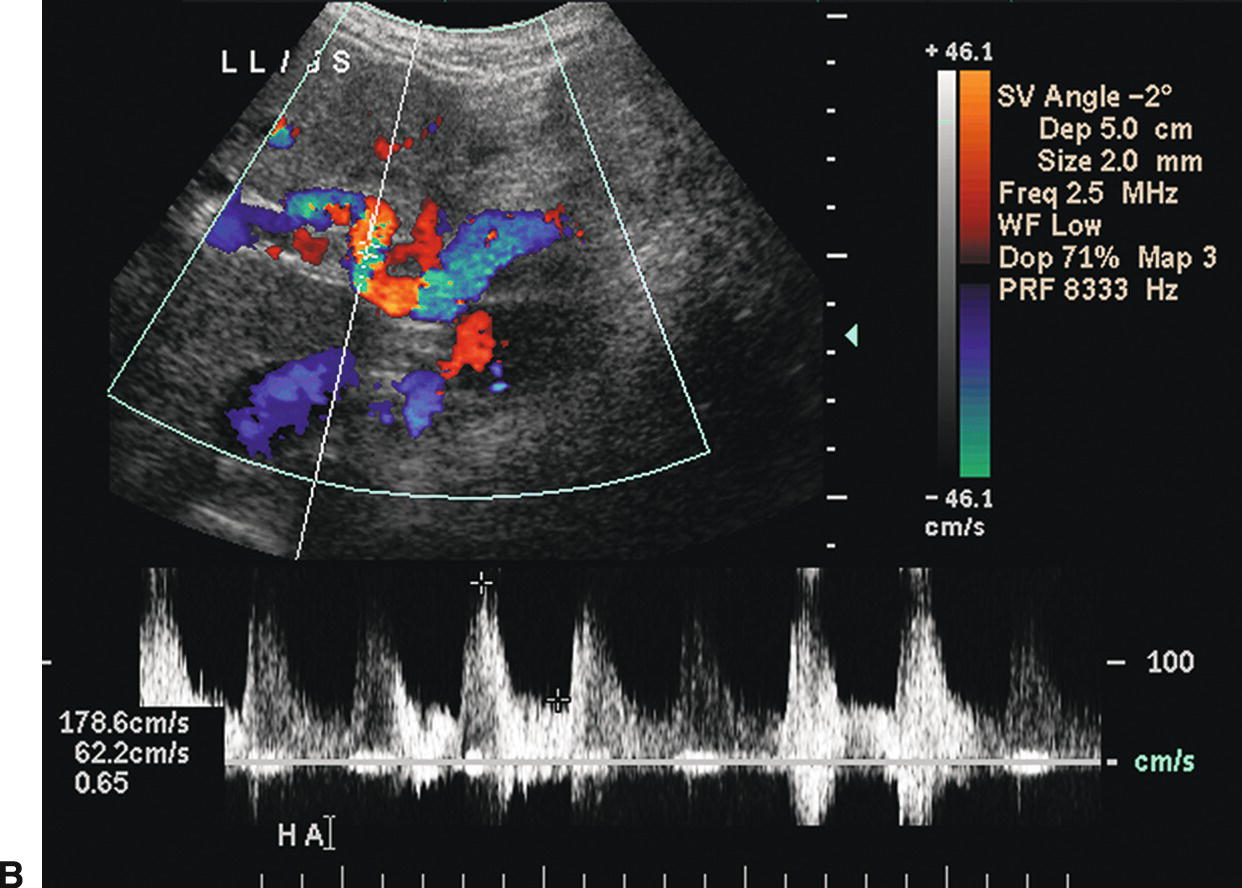
FIGURE 22.8. Portal hypertension: Doppler findings in the hepatic artery. A,Color Doppler image demonstrating a tortuous, redundant hepatic artery (red), the so-called corkscrew hepatic artery. Flow is reversed (blue) in the portal vein, also consistent with PHT. B,In another patient with long-standing PHT, the main hepatic artery is markedly dilated and tortuous. PSV is elevated at 178.6 cm/s.
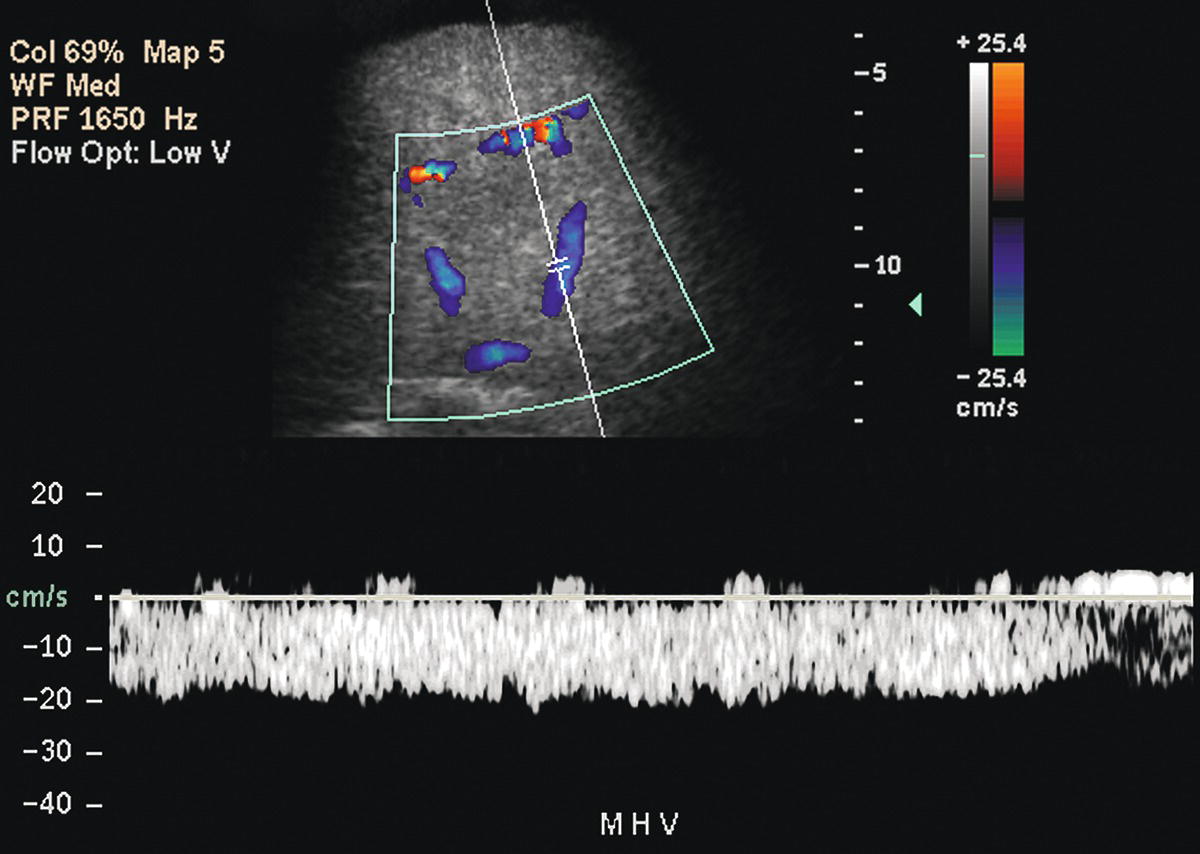
FIGURE 22.9. Portal hypertension: Doppler findings in the HVs. Spectral Doppler waveform from the middle HV demonstrates a flat, even waveform with loss of the normally transmitted cardiac pulsatility.
However, none of these progressive findings in the PV, HA, or HVs directly correlate with specific measurements of the portosystemic gradient, and not all of the above findings are specific for PHT. The most common pitfall in DUS evaluation of the PV is poor visibility due to increased depth secondary to a large liver or ascites. In some patients, flow in the PV may be of such low velocity and volume that it cannot be detected by pulsed Doppler despite optimization of imaging parameters, thereby mimicking PV thrombosis. Dilatation of the PV is a nonspecific finding and can be seen with congestive heart failure, although in patients with heart failure the waveform in the PV is typically pulsatile, and dilatation of the IVC and HVs is common with prominence of the A wave. Furthermore, the absence of the findings described above cannot be used to exclude the possibility of PHT. Therefore, Doppler ultrasound cannot be used to assess the severity or progression of PHT.
The most specific finding of PHT is the visualization of portosystemic shunts or varices, although occasionally collateral vessels may develop secondary to mesenteric or SV thrombosis. Varices may develop secondary to reversal of flow in existing veins or recanalization of embryonic channels. Up to 65% to 90% of varices can be visualized on DUS, provided one looks systematically throughout the abdomen and retroperitoneum (Fig. 22.10).15,20–22
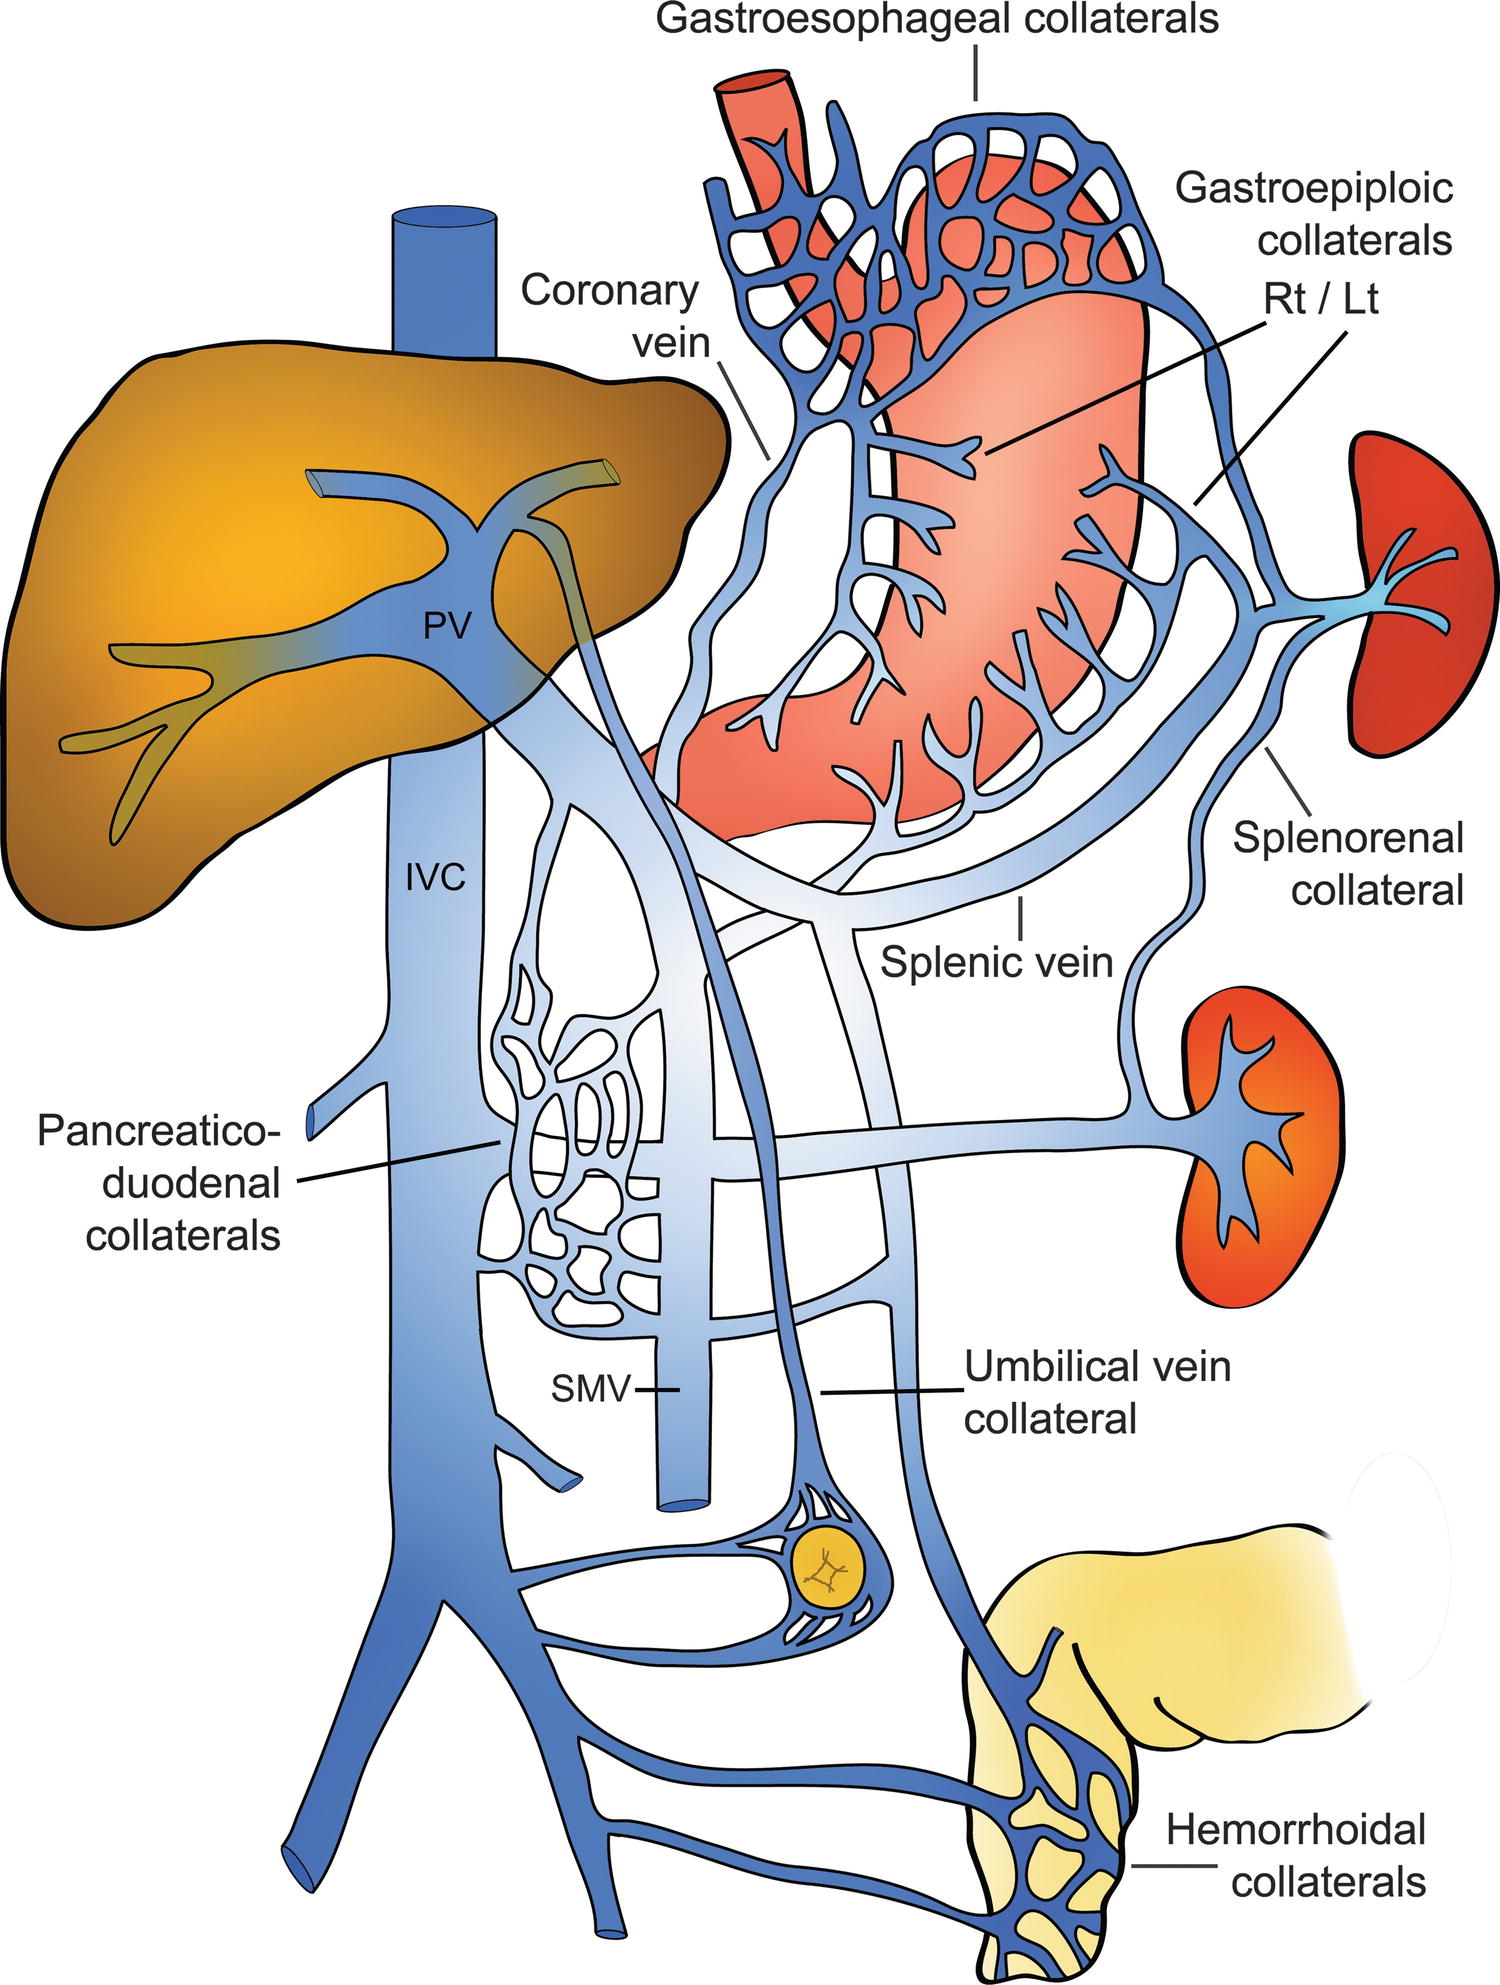
FIGURE 22.10. Diagram demonstrating the most common portosystemic collateral pathways in patients with cirrhosis.
(Modified after image 32-4, p 591 in Zweibel WJ. Ultrasound Assessment of the Hepatic. In Zweibel WJ, Pellerito JS (eds). Introduction to Vascular Ultrasonography. Philadelphia: Elsevier/Saunders, 2005, pp 585–609 [used with permission from the publisher].)
Identification of GE varices is critical, as rupture of GE varices may result in death if bleeding cannot be controlled. It is estimated that 30% to 40% of patients with Child-Pugh class A compensated cirrhosis have GE varices, and up to 60% to 65% of patients with Child-Pugh classes B and C.23,24 Hence, the incidence of varices appears to be related to the severity of the liver disease. Additionally, the risk of bleeding from GE varices is directly related to the portosystemic pressure gradient. Once the portosystemic gradient exceeds 12 to 15 mm Hg, the risk of variceal bleeding is substantially increased.3,4 Endoscopic screening is the most sensitive way of identifying GE varices, and some groups recommend that patients with established cirrhosis be routinely screened with endoscopy.25,26 However, such screening is invasive and costly. On ultrasound, GE varices are most easily found by locating the echogenic diaphragm near the aorta in a sagittal plane and imaging with color Doppler (Fig. 22.11). Alternatively, one may follow the coronary vein cephalad toward the GE junction from the portal confluence. The coronary vein runs craniocaudally in a plane parallel to the SMV or aorta and joins the SV from above, usually just medial and superior to the confluence of the SV with the SMV. The coronary vein is considered abnormal if flow is heading toward the head or if the diameter is greater than 4 mm. The risk of bleeding from GE varices increases if the coronary vein is greater than 7 mm in diameter.15,27
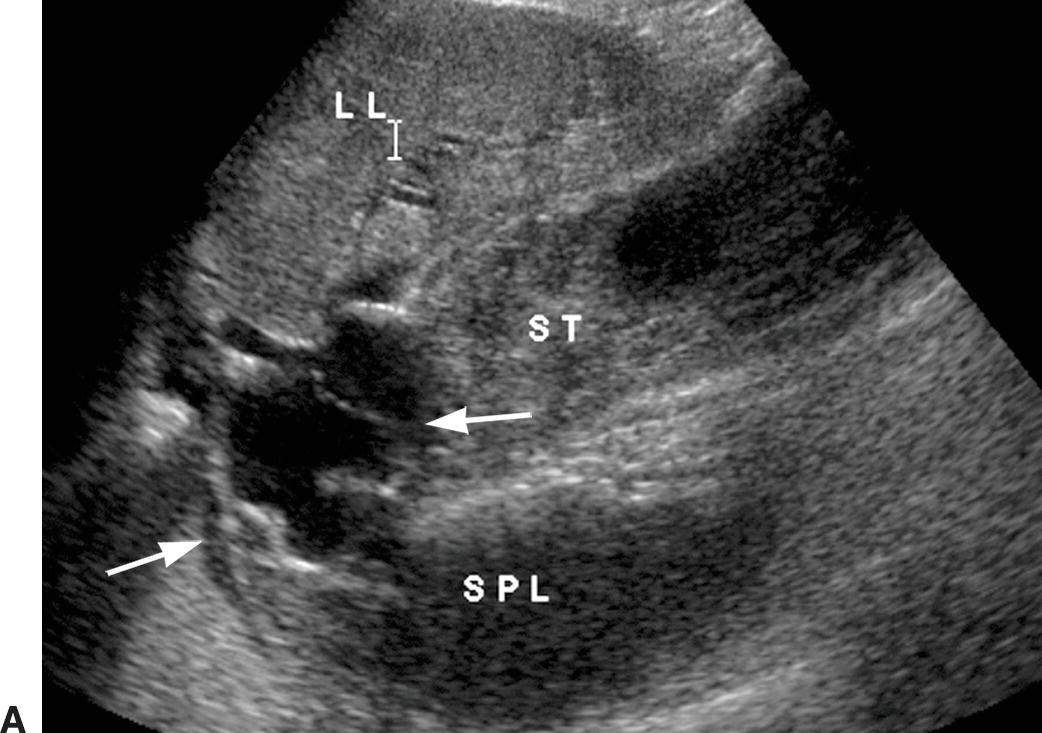
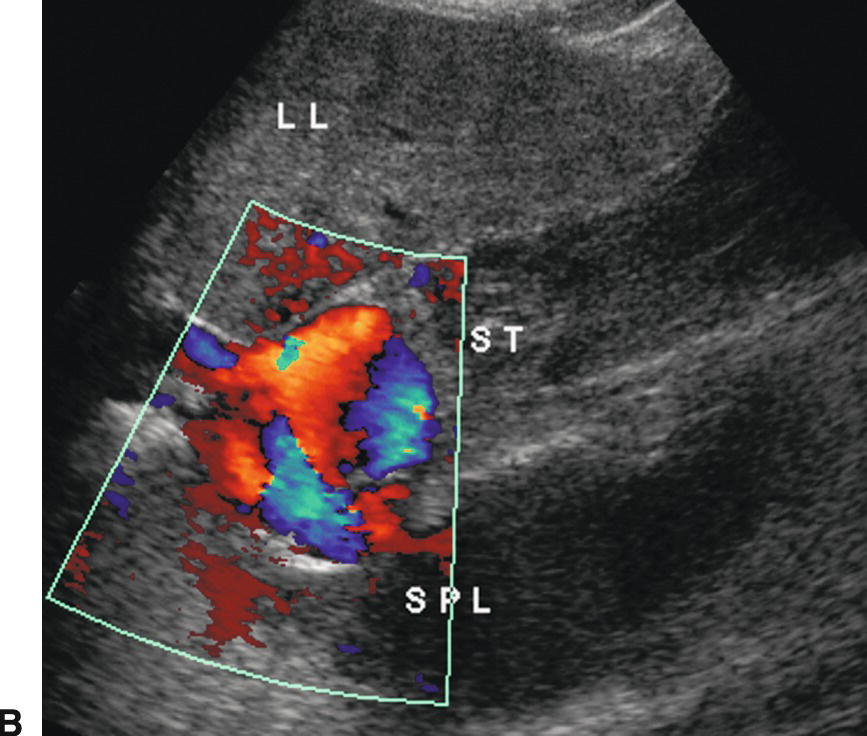
FIGURE 22.11. Gastroesophageal varices. Gray-scale (A) and color Doppler (B) images demonstrating dilated serpiginous vessels (arrows) underneath the diaphragm above the stomach. LL, left lobe of the liver, SPL, spleen, ST, stomach.
The paraumbilical vein runs in the ligamentum teres between the medial and lateral segments of the left lobe of the liver (Fig. 22.12). It extends from the left PV toward the capsule of the liver, continues anteriorly and superficially coursing under the anterior abdominal wall, and drains into the inferior epigastric veins. Blood returns to the systemic circulation via the external iliac vein. A paraumbilical vein is considered abnormal if it is greater than 3 mm in diameter or if flow extends beyond the liver capsule. A patent vein in the ligamentum teres less than 2 mm in diameter can be seen in some normal patients and can even demonstrate low-velocity (<5 cm/s) flow away from the liver capsule.28–30 If a patient with PHT develops a patent paraumbilical vein, flow often remains hepatopetal in the main PV despite elevation of the portosystemic gradient. However, a patent paraumbilical vein does not significantly decompress the liver or reduce the portosystemic gradient. Hence, patients with patent paraumbilical veins remain at risk for developing GE varices.
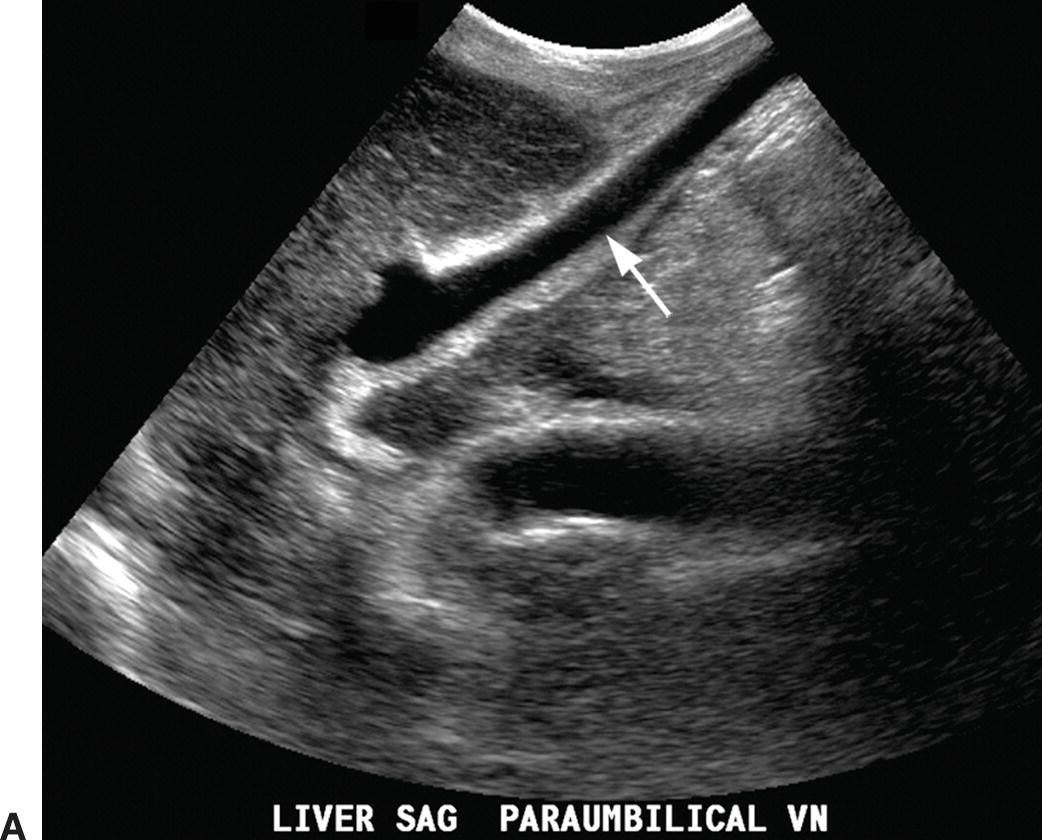
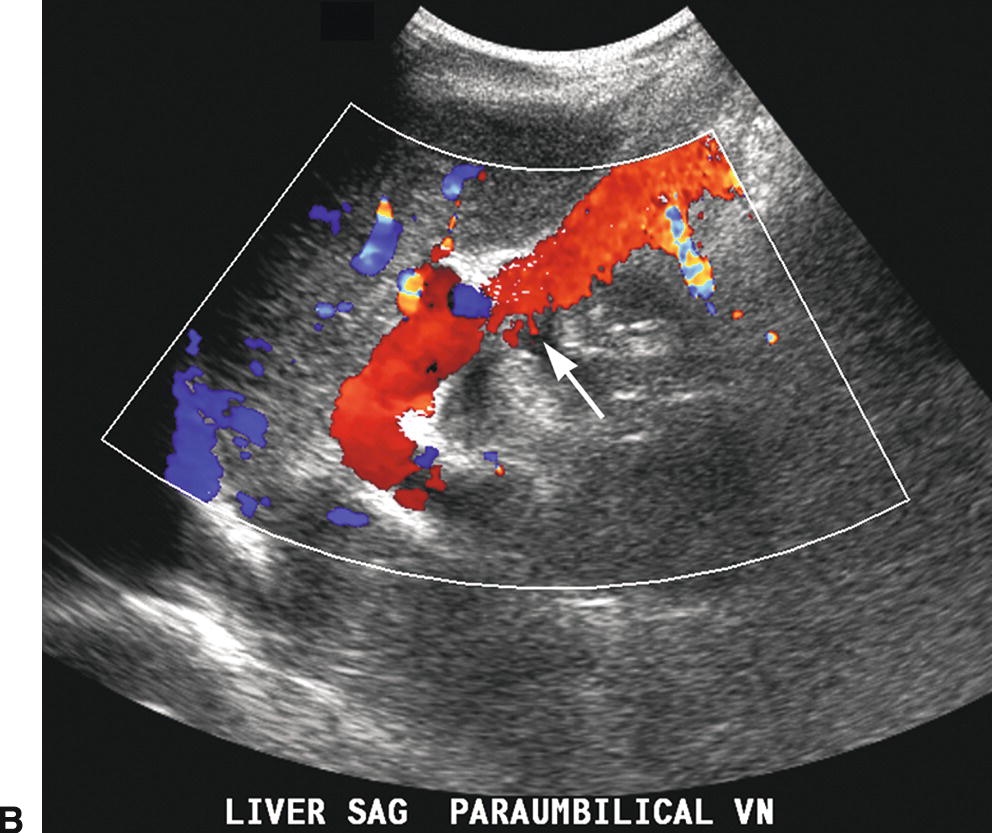
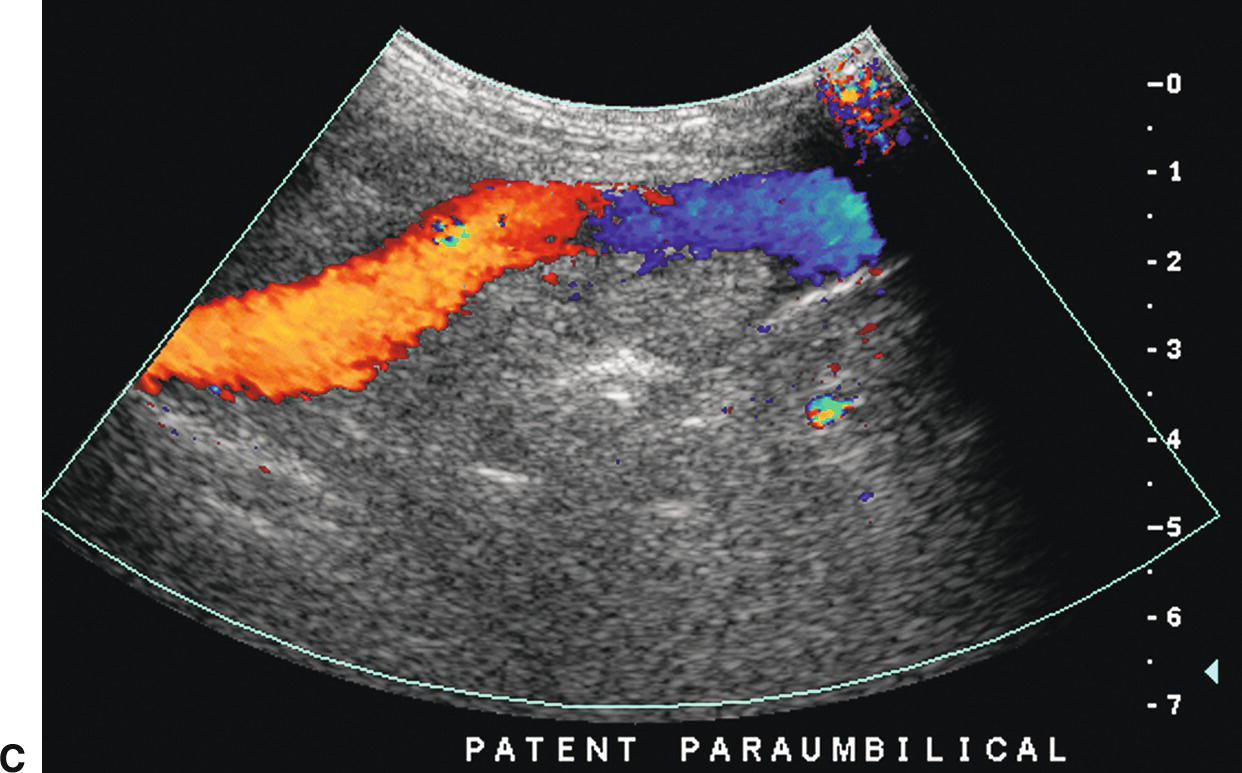
FIGURE 22.12. Patent paraumbilical vein. Gray-scale (A) and color (B) Doppler images demonstrating an enlarged patent paraumbilical vein (arrow). This collateral arises from the umbilical segment of the left portal vein and runs within the echogenic falciform ligament directing flow toward the liver capsule (red). After exiting the liver, this collateral travels inferiorly into the pelvis running under the anterior abdominal wall (C).
Short gastric or left gastric varices are found below the left lobe of the liver (Fig. 22.13). In patients with spontaneous splenorenal shunts, a direct communication, often “U-shaped,” will be observed between the splenic and left renal veins (Fig. 22.14). The left renal vein is typically dilated and flow will be reversed in the main PV. Spontaneous portocaval shunts are less common, but if large are associated with focal dilatation of the IVC at the level of the shunt as well as hepatic encephalopathy, since a large amount of blood draining from the bowel will be shunted into the systemic circulation without detoxification by the liver. Surgical shunts appear similar to spontaneous shunts on DUS examination. Although these are the most readily ultrasound-detected variceal patterns, varices can occur virtually anywhere in the retroperitoneum or abdomen (Figs. 22.15 and 22.16).
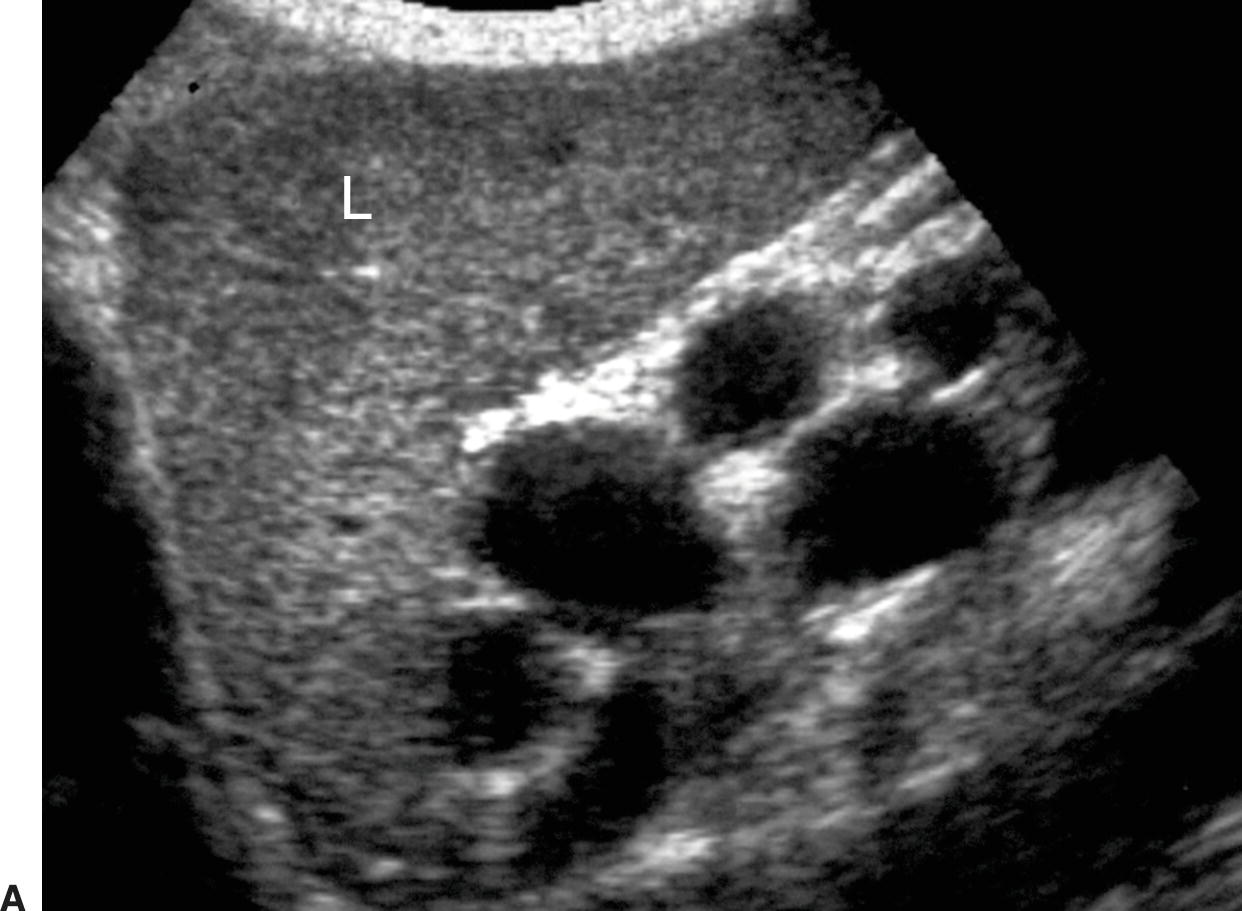
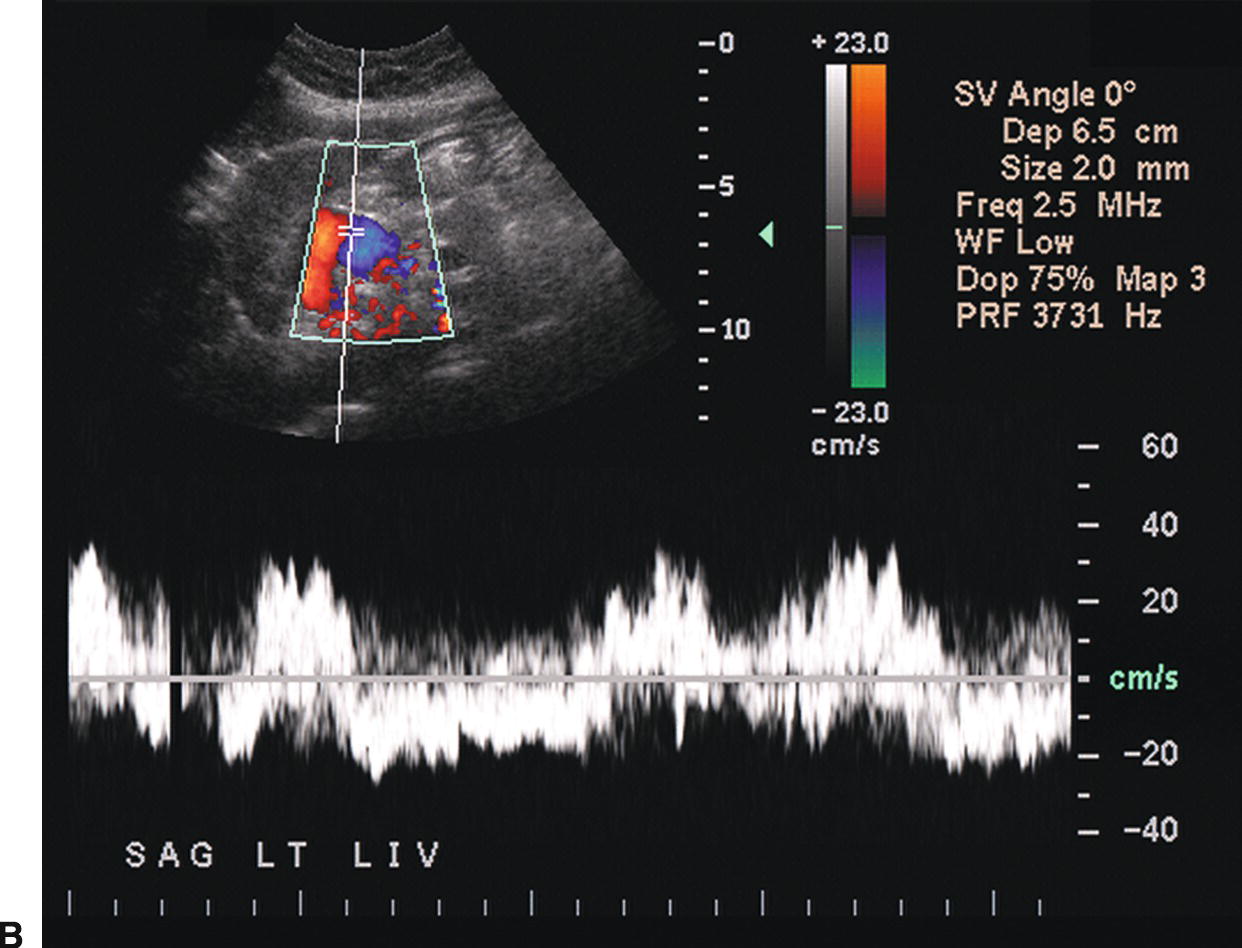
FIGURE 22.13. Short Gastric Varices. Gray-scale (A) and duplex (B) images demonstrating massively dilated veins underneath the left lobe of the liver (L). Such varices usually originate from the short gastric veins.
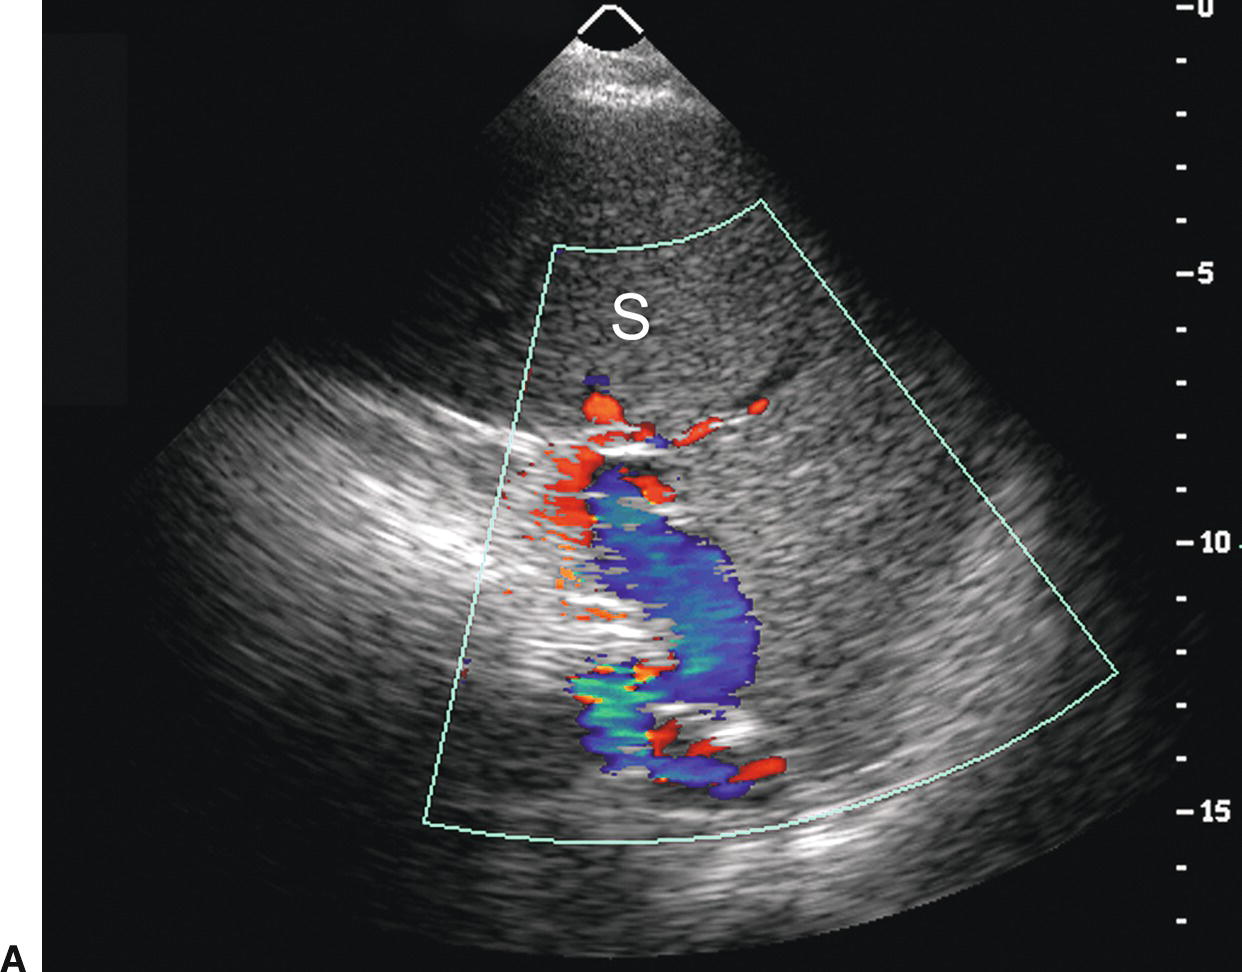
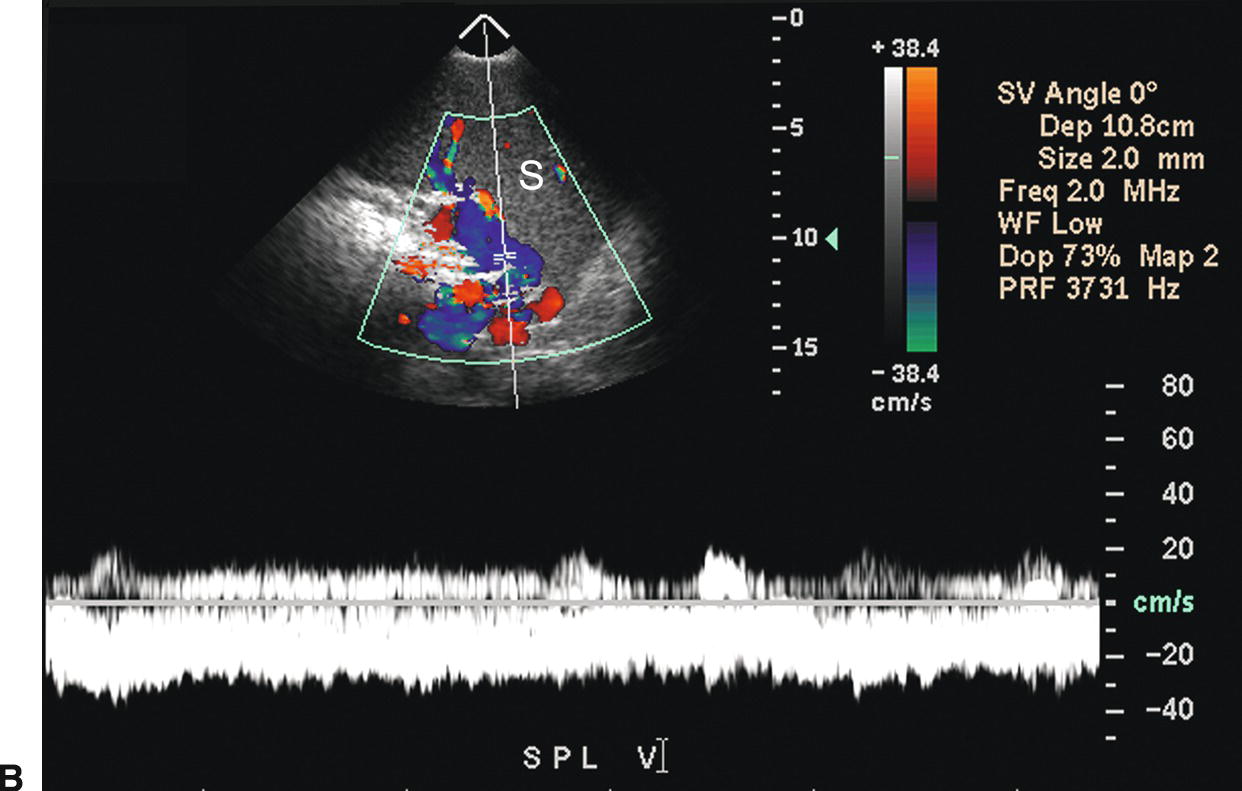
FIGURE 22.14. Spontaneous splenorenal shunt. Color Doppler (A) and duplex (B) images demonstrating an enlarged SV coursing inferiorly from the splenic hilum. This large varix makes a “U” turn to join the left renal vein. S, spleen.
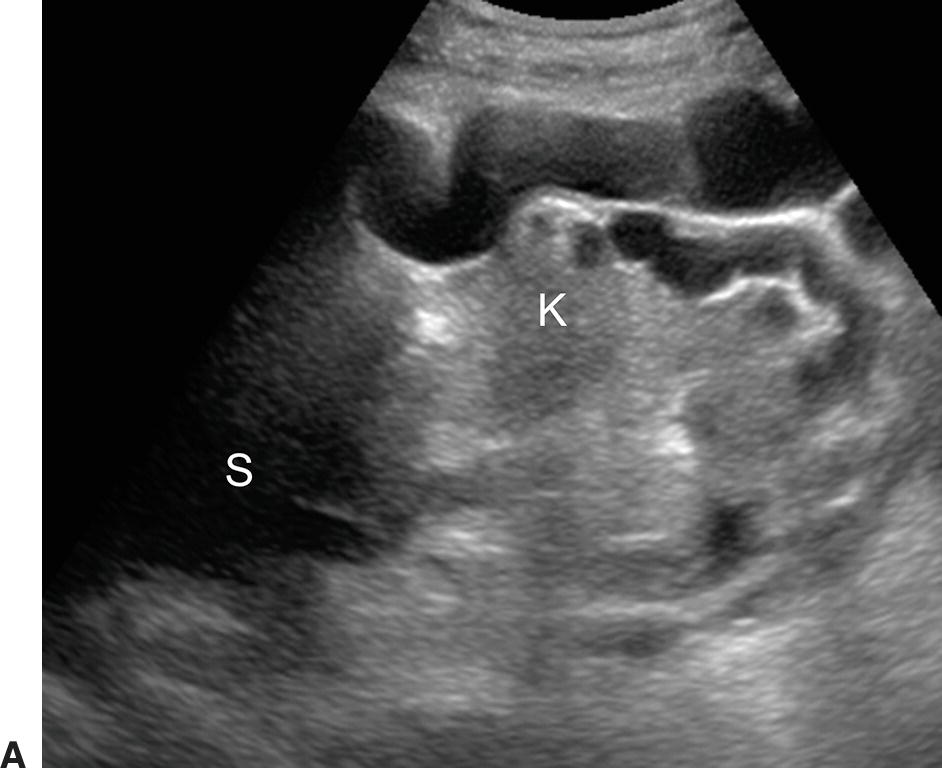
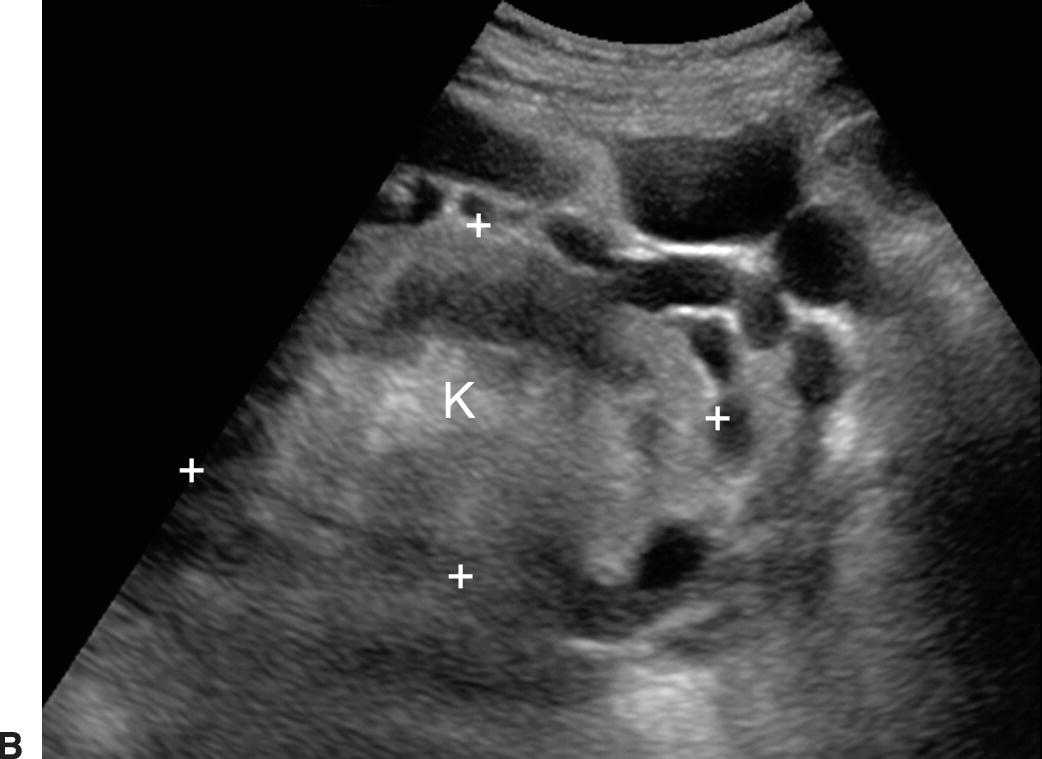
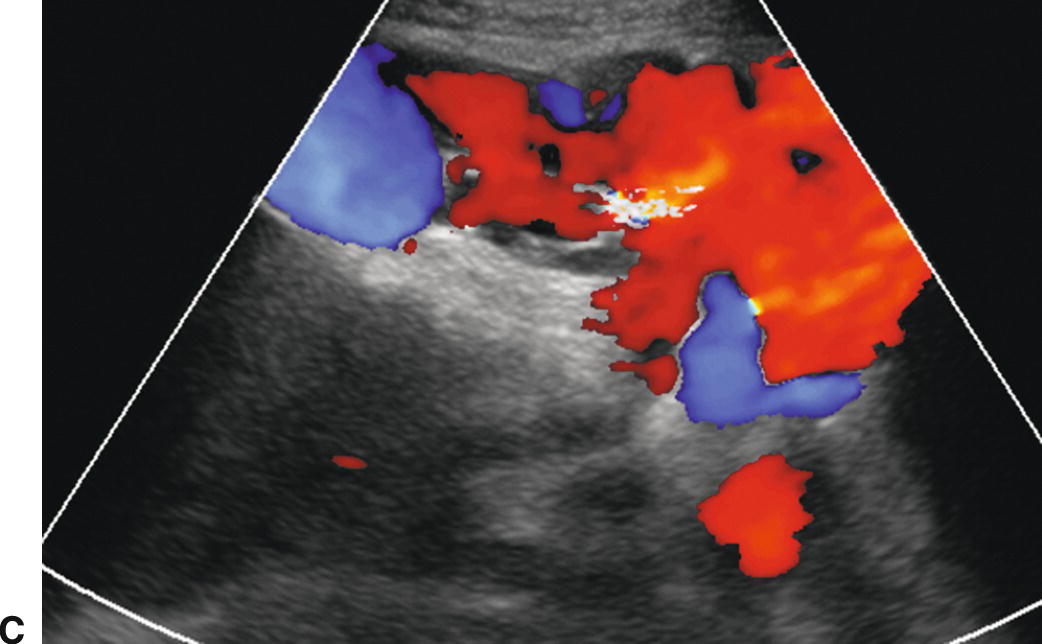
FIGURE 22.15. Retroperitoneal varices. Gray-scale (A) and (B) and color Doppler (C) images demonstrating large collateral vessels lateral to the spleen and left kidney. S, spleen. K, left kidney.
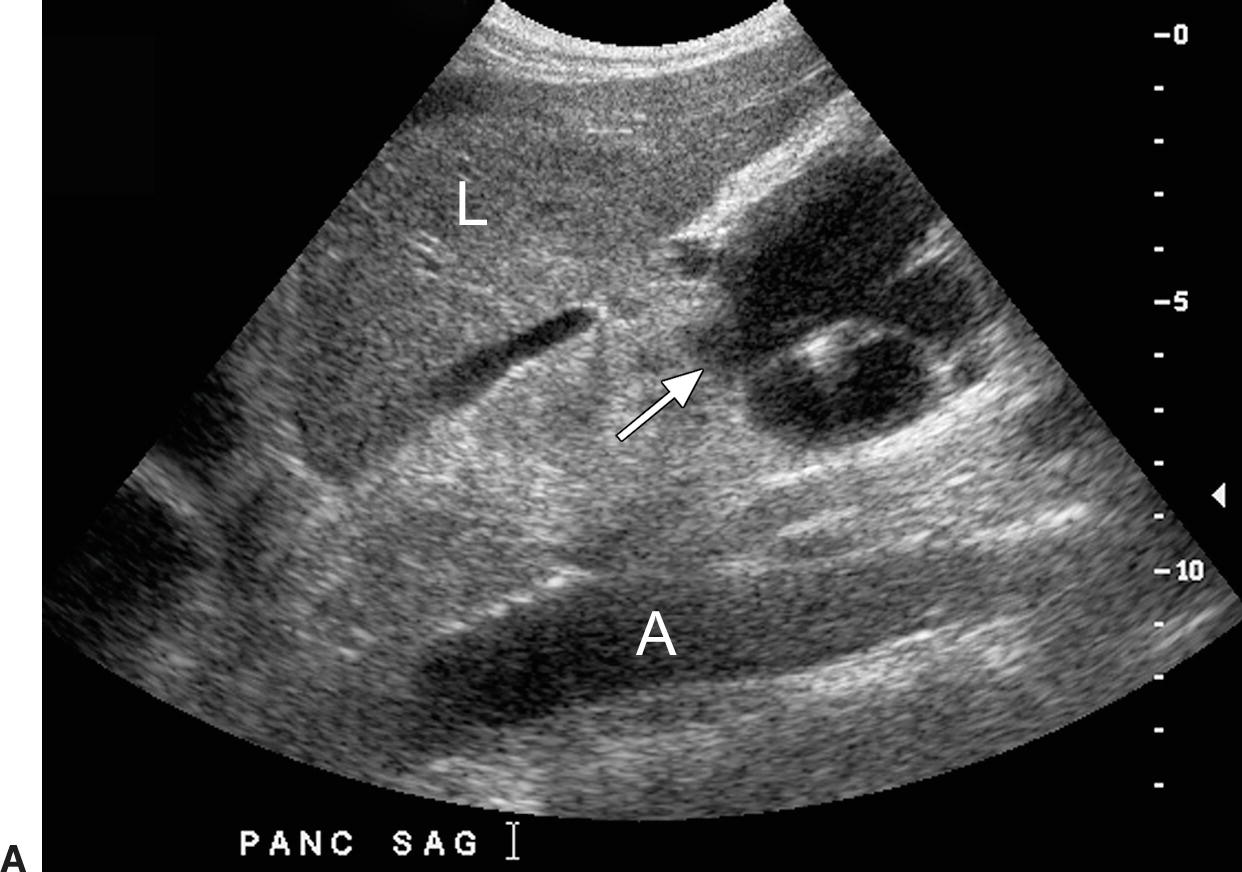
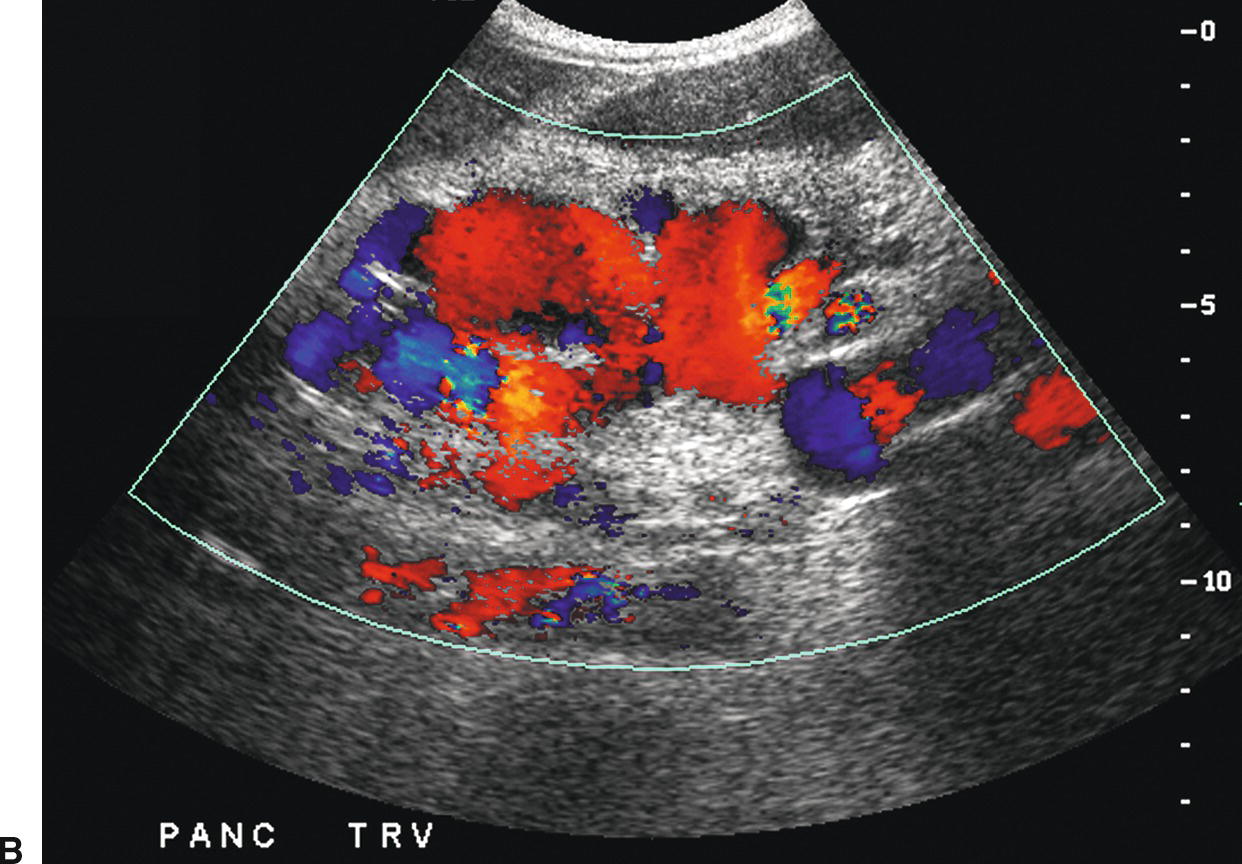
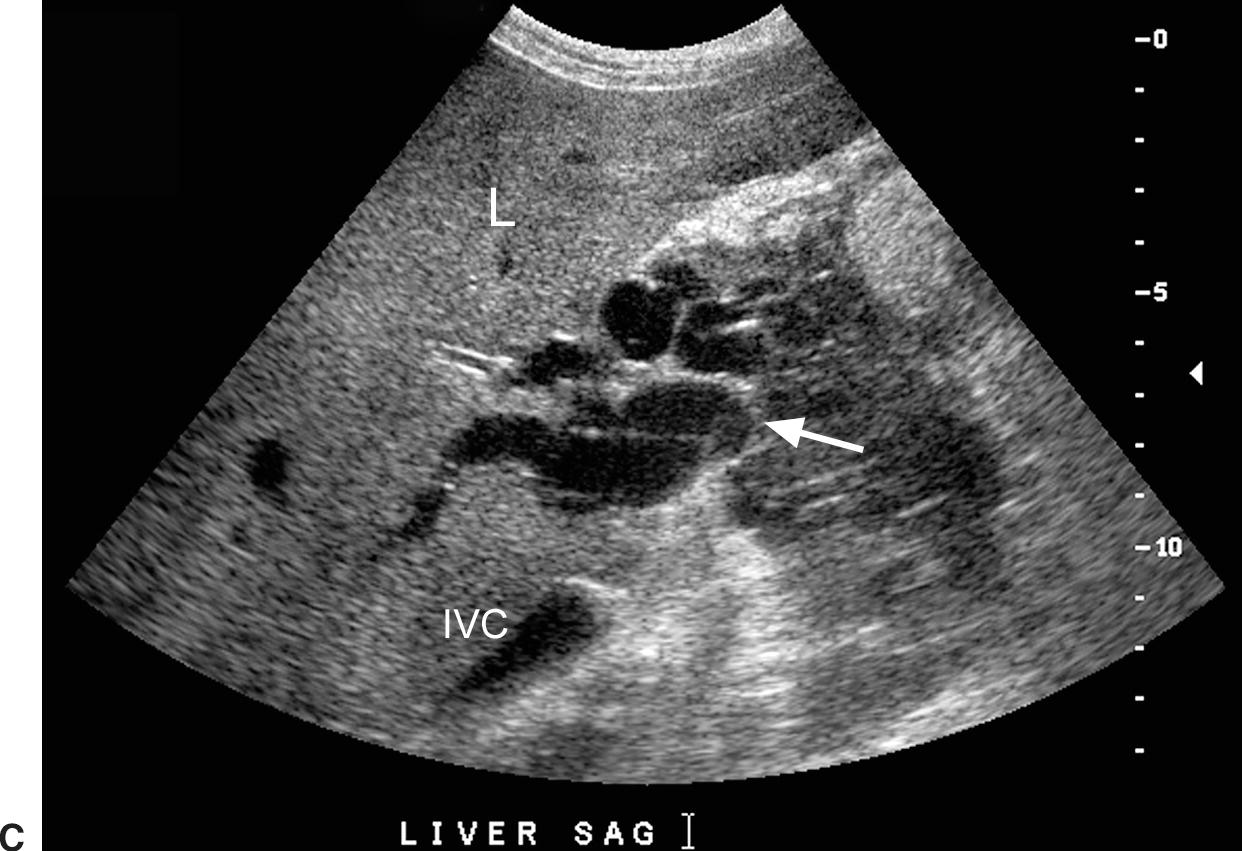
FIGURE 22.16. Varices. A,Sagittal gray-scale image demonstrating large collaterals (arrow) below the left lobe of the liver (L) anterior to the celiac axis and superior mesenteric arteries. A, aorta. B,Transverse color Doppler image demonstrating these large midline varices. C,This patient also had periportal varices (arrow). Varices involving multiple collateral pathways are common in an individual patient. IVC, inferior vena cava. L, liver.
It is estimated that approximately one-third of patients with GE varices will present with significant variceal bleeding.24,31,32 Risk factors for hemorrhage include large varices, a portosystemic gradient greater than 12 to 15 mm Hg, a coronary vein greater than 7 mm in diameter, ascites, acute alcohol binge, and exercise.3,4,15,33 Medical management of significant bleeding from GE varices includes endoscopic sclerotherapy, variceal band ligation, vasoconstrictors (vasopressin, nitroglycerin, somatostatin, and octreotide), and balloon tamponade. Bleeding is controlled by a combination of endoscopic and pharmacologic treatment in up to 80% to 90% of cases.24,32,34–36 However, approximately 70% of patients will rebleed,35–37 and the mortality rate in such patients is extremely high (30% to 40%) despite aggressive medical management including prophylactic treatment with β-blockers.35–38
For patients with persistent uncontrolled bleeding from GE varices or recurrent bleeding following medical management, the next step is placement of a TIPS. The role of TIPS placement in managing patients with cirrhosis has evolved over the past few decades, and currently, TIPS placement is preferred over creation of a surgical shunt as it avoids general anesthesia and major abdominal surgery. In addition, TIPS placement does not alter the extrahepatic vascular anatomy, allowing a patient to remain on the liver transplantation list for definitive treatment of liver disease. The most common current indications for TIPS placement are secondary prevention of variceal bleeding, variceal bleeding refractory to medical and endoscopic therapy, and ascites refractory to medical management.39 Less frequent but also commonly accepted indications for TIPS placement include hepatorenal syndrome, BCS, hepatic venoocclusive disease, and hepatic hydrothorax.39 Generally accepted absolute contraindications to TIPS placement include severe right heart failure (as shunting of significant blood volume into the IVC through the TIPS may produce volume overload and precipitate cardiac decompensation), severe tricuspid regurgitation (TR), severe pulmonary hypertension (mean pulmonary pressure >45 mm Hg), and uncontrolled sepsis.39 Other often accepted contraindications to TIPS placement include preexisting severe hepatic encephalopathy (as creation of a TIPS may worsen the encephalopathy), inadequate liver reserve (as TIPS placement may result in fulminant liver failure on the basis of ischemia in such patients), sepsis, and multiple hepatic cysts (due to lack of adequate surrounding liver parenchyma that is necessary to keep the TIPS stable in location).39 Relative contraindications, while dependent upon the aggressiveness of the interventionist and the expected length of patient survival, include HCC (especially in the right lobe or central in location), biliary obstruction (due to risk of bile leak), and moderate pulmonary hypertension.39 The presence of PV thrombosis makes TIPS placement difficult although not impossible.40
Most centers report close to a 90% technical success rate for TIPS placement,41–43 with bleeding controlled in up to 90% of patients43–46 and an approximately 2% mortality rate.47 The complication rate ranges in most series from approximately 10% to 16%.45,46 Factors that increase post-TIPS mortality include Childs-Pugh class C, emergent placement for acute uncontrolled variceal hemorrhage, serum bilirubin greater than 3 mg/dL, alanine aminotransferase levels greater than 100 IU/L, and pre-TIPS encephalopathy.48 More recently, the Model for End-Stage Liver Disease (MELD) score, which is based on serum creatinine, INR, and bilirubin levels, has become a widely used standard to predict 3-month post-TIPS mortality. A score greater than 18 is associated with significantly increased mortality.49–51 Causes of acute morbidity include hemorrhage from transcapsular puncture, which may occur in up to 33% of cases,39 stent migration, cardiopulmonary failure (due to volume overload), infection, and hepatic encephalopathy. Hepatic encephalopathy is most likely caused by shunting of ammonia and other potentially toxic metabolites directly into the systemic circulation without being detoxified by the liver. The larger the TIPS diameter, the more blood is shunted through the liver and the higher the risk of hepatic encephalopathy. Shunt reduction or occlusion may be required if the patient does not respond to protein restriction, lactulose, and vancomycin therapy.
Recurrent variceal bleeding following successful TIPS placement is usually due to TIPS malfunction from stenosis, thrombosis, or stent retraction. Stenoses within a TIPS usually occur at the hepatic end. Causes of early TIPS stenoses have been postulated to include biliary-TIPS fistulae due to thrombogenic and inflammatory factors in the bile, kinking, or other technical factors.52 Later TIPS stenoses or thromboses are most commonly caused by pseudointimal hyperplasia and turbulent blood flow, which may cause endothelial damage resulting in an outflow stenosis in the draining HV.52 TIPS stenoses and thromboses are relatively common when “bare” stents are used. Primary patency rates for bare stents are reported to be in the range of 25% to 78% at 1 year39,43,45,53,54 and as low as 13% at 5 years.53 If stenoses in bare stents are corrected, the assisted patency rate is higher, close to 85% at 1 year41,45 and 36% at 5 years.53
The recent introduction of the partially covered Viatorr polytetrafluoroethylene (PTFE) stent graft for TIPS creation has significantly improved primary patency, with a reported 6-month patency rate of up to 90% and a 24-month patency rate of up to 75%.55–57 The Viatorr stent graft has a 2-cm segment of bare metal stent that is placed in the PV and a variable length of PTFE-covered stent extending to the HV-IVC confluence. Use of the partially covered Viatorr stent graft has now become standard of care for TIPS creation. However, even with the partially covered stent graft, identifying an underlying stenosis in a TIPS before it becomes symptomatic is of the utmost clinical importance, as reintervention and revision may prevent TIPS failure. Since most TIPS stenoses are found in asymptomatic patients, surveillance is still often recommended.58 DUS is the least invasive and least expensive method for screening patients for TIPS stenoses. A baseline examination followed by DUS at 6 months, 12 months, and then annually is considered a reasonable surveillance schedule.40 However, because the primary patency rate of PTFE-covered stents is so high, it remains controversial whether or not long-term surveillance with DUS is necessary.59
Duplex Follow-up of TIPS Procedures
The DUS imaging protocol for patients with TIPS should include evaluation for recurrent varices or ascites, since recurrence suggests that the TIPS is not working effectively and is likely to be stenosed or occluded. Direct interrogation of the shunt typically requires a 2.5-MHz curved array transducer, as the TIPS is usually placed deep in the right lobe of the liver. Doppler interrogation requires numerous acoustic windows and velocity scales. Higher scales are required for interrogation of the TIPS than for the intrahepatic veins because velocities are typically substantially higher within a normally functioning TIPS. PV and shunt velocity will decrease with deep inspiration, so velocity should be measured at the end of gentle respiration. Velocities should be obtained from the main PV 2 to 3 cm proximal to the TIPS, in the proximal, mid, and distal shunt, and in the IVC or draining vein. Direction of flow should be noted in the main and intrahepatic portal, splenic, and hepatic veins.
The stent walls are very echogenic and should be smooth and parallel. When covered stents are first placed, air embedded in the covering fabric typically causes dense shadowing along the entire length of the stent, preventing Doppler interrogation and mimicking thrombosis (Fig. 22.17).40,60 This air is gradually absorbed, and the shadowing disappears within 2 to 3 days, allowing ultrasound evaluation. Color should fill the lumen of the stent and extend to the echogenic walls (Fig. 22.18A). Spectral Doppler findings in patients with TIPS are variable and likely depend on the cause and severity of PHT, the diameter and type of stent graft used, and the residual portosystemic gradient following TIPS placement. In general, flow velocity is high in the shunt, ranging from 100 to 200 cm/s, and there is little change over the length of the shunt in a given patient (see Figs. 22.18B-D). Increased flow velocity (>40 cm/s) will be observed in the main PV (see Fig. 22.18E), and flow in the HA is also typically increased (>130 cm/s).45,46,61–65 Optimally, the gradient across the shunt following TIPS placement will be less than the residual gradient in the liver parenchyma and, therefore, flow will be directed toward the shunt (hepatofugal) in the right and left intrahepatic PVs (see Fig. 22.18F).40 However, depending upon technical success and the effect of reduced hepatic congestion on the residual portosystemic gradient in the liver parenchyma, in some patients, the residual parenchymal gradient may not be higher than the gradient across the TIPS in all segments of the liver. In such patients, flow may not reverse in all of the intrahepatic PVs. For this reason, a baseline examination of the intrahepatic PVs is extremely important to assess the direction of flow.
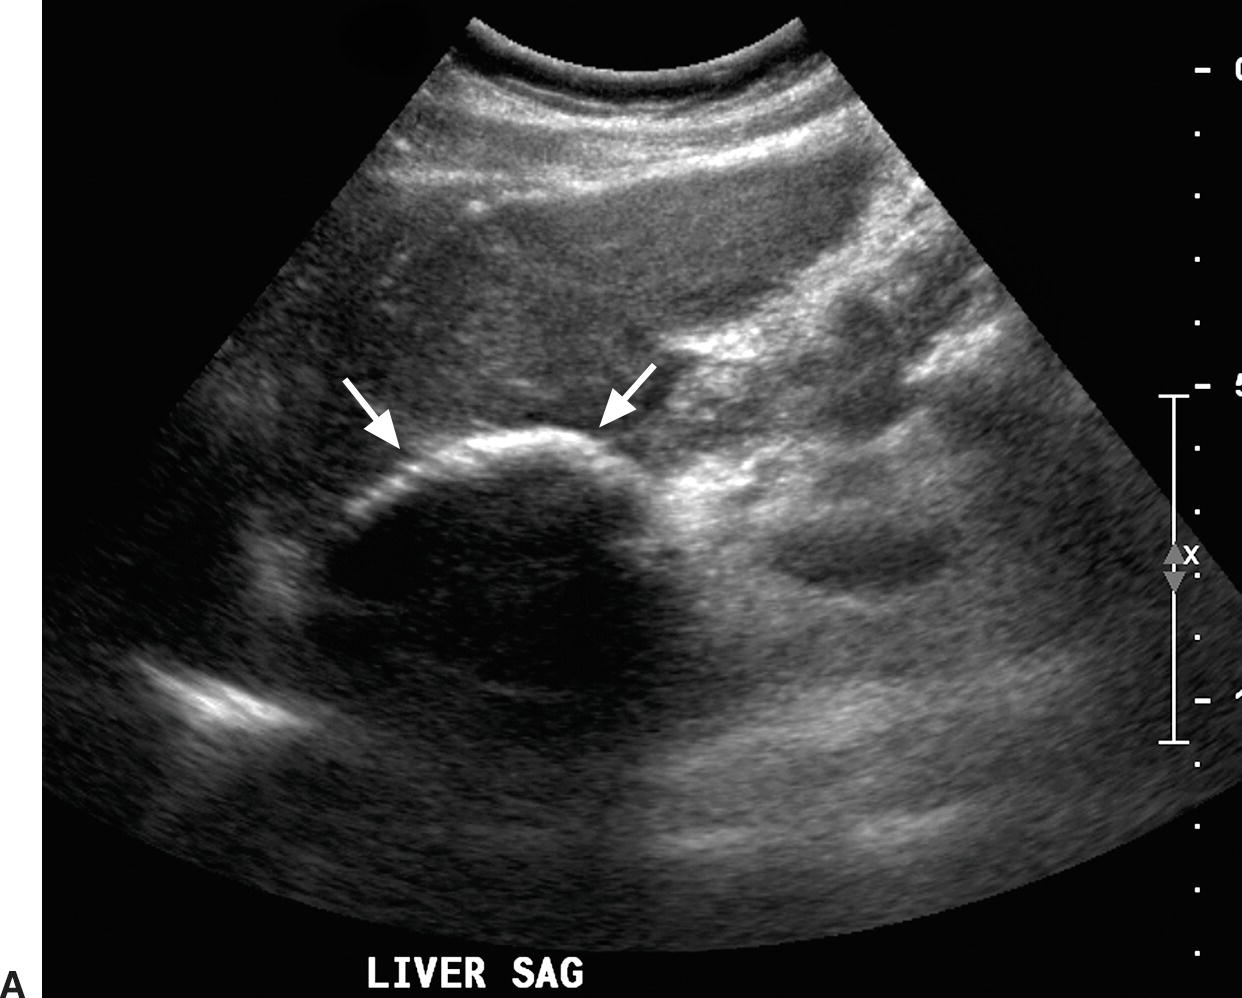
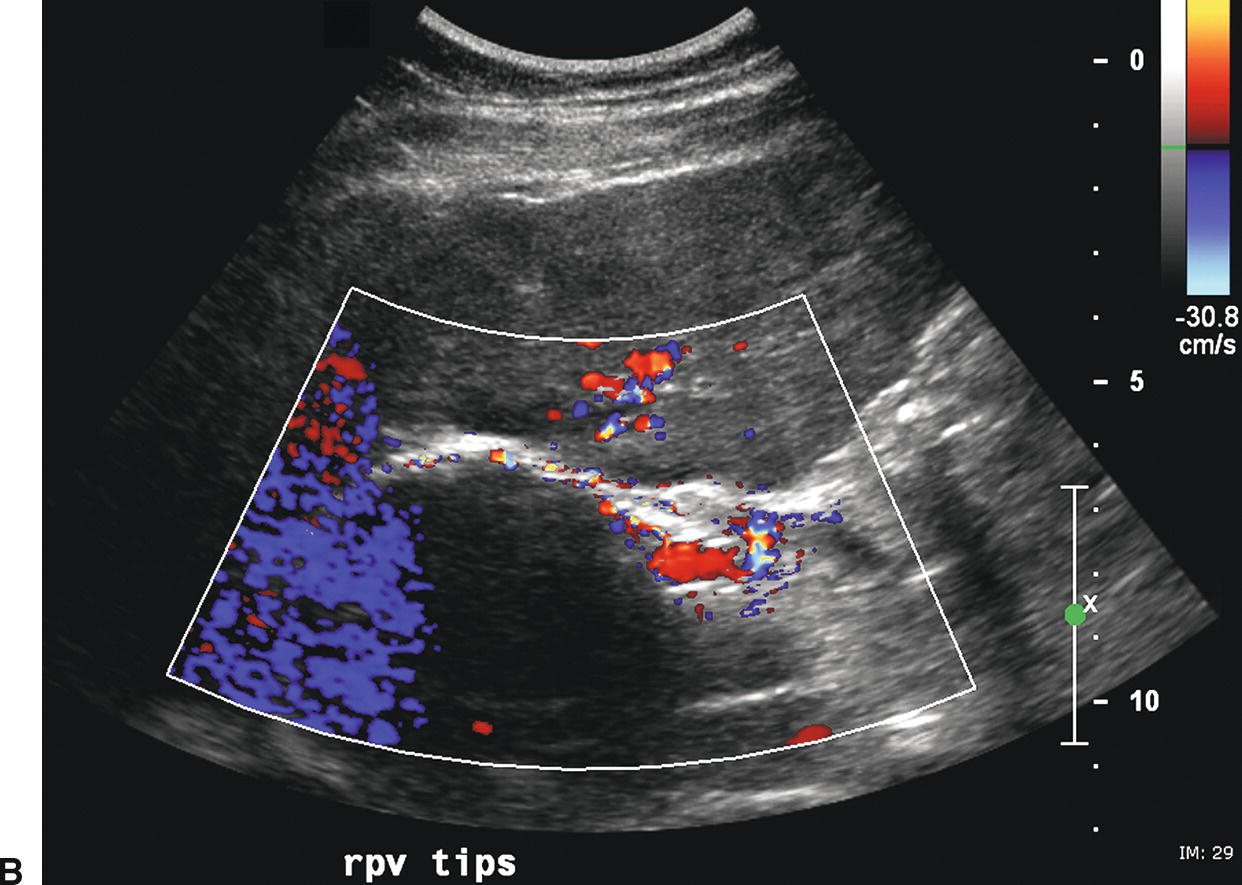
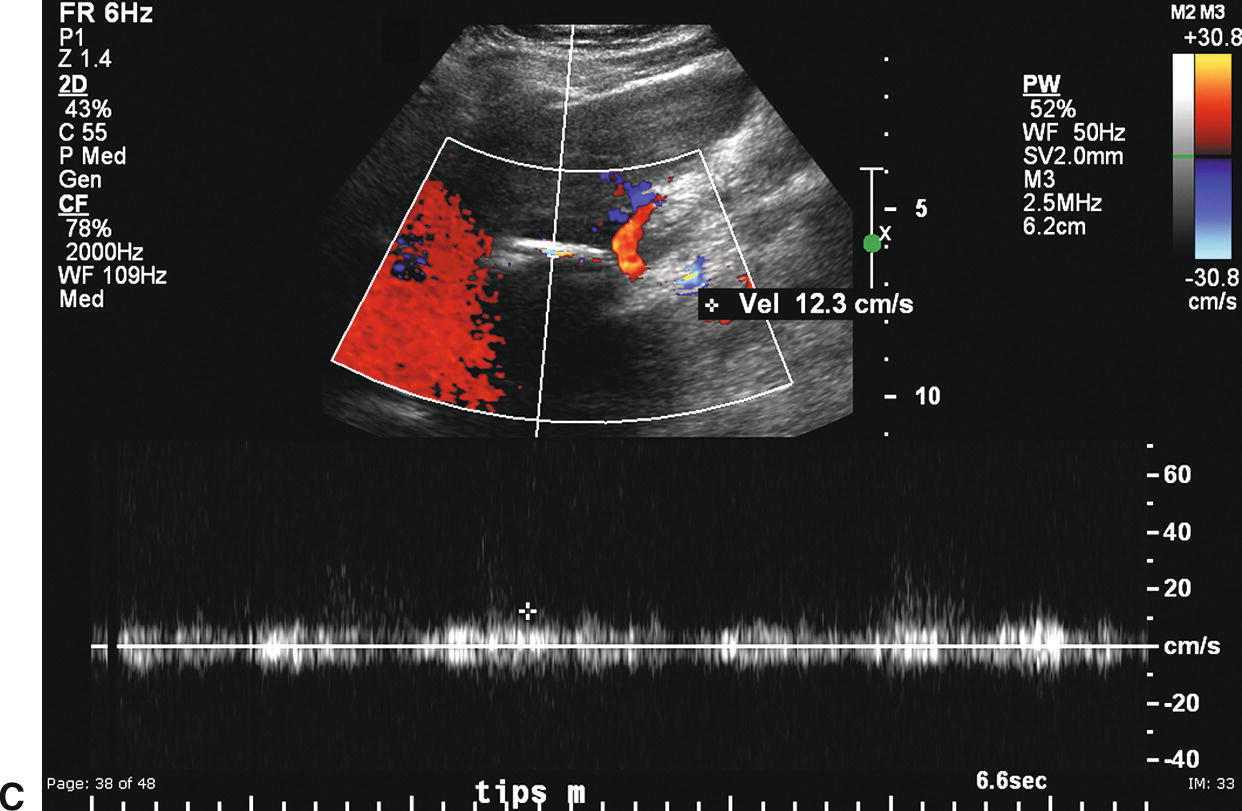
FIGURE 22.17. Covered polytetrafluoroethylene (PTFE) transjugular intrahepatic portosystemic shunt (TIPS): Early postplacement ultrasound appearance—pitfall mimicking stenosis/occlusion. A,Sagittal gray-scale image obtained 6 hours postplacement demonstrates the curvilinear, echogenic near wall (arrows). The lumen and back wall are obscured by shadowing from air in the fabric of the covered stent. B,Color Doppler image demonstrates a thin rim of color in the TIPS lumen just under the near wall. C,Spectral Doppler waveform reveals very low-velocity flow of 12.3 cm/s. Initially, this was interpreted as a near TIPS occlusion or high-grade stenosis. However, when a PTFE-covered TIPS is evaluated with Doppler early postplacement (<72 hours), air within the wall of the stent commonly obscures visualization of the lumen. Follow-up ultrasound 3 days later demonstrated that the TIPS was widely patent.
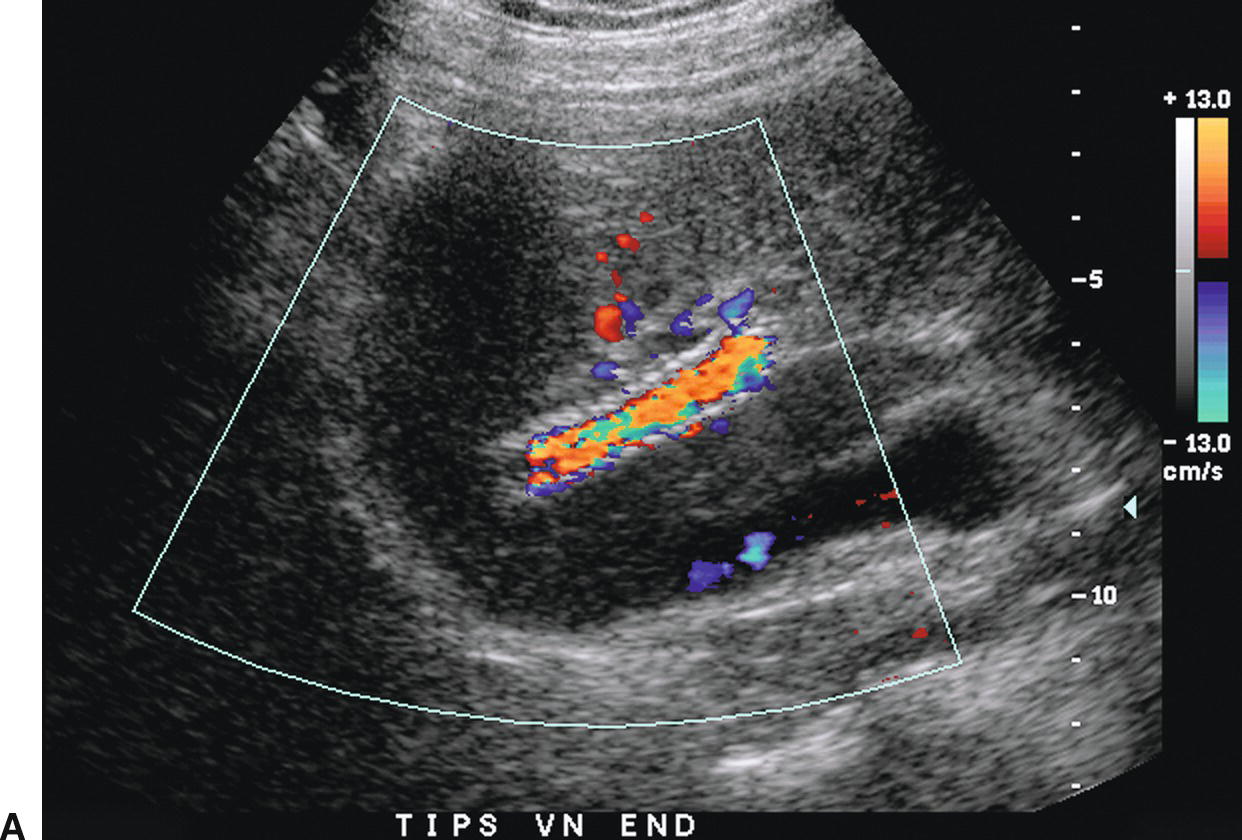
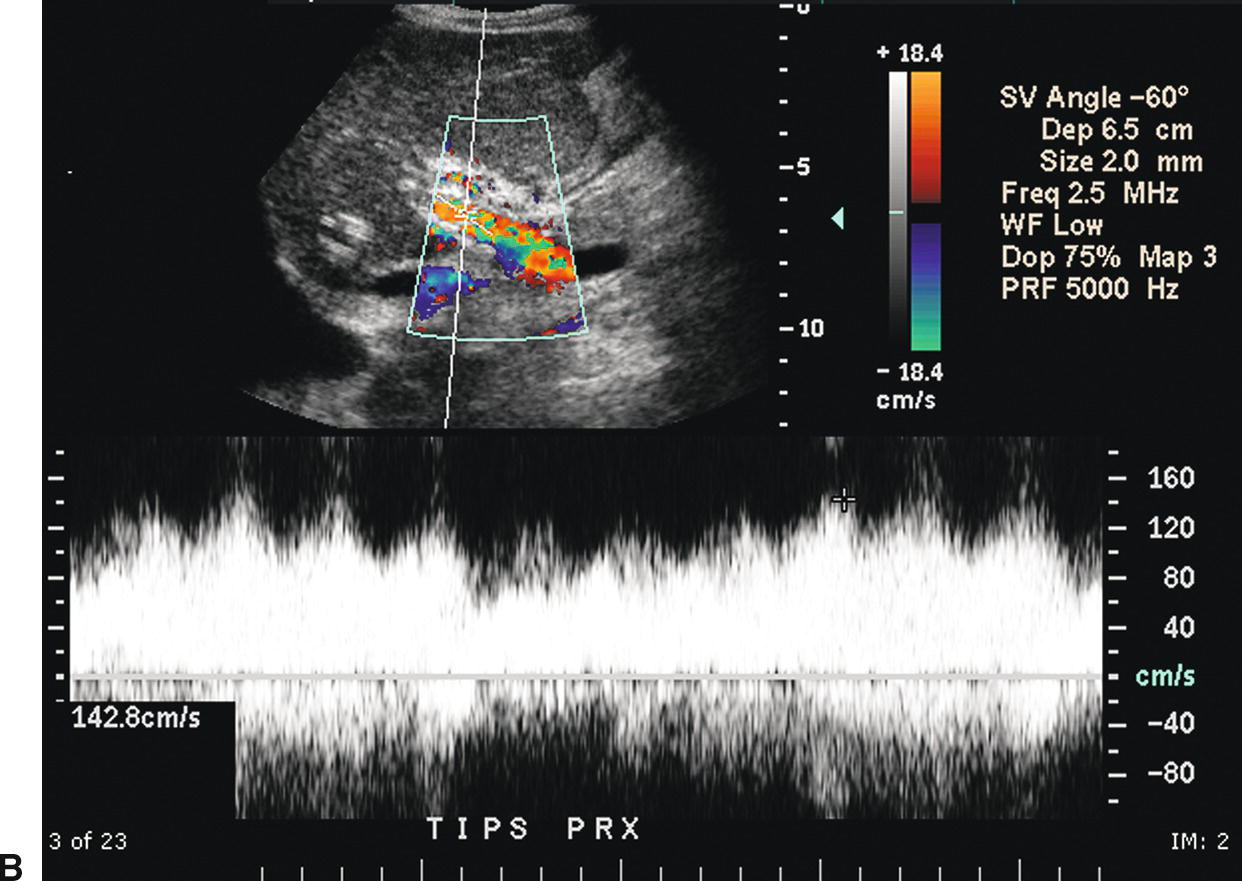
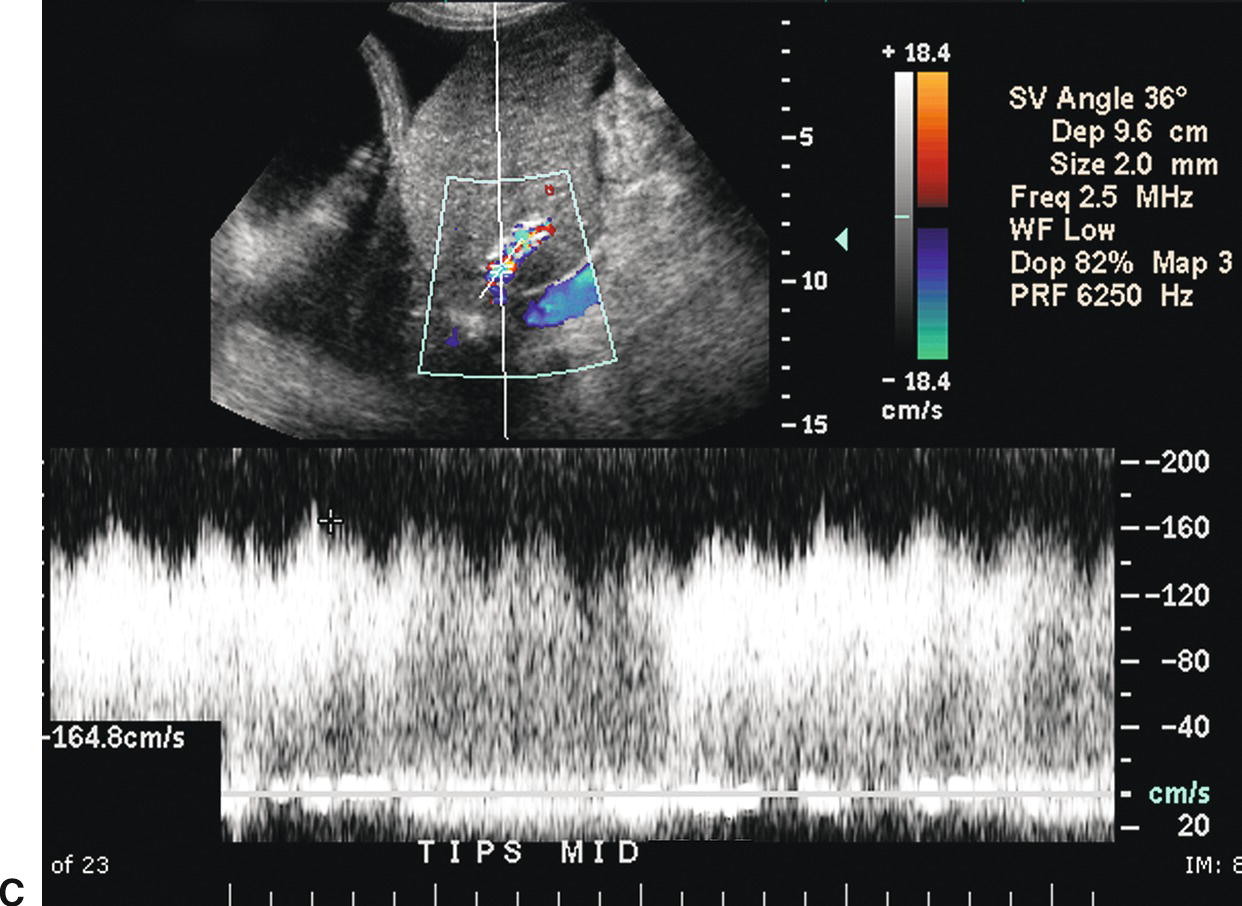
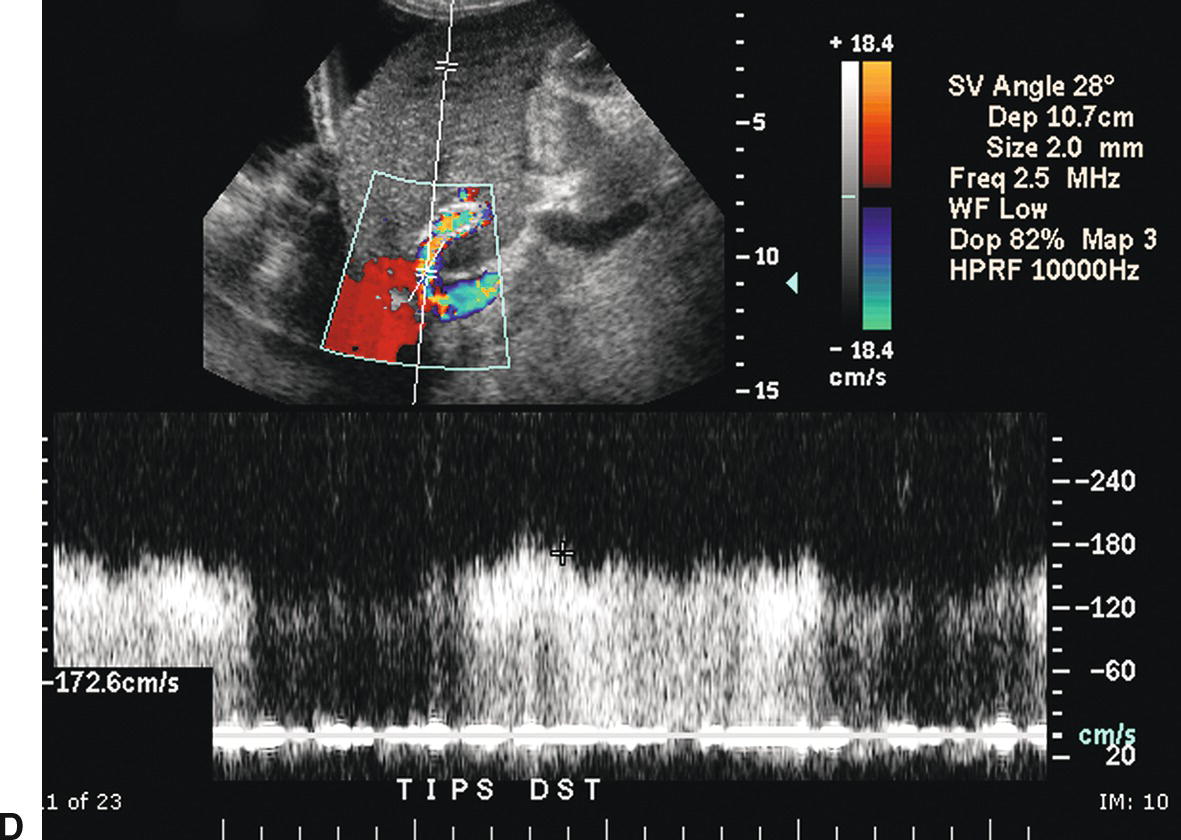
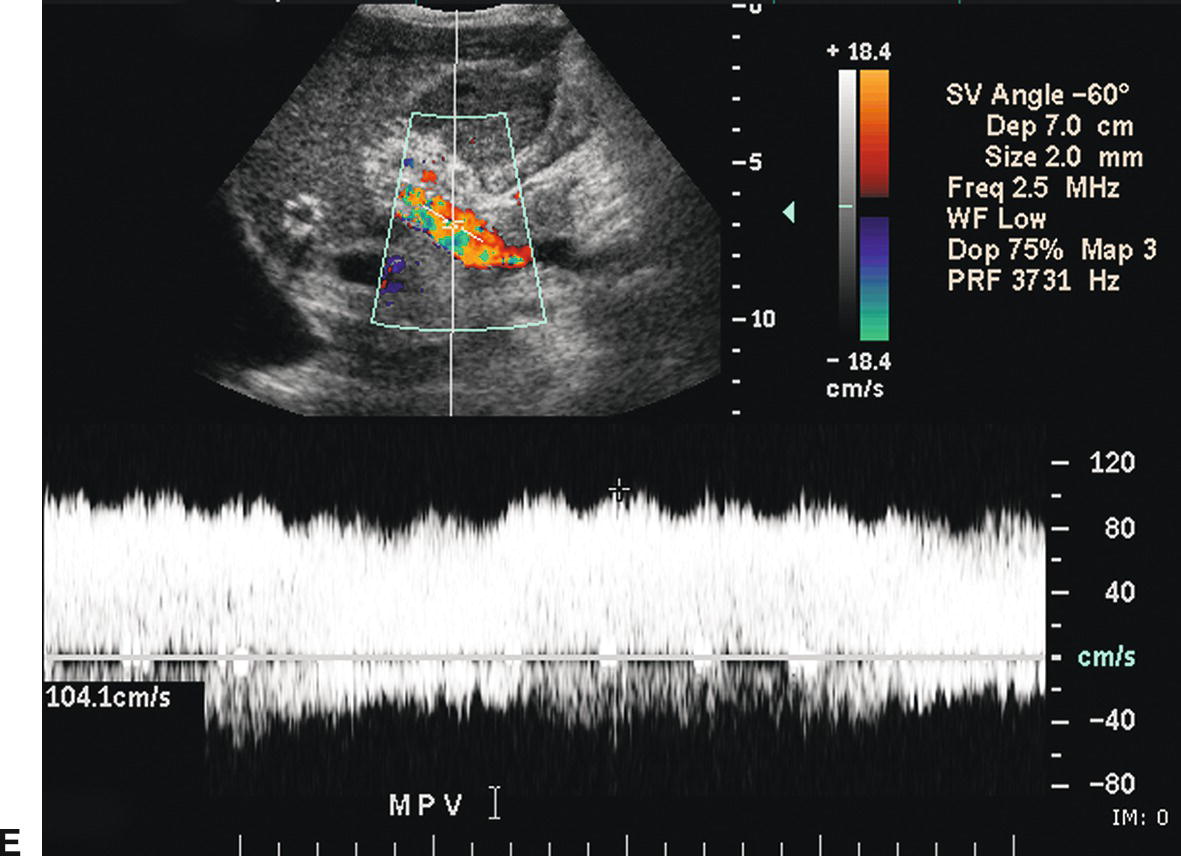
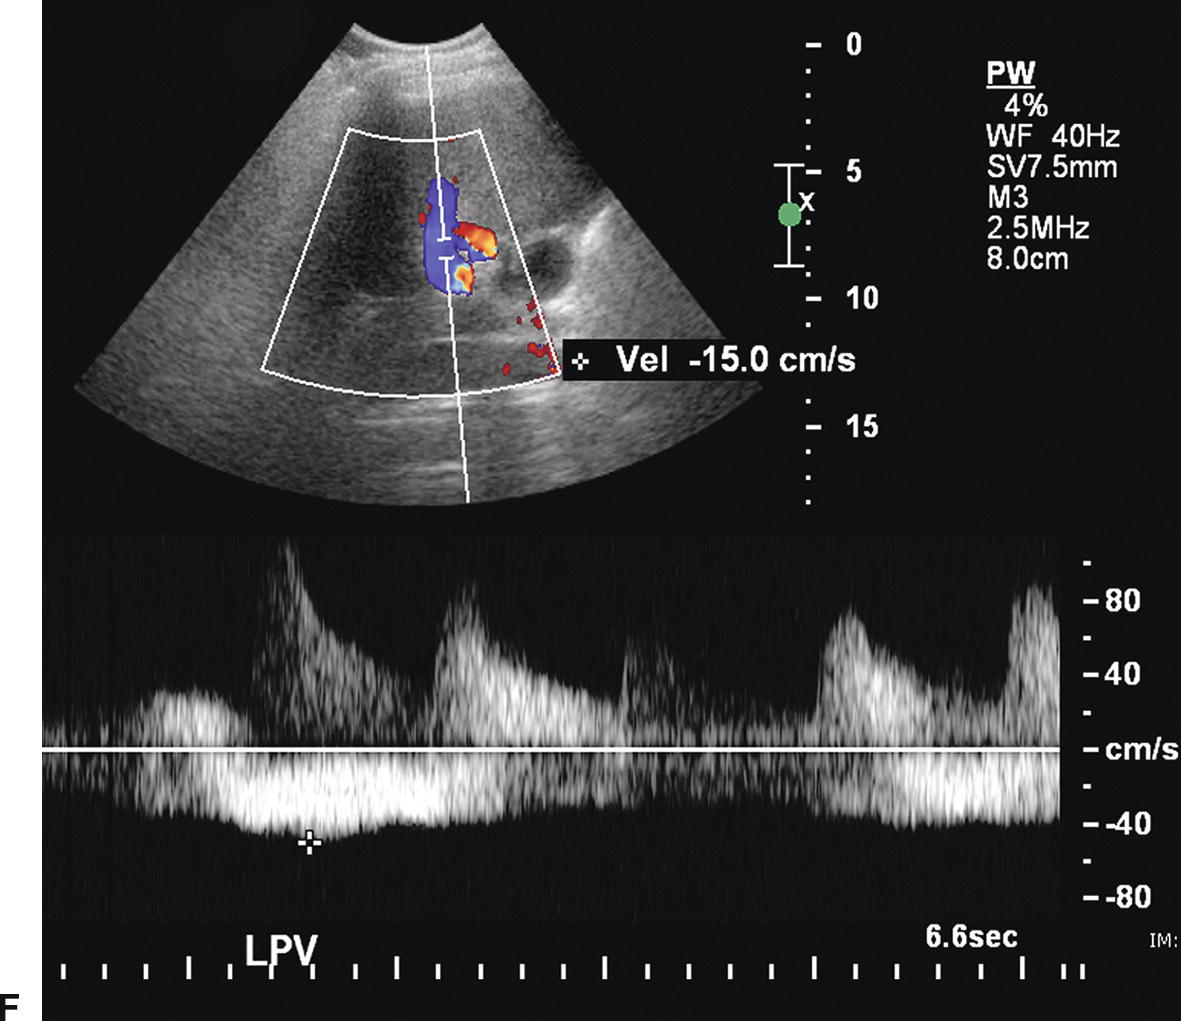
FIGURE 22.18. Normal TIPS: Duplex Doppler Appearance. A,Color Doppler interrogation demonstrates that color flow fills the lumen of the TIPS, extending all the way to the stent wall, which is extremely echogenic and striated in appearance. Spectral Doppler interrogation demonstrates normal peak velocity in the proximal (B), mid (C), and distal (D) segments of the TIPS. (Velocity in a normal TIPS should range between 100 and 200 cm/s depending upon diameter of the stent and portosystemic gradient. Velocity should not vary appreciably (>50 cm/s) along the length of the TIPS. E,Peak velocity in the main portal vein is 104 cm/s with flow heading toward the liver (red). Normal velocity in the main portal vein should be greater than 40 cm/s in a patient s/p TIPS placement. F,In a patient with a normally functioning TIPS, flow in the intrahepatic portal veins will be reversed and opposite in direction from the hepatic arteries. Flow in the intrahepatic portal veins should be directed toward the TIPS if the gradient across the TIPS is less than the gradient in the liver parenchyma. Note that flow in the hepatic artery is color coded red while flow in the left portal vein is color coded blue, indicating reversed flow. The spectral Doppler waveform demonstrates flow in the hepatic artery above the baseline and flow in the left portal vein below the baseline.
Reappearance of varices, refractory ascites, and pleural effusion are associated with TIPS occlusion or stenosis. Lack of detectable flow on color and pulsed Doppler interrogation, in combination with intraluminal echoes, is highly accurate in diagnosis of TIPS thrombosis or occlusion (Fig. 22.19), although occasionally it may be difficult to demonstrate flow within a TIPS if it is located too deep in the abdomen.45,46,60–65 Reported DUS diagnostic criteria for TIPS stenoses vary from institution to institution, likely in part related to differences in patient population and the type and diameter of TIPS shunt, as well as angiographic and DUS technique.40 Velocity less than 30 cm/s in the main PV, velocity less than 50 to 60 cm/s within the TIPS shunt, a focal increase in velocity of greater than 200 to 250 cm/s in the TIPS, and a focal increase or decrease in velocity of greater than 50 cm/s over time (from one study to the next) or spatially along the length of the TIPS are the velocity criteria most often used to diagnose TIPS stenoses (Figs. 22.20 and 22.21).45,46,61–65 In addition, a focal narrowing on color or power Doppler imaging with color aliasing or intraluminal thrombus may be noted (see Fig. 22.20A). A change in direction of flow from hepatofugal to hepatopetal in the left or right PVs (see Fig. 22.20D), or from hepatopetal to hepatofugal in the main PV, has been reported as a relatively late finding of TIPS malfunction and indicative that the gradient across the TIPS is higher than the portosystemic gradient in the liver parenchyma.40,63 No single Doppler criterion has been reported to have adequate sensitivity or positive predictive value for the diagnosis of TIPS stenosis; however, sensitivity increases when multiple criteria are used.65
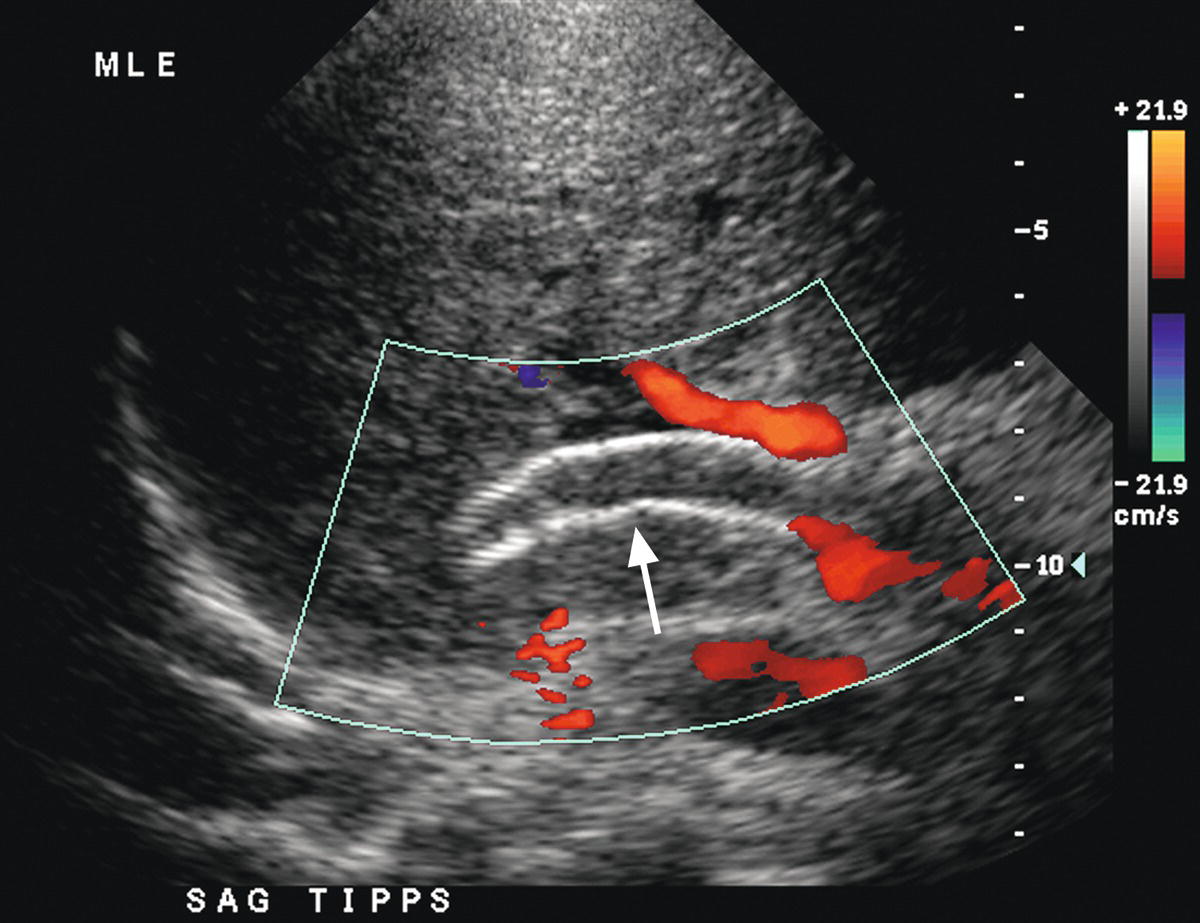
FIGURE 22.19. TIPS occlusion. Color Doppler image reveals no flow in the lumen of the TIPS (arrow). Note intraluminal echoes consistent with thrombus.
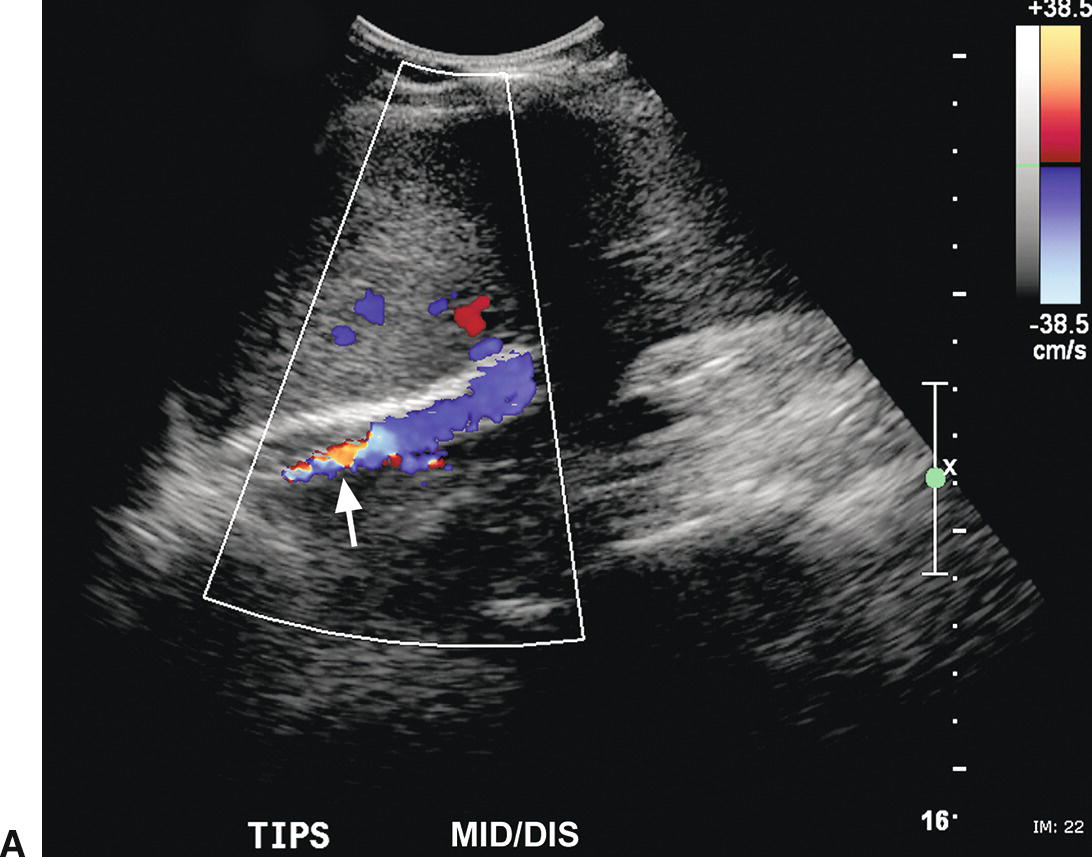
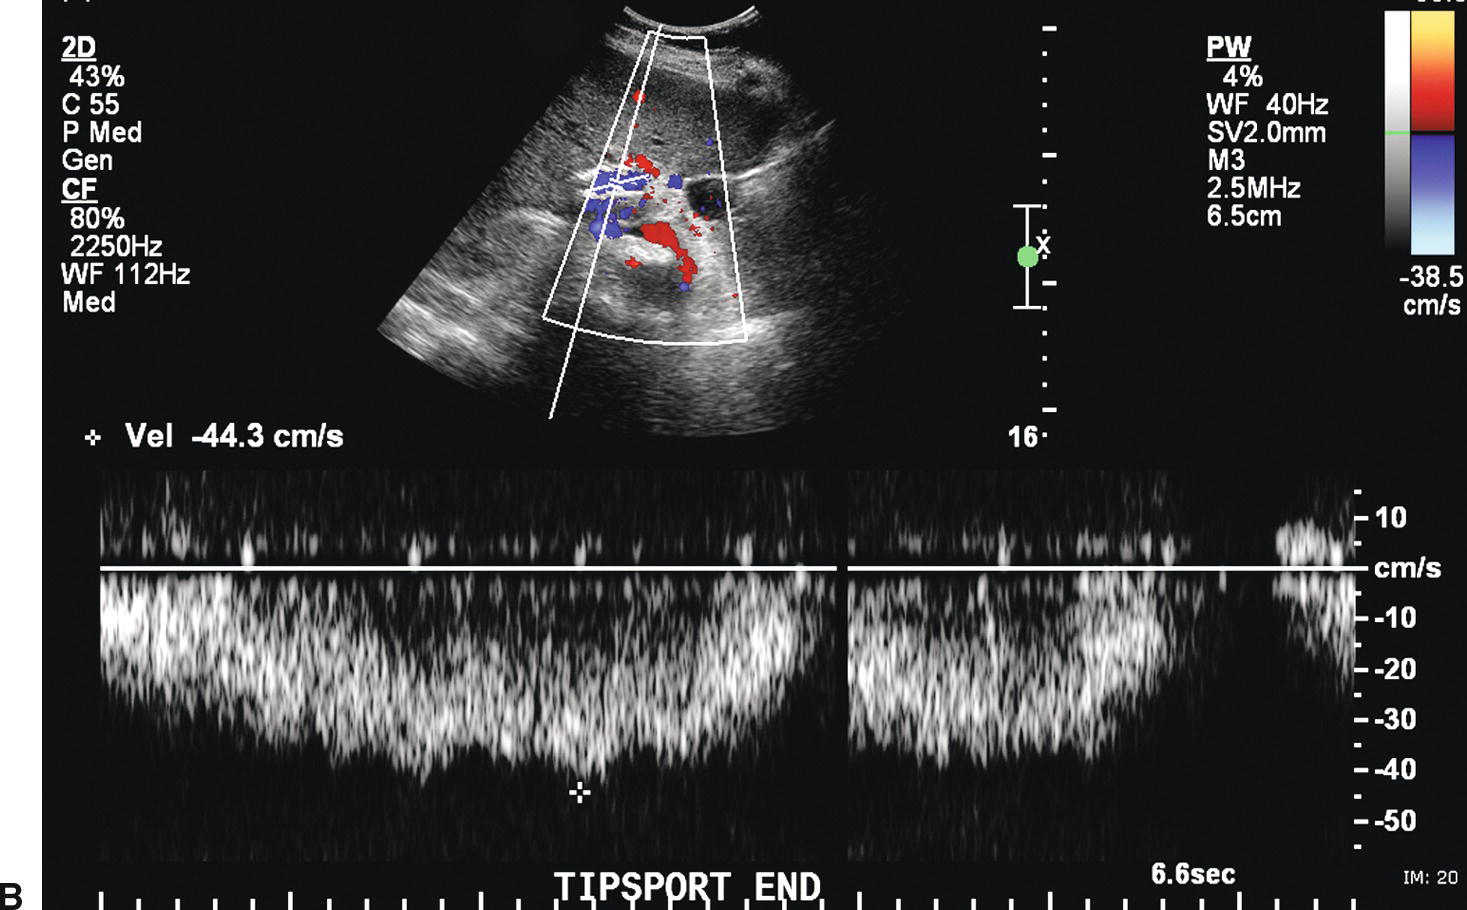
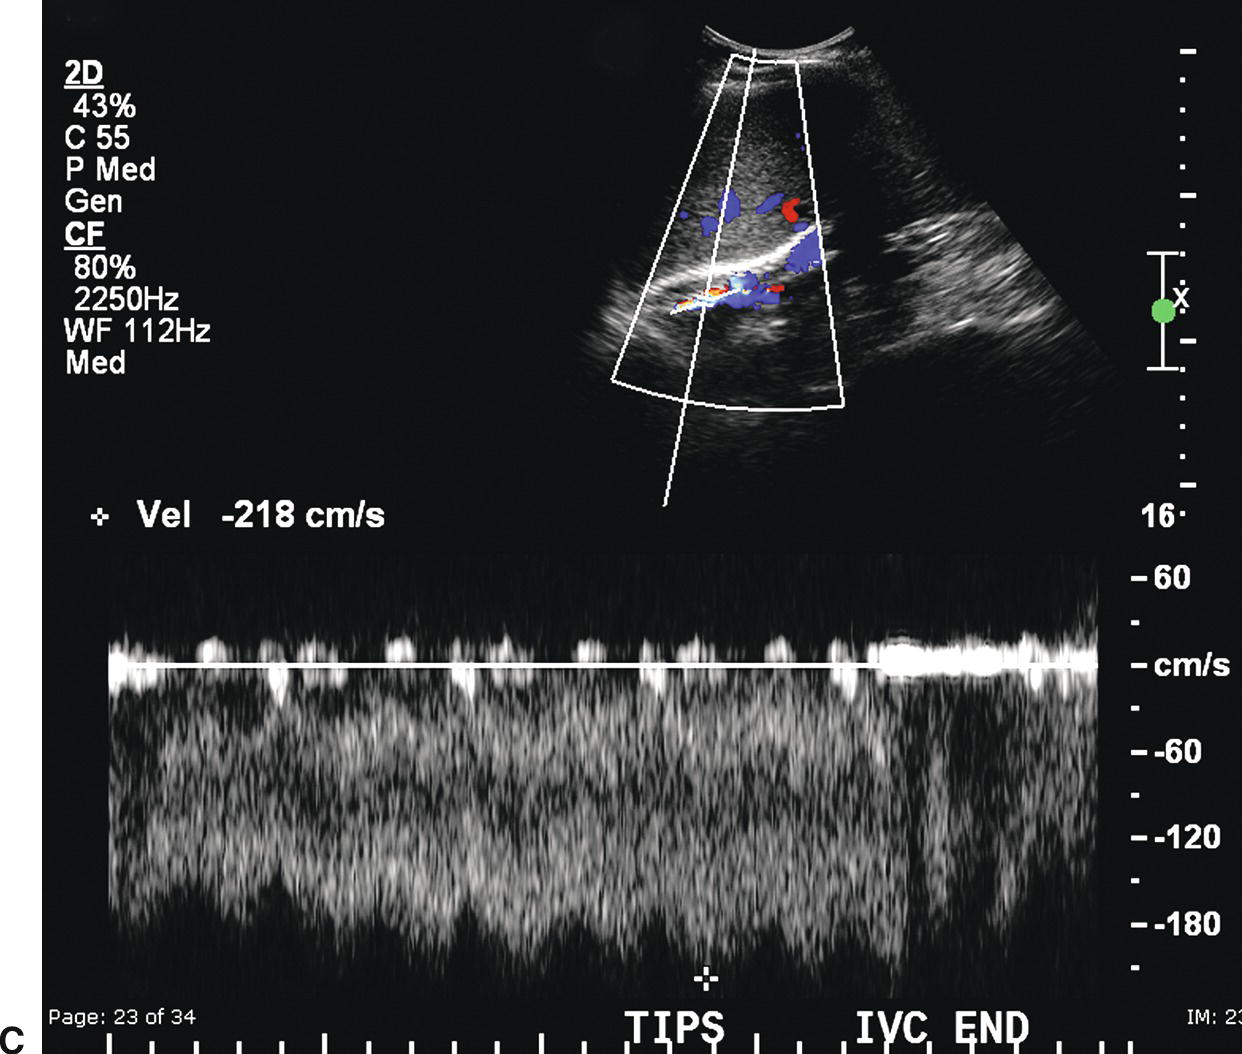
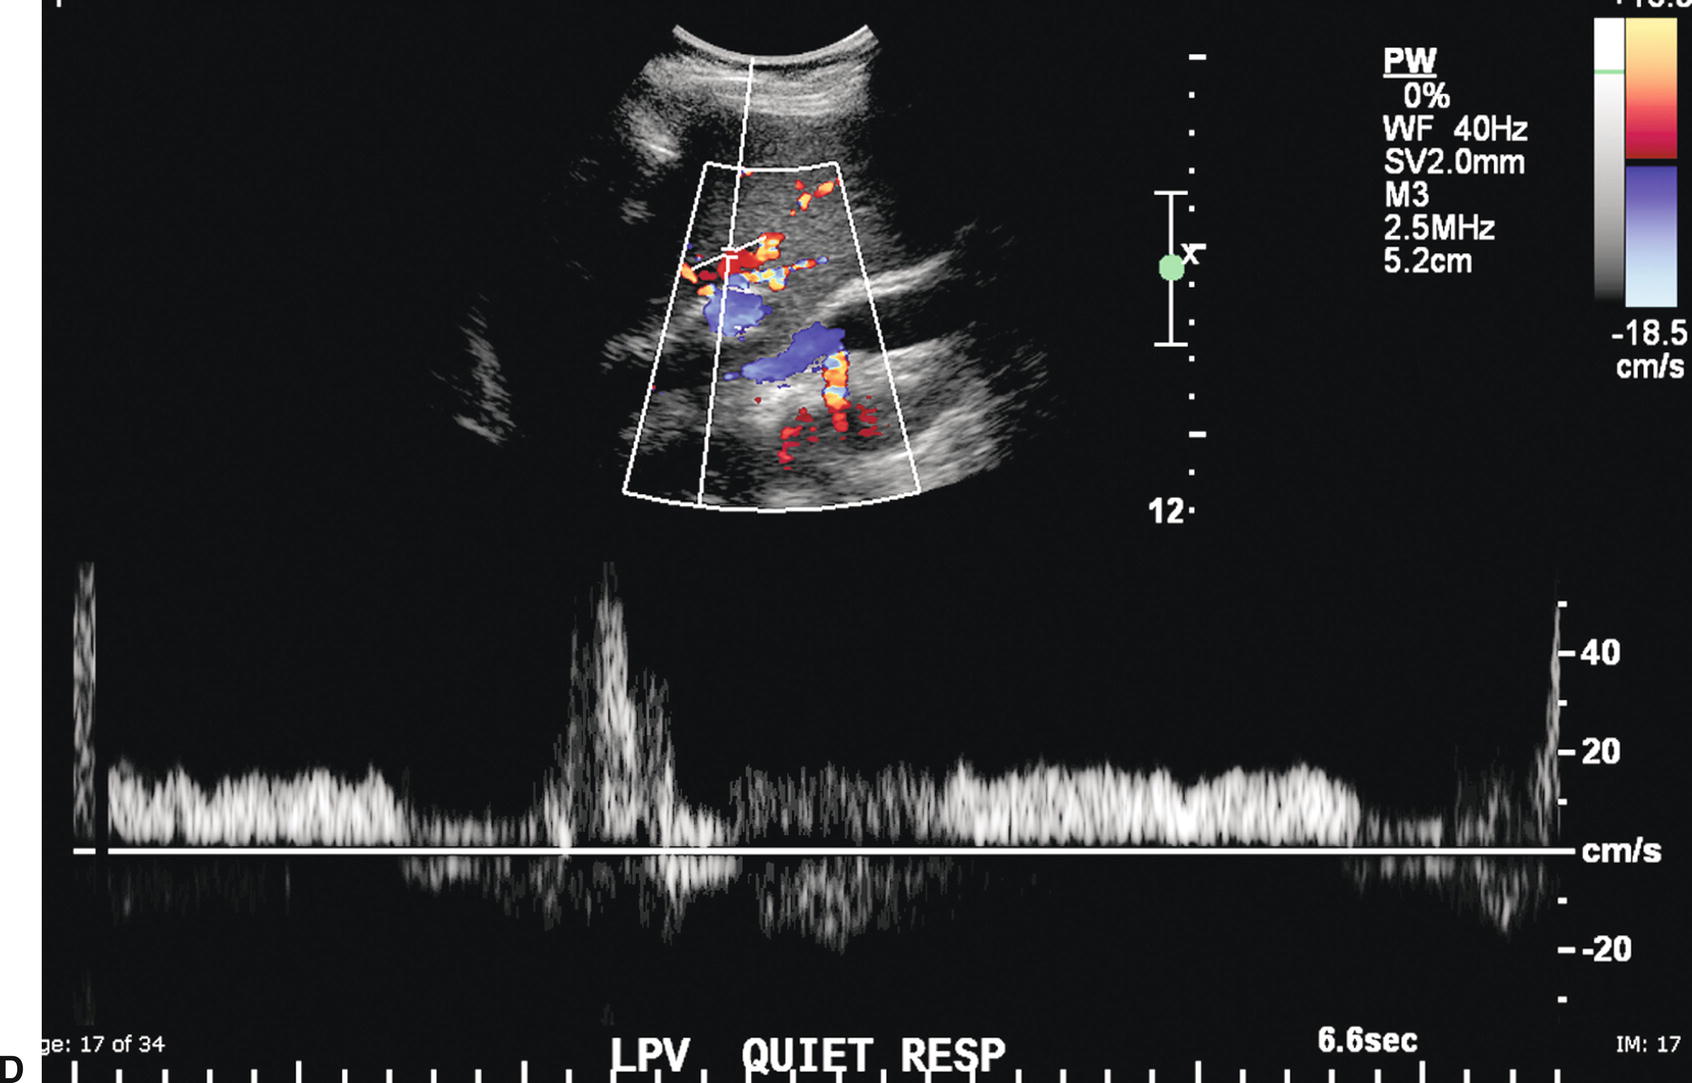
FIGURE 22.20. TIPS stenosis. A,Color Doppler image demonstrating color aliasing and narrowing of the lumen (arrow) at the hepatic (distal) end of the TIPS. B,Spectral waveform obtained in the proximal TIPS reveals markedly reduced flow with velocity of 44.3 cm/s. C,Peak velocity at the site of the stenosis is markedly elevated at 218 cm/s. D,Flow in the left portal vein is now hepatopetal, directed away from the TIPS and in the same direction as the hepatic artery.
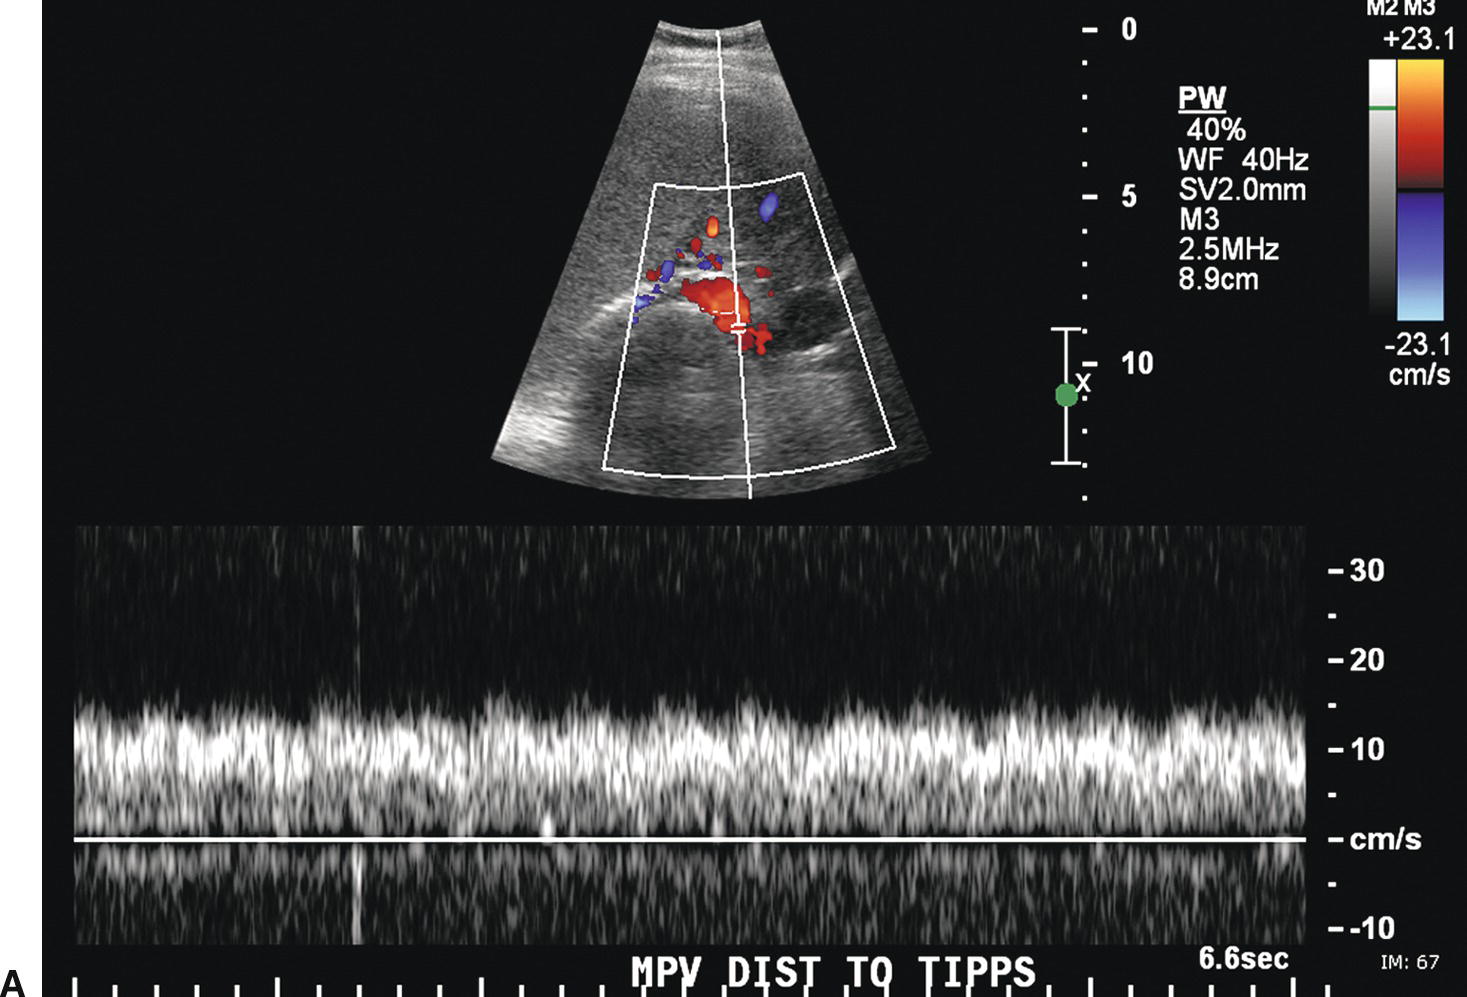
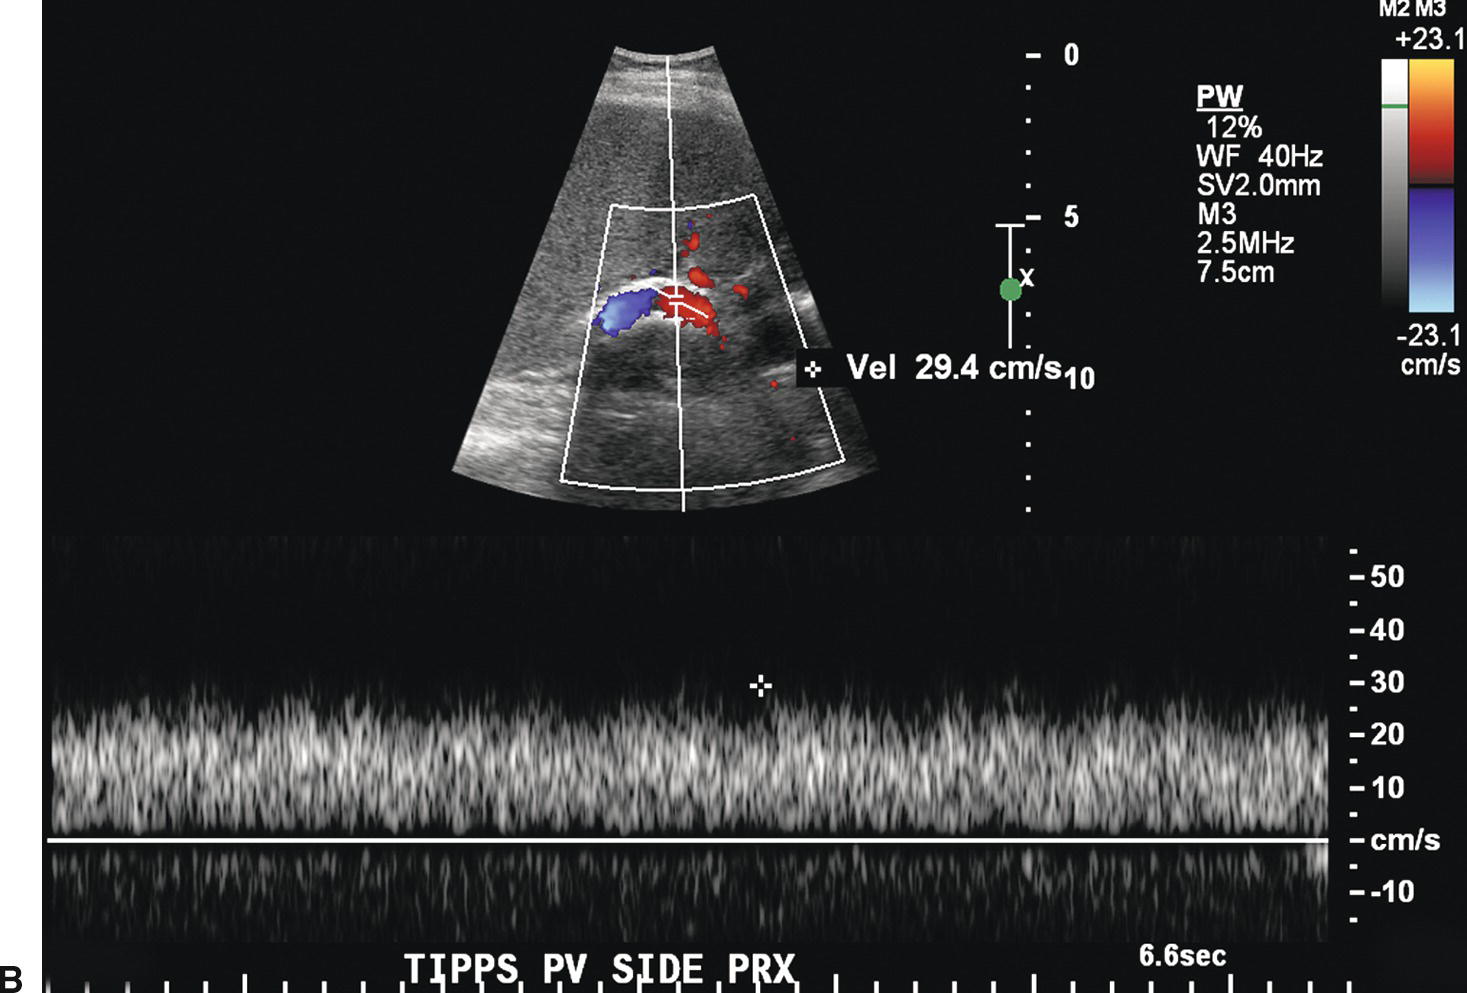
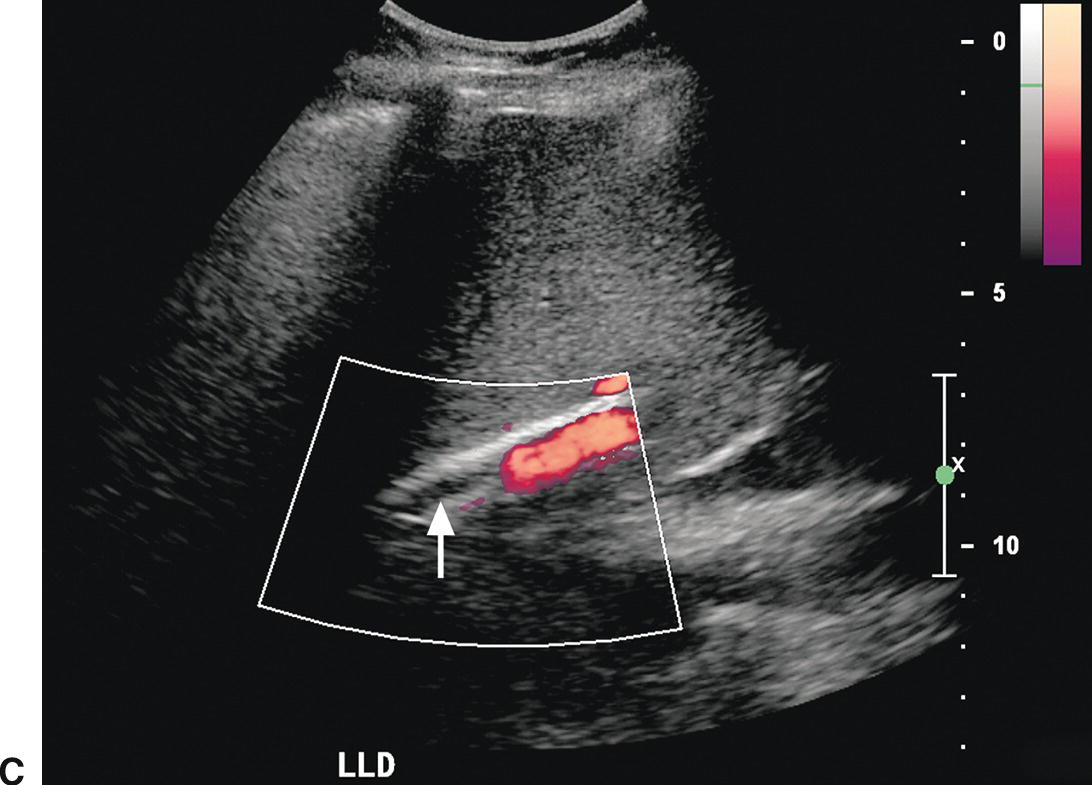
FIGURE 22.21. TIPS occlusion. A,Spectral waveform from the main portal vein proximal to the TIPS reveals decreased flow (<18 cm/s), suspicious for TIPS malfunction. B,Flow in the proximal TIPS is markedly reduced at 29 cm/s. C,Power Doppler image reveals no evidence of flow (arrow) in the distal TIPS, consistent with occlusion.
False-positive diagnoses of TIPS stenosis and thrombosis have been reported. Since a TIPS is curvilinear in configuration, multiple imaging planes and angles are required for evaluation. If the TIPS is imaged out of a midline longitudinal plane, partial voluming of the back wall may suggest a TIPS stenosis.60 Occasionally, the depth is too great to document flow on color Doppler imaging. In addition, flow may not be apparent on color Doppler imaging if part of the TIPS is imaged in a plane perpendicular to the ultrasound beam.60 If the color scale is set too high, incomplete color saturation will occur, mimicking the appearance of intraluminal thrombus. On some machines, paradoxically, if the scale and PRF are set too low, high-velocity normal flow may not be detected.40
Despite these pitfalls and variations in diagnostic criteria, ultrasound remains the most readily available, inexpensive, and noninvasive surveillance modality for TIPS stenoses. However, specific Doppler criteria for TIPS stenoses must be tailored to each individual patient. Both the sonographer and physician must recognize that sensitivity and specificity are inversely related in this setting. Thus, clinical correlation and patient history are critically important to determine when to intervene, and increases in sensitivity of Doppler criteria must be balanced by the tolerance of both patient and clinician for referral to either short interval ultrasound follow-up or angiography. Recently, several studies have reported that the use of intravenous ultrasound contrast agents increases the sensitivity of the Doppler examination for the diagnosis of TIPS dysfunction.66,67
PORTAL VEIN THROMBOSIS
Patients with acute portal vein thrombosis (PVT) may be completely asymptomatic or present with abdominal pain and abnormal liver function tests. Patients with chronic PVT most often present with signs and symptoms of PHT (varices, esophageal hemorrhage, splenomegaly), jaundice, or abnormal liver function tests. However, patients with presinusoidal PHT from causes such as PVT rarely develop significant ascites unless there is associated sinusoidal PHT (cirrhosis), in contrast to patients with postsinusoidal PHT, for example, from BCS, who often develop massive ascites.6 PVT is one of the common causes of acute deterioration of liver function tests in cirrhotic patients. In children, the most common cause of PVT is omphalitis. In adults, 25% of patients with PVT have cirrhosis.6 Other causes include hypercoagulable states (deficiencies of antithrombin, protein C or protein S, antiphospholipid antibody syndrome, and polycythemia vera), neoplasia (especially hepatocellular and pancreatic carcinoma), oral contraceptive use, pancreatitis, inflammatory bowel disease (including appendicitis and diverticulitis), sepsis, collagen vascular diseases, myeloproliferative syndromes, postoperative states, and trauma. However, in many cases, the cause is unknown or idiopathic.6,15
Ultrasound findings in patients with acute PVT include distension of the PV and absence of flow on color, power, and spectral Doppler imaging (Fig. 22.22).68,69 In patients with nonocclusive thrombus, color Doppler imaging will outline the echogenic thrombus within the PV.68 Acute thrombus may be completely anechoic and, therefore, only detected with color Doppler imaging. Subacute or chronic thrombus will demonstrate internal echoes. Typically, chronic thrombus is more echogenic than is subacute thrombus. PVT may extend into the splenic, superior mesenteric, or intrahepatic portal veins (Figs. 22.22 and 22.23). The intrahepatic PVs may also thrombose and dilate, mimicking the appearance of a tumor. The presence of arterial flow signals within the thrombus can be used to distinguish malignant tumor thrombus from bland, avascular thrombus (Fig. 22.24). If arterialization of thrombus is observed, the hepatic parenchyma should be carefully evaluated for focal lesions consistent with HCC or metastatic disease. In long-standing PVT, the thrombus will become more echogenic, and the PV will decrease in caliber due to fibrosis. In some patients, the PV will not be visualized.18 Cavernous transformation of the PV, the development of periportal and perigallbladder portosytemic collaterals within the hepatoduodenal ligament and lesser omentum, may occur as early as 6 to 20 days after the development of PVT. On color Doppler, a tangle or cluster of irregular vessels will be noted in the porta hepatis or gallbladder wall (Fig. 22.25).70,71 Intrahepatic collaterals or recanalization of the PV may also be noted.70
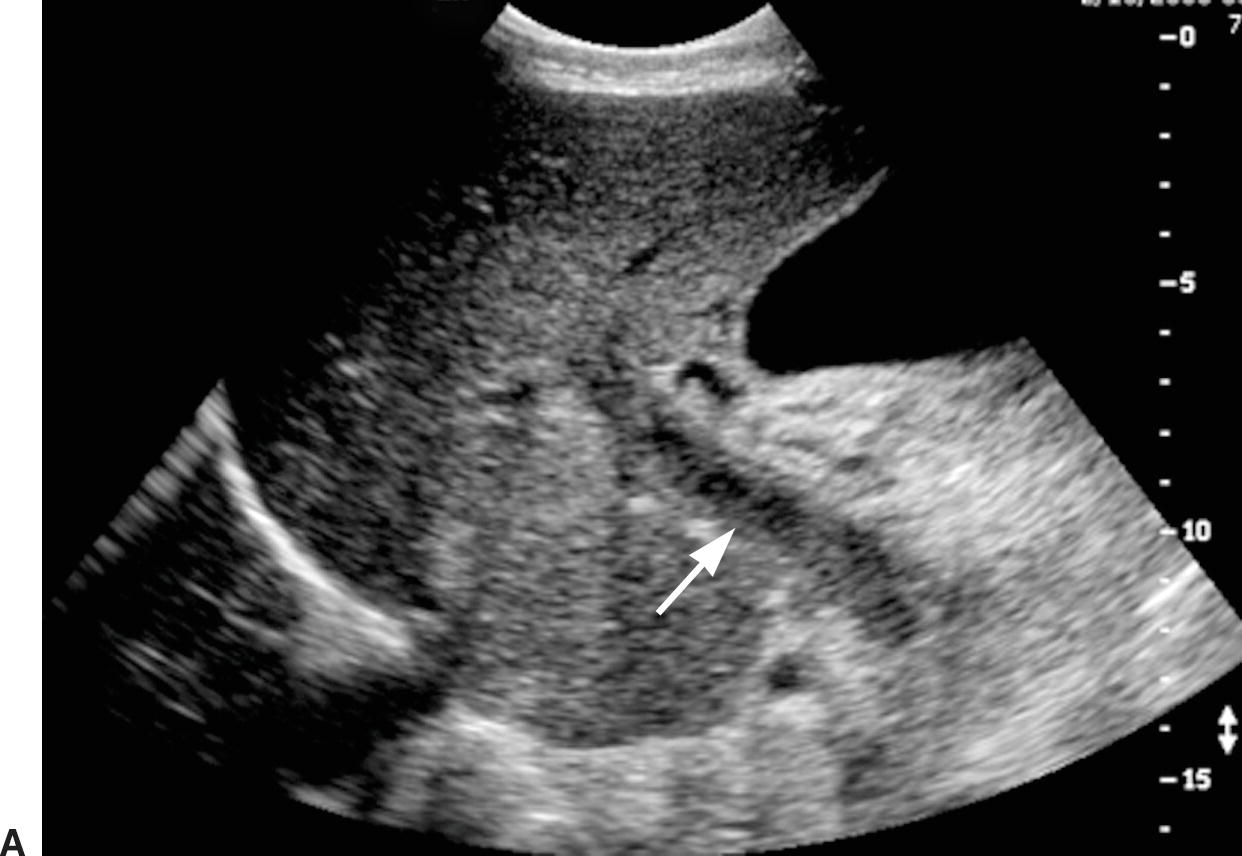
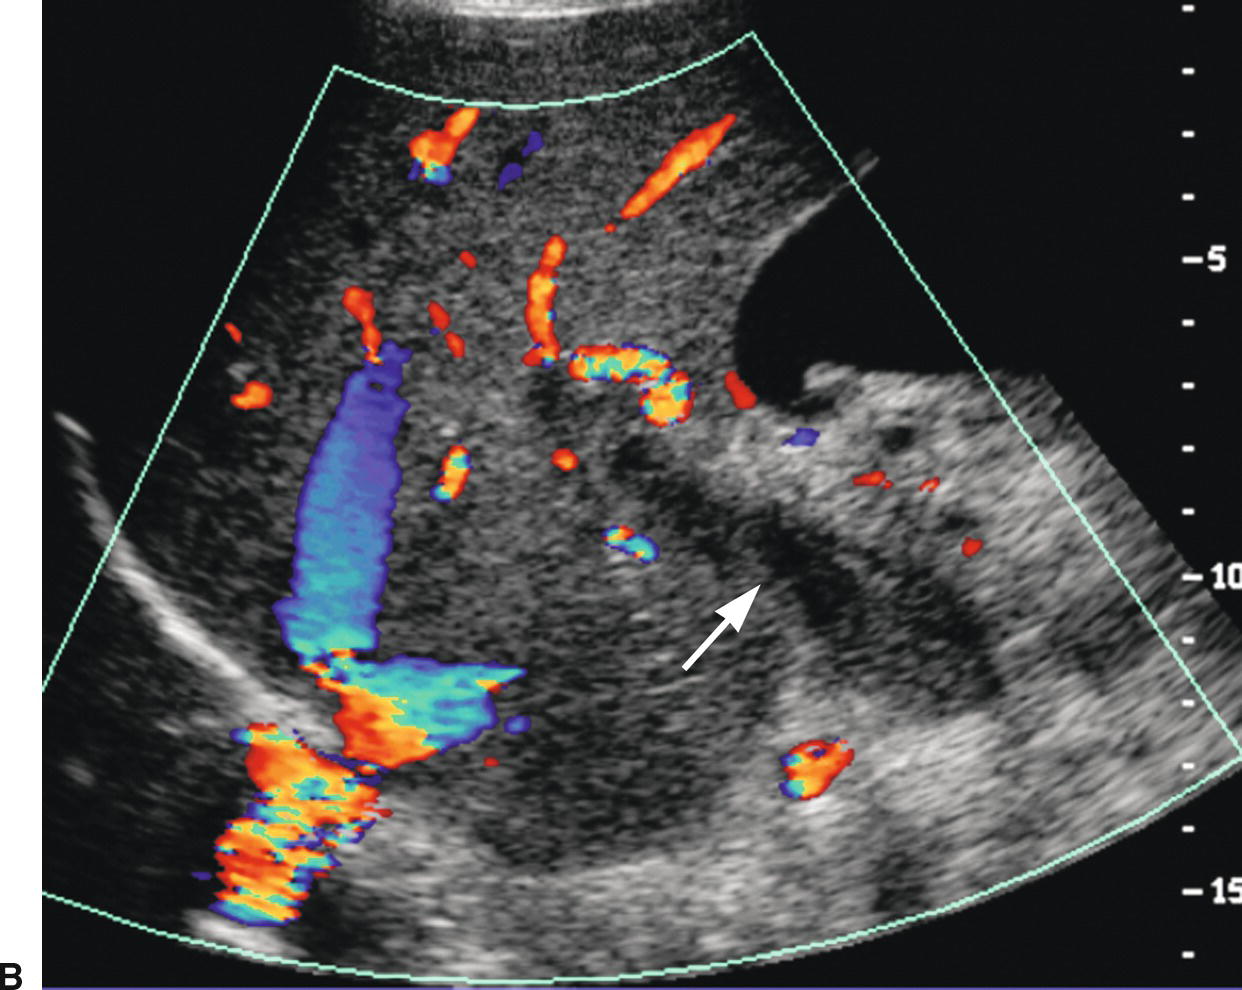
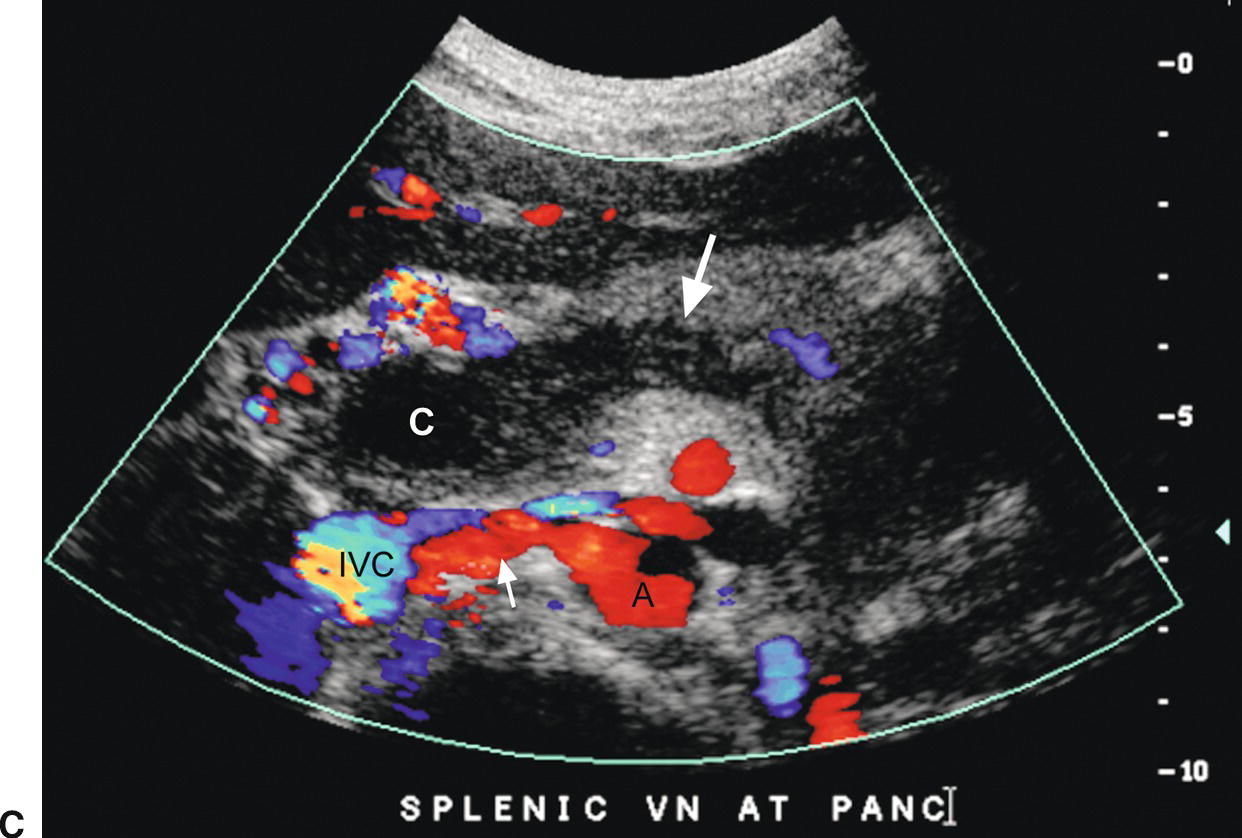
FIGURE 22.22. Portal vein thrombosis. Gray-scale (A) and color-flow (B) images of the main portal vein (arrow) reveals intraluminal echoes and no evidence of flow, consistent with thrombus. C, The thrombus extends into the portal confluence (C) and SV (long arrow). A, aorta. IVC, inferior vena cava. Short arrow, right renal artery.
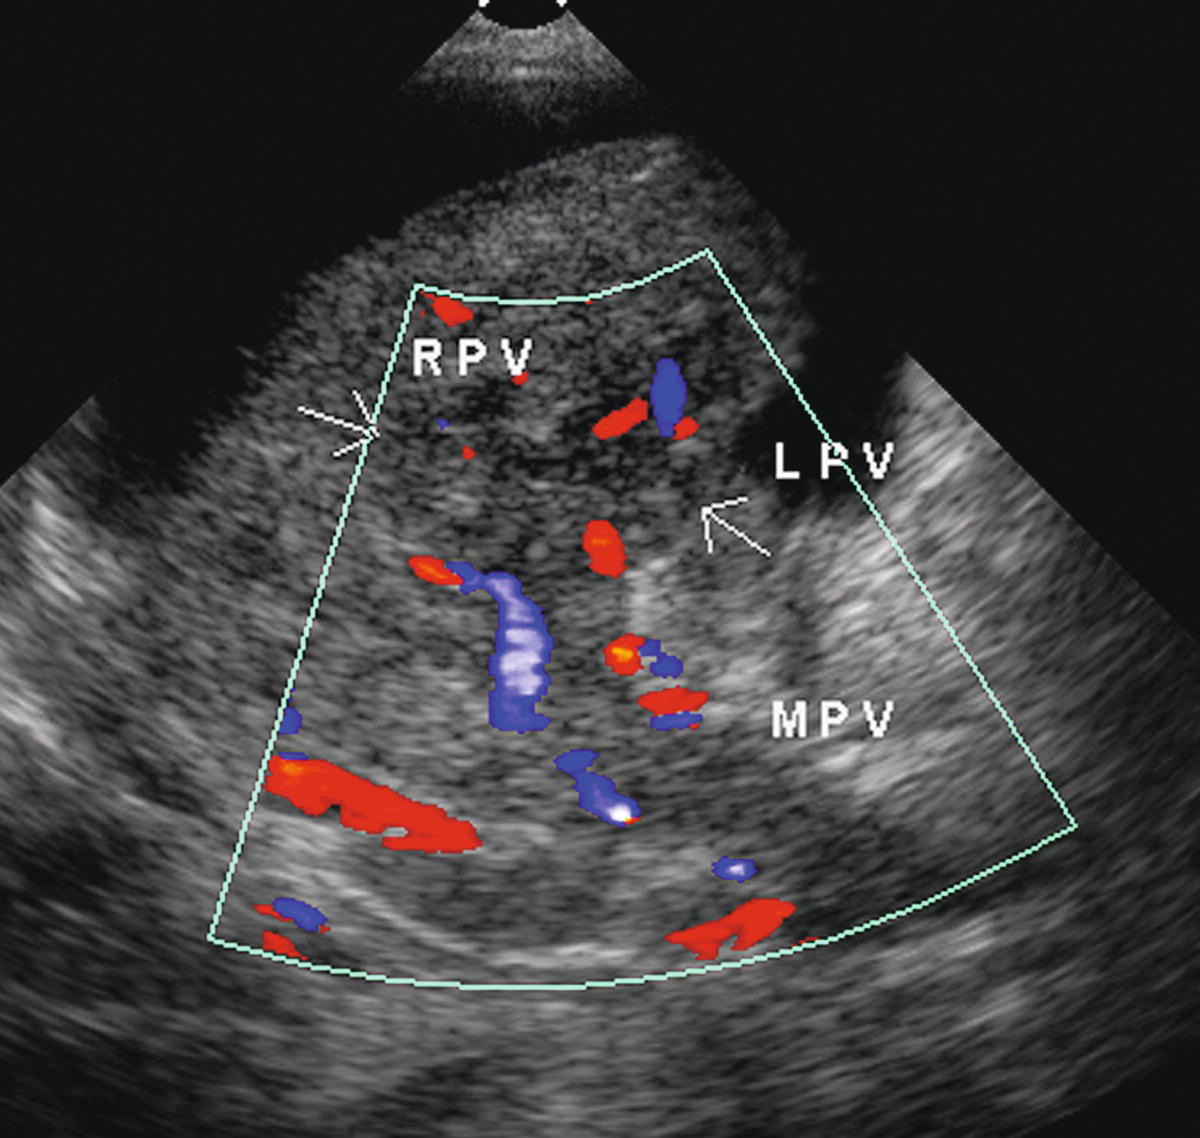
FIGURE 22.23. Intrahepatic portal vein thrombosis. Note absence of color flow and presence of intraluminal echoes consistent with thrombus in the main portal vein (MPV), right portal vein (RPV), and left portal vein (LPV). When the intrahepatic portal veins are distended with tumor, as in this patient, the ultrasound appearance can mimic the presence of a focal liver mass.
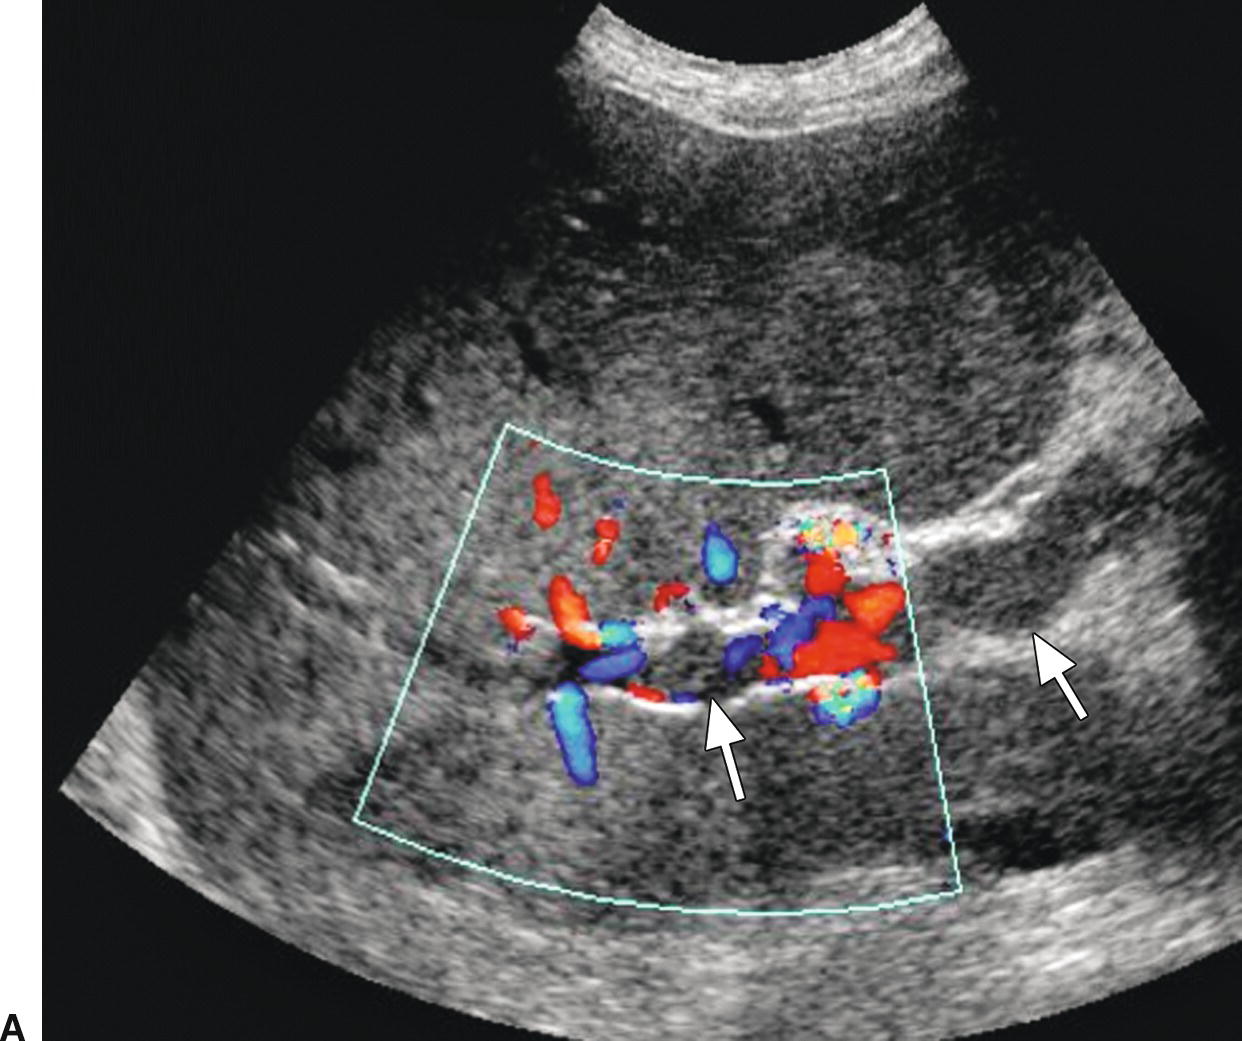
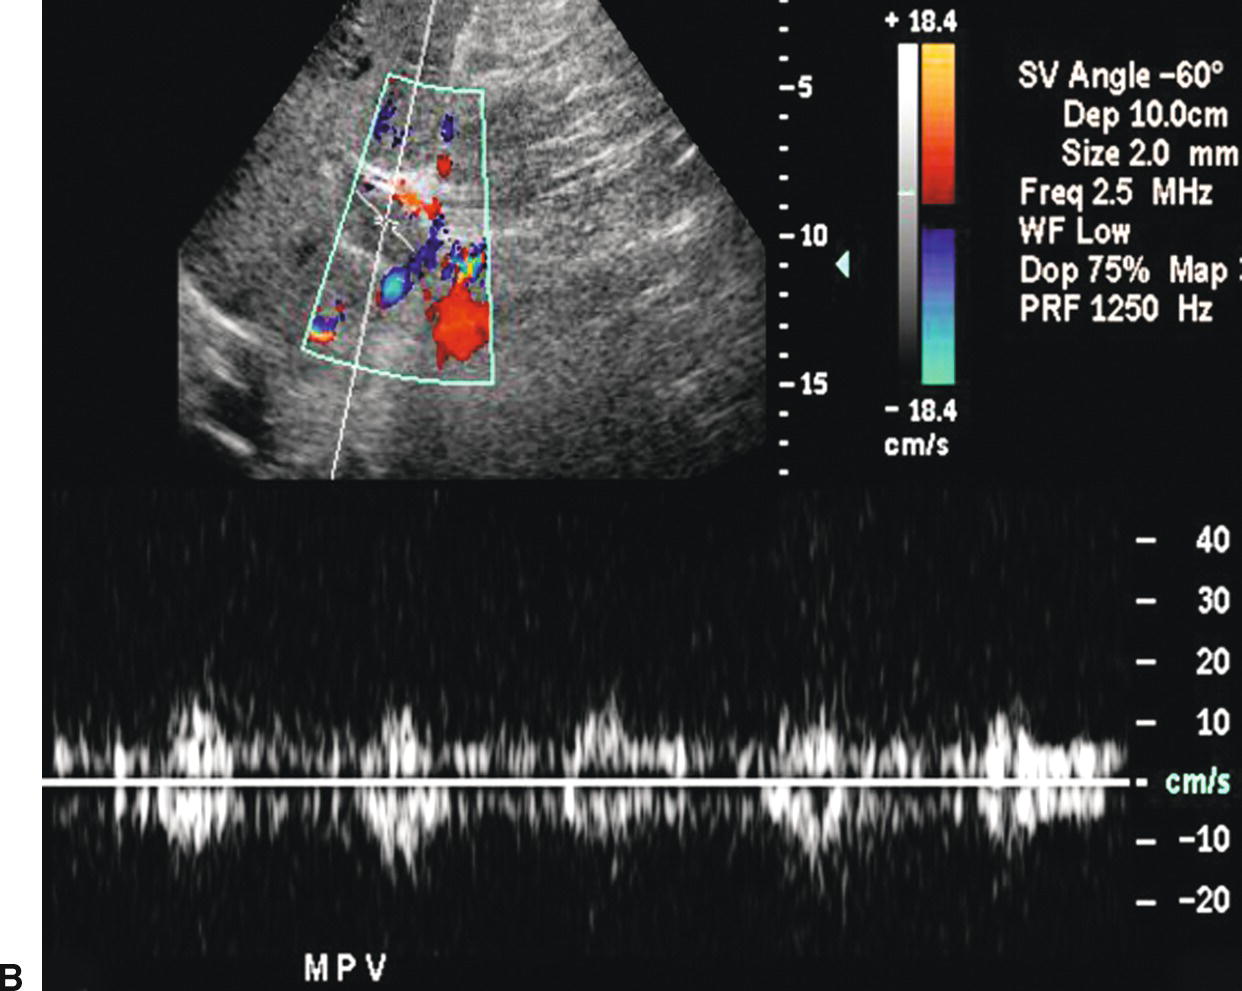
FIGURE 22.24. Malignant portal vein thrombosis. A,Color Doppler image demonstrates nonocclusive thrombus (arrows) in the main portal vein. Some peripheral color flow is seen. B,Spectral Doppler waveform reveals arterial signal within the thrombus. Arterial flow would not be expected in bland thrombus and indicates invasion of the portal vein by tumor.
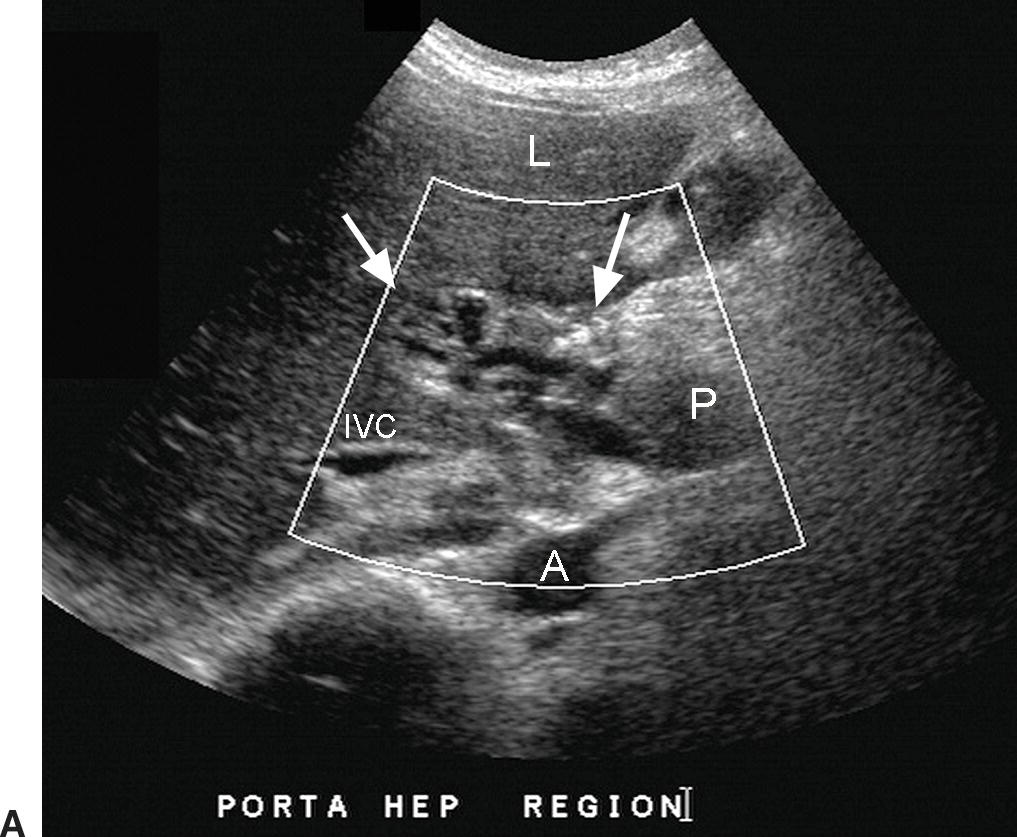
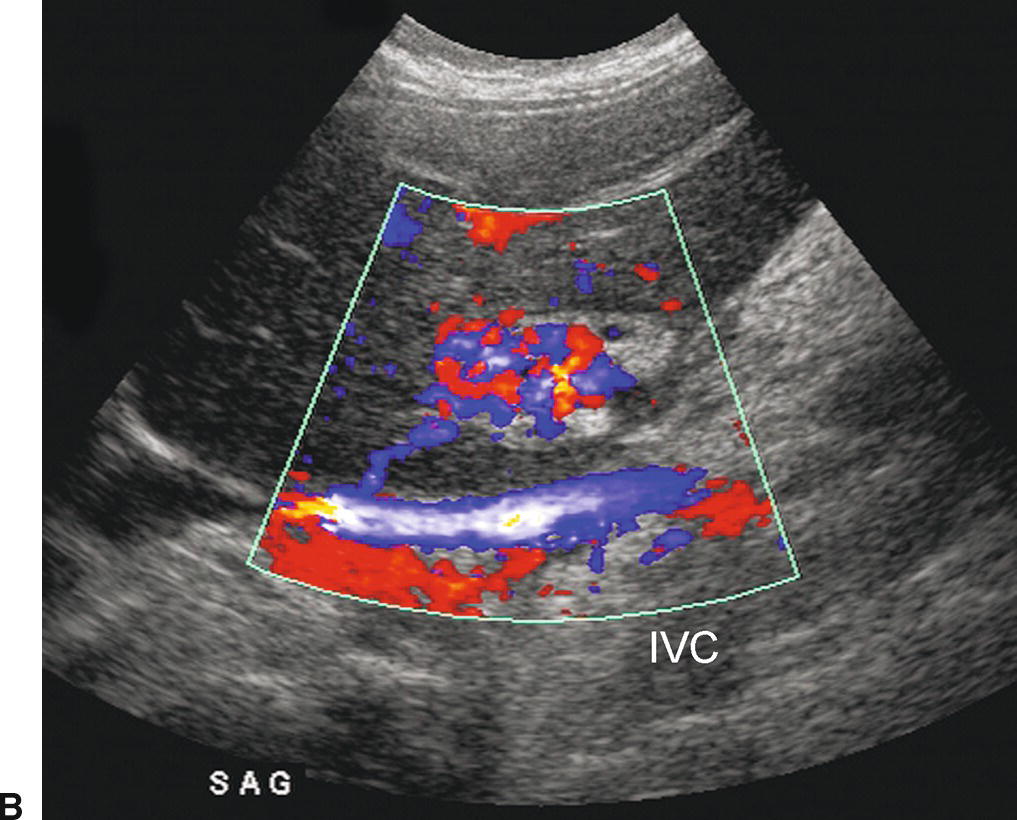
FIGURE 22.25. Cavernous Transformation of the Portal Vein. A,Gray-scale image demonstrating numerous tangled, serpiginous anechoic tubular structures in the porta hepatis (arrows). A, aorta. IVC, inferior vena cava. L, liver. P, pancreas. B,Color Doppler image reveals that these structures are vessels. The main portal vein could not be identified. Cavernous transformation can occur as early 1 week following PVT. As these small vessels do not adequately decompress the portosystemic gradient in the liver, esophageal and other varices are frequently associated.
Color Doppler has been reported to have a sensitivity of 89%, a specificity of 92%, an accuracy of 92%, and a negative predicative value of 98% for the diagnosis of PVT.69 In patients with clinical concern for PVT, a DUS examination with demonstration of portal venous flow on color or spectral Doppler is adequate to exclude PVT, and no further workup is necessary,69 although rarely color “bleeding” will overwrite and obscure nonocclusive PVT. However, false-positive diagnoses of PVT are more common, as it may be difficult on Doppler ultrasound to differentiate PVT from slow flow. To improve accuracy, machine settings should be adjusted to maximize sensitivity for slow flow. A small color box, low wall filter, and the highest gain and lowest scale possible without image degradation due to motion artifact and color aliasing, respectively, should be used in order to maximize sensitivity to slow flow (Fig. 22.26). The incident color Doppler angle should be kept at less than 90 degrees. A color Doppler finding of no flow suggesting occlusive thrombus should be confirmed with power and spectral Doppler imaging, since these Doppler modes are more sensitive than color Doppler for the detection of low-velocity flow. If no flow is seen on color Doppler interrogation and the PV is distended with echogenic thrombus, or if color Doppler outlines nonocclusive thrombus, confirmatory studies are not necessary; however, CT or MR imaging may be helpful for documentation of the extent of thrombus or to evaluate for underlying malignancy. In addition, referral for further evaluation with CT or MR should be considered if it is not possible to differentiate nondetectable slow flow from thrombus on DUS examination.
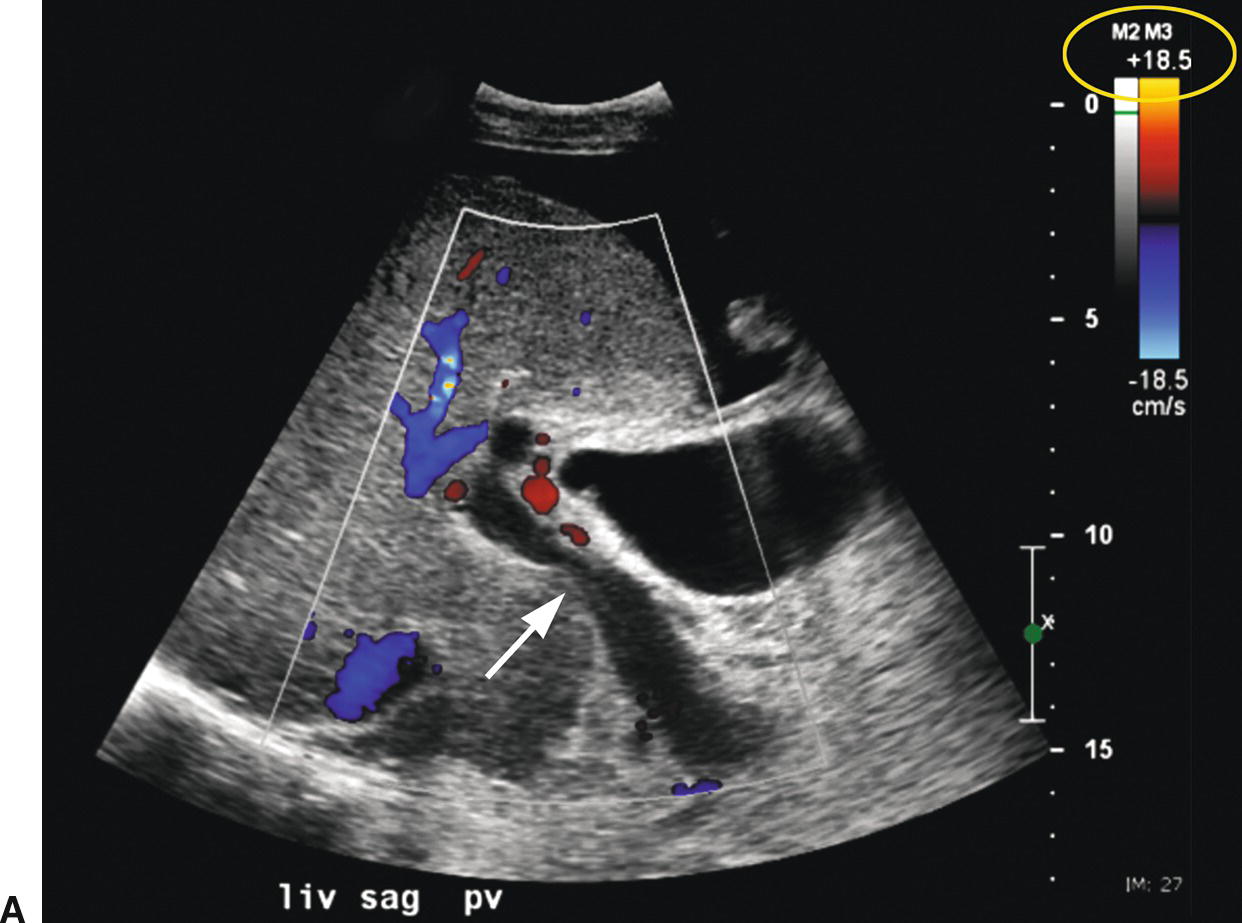
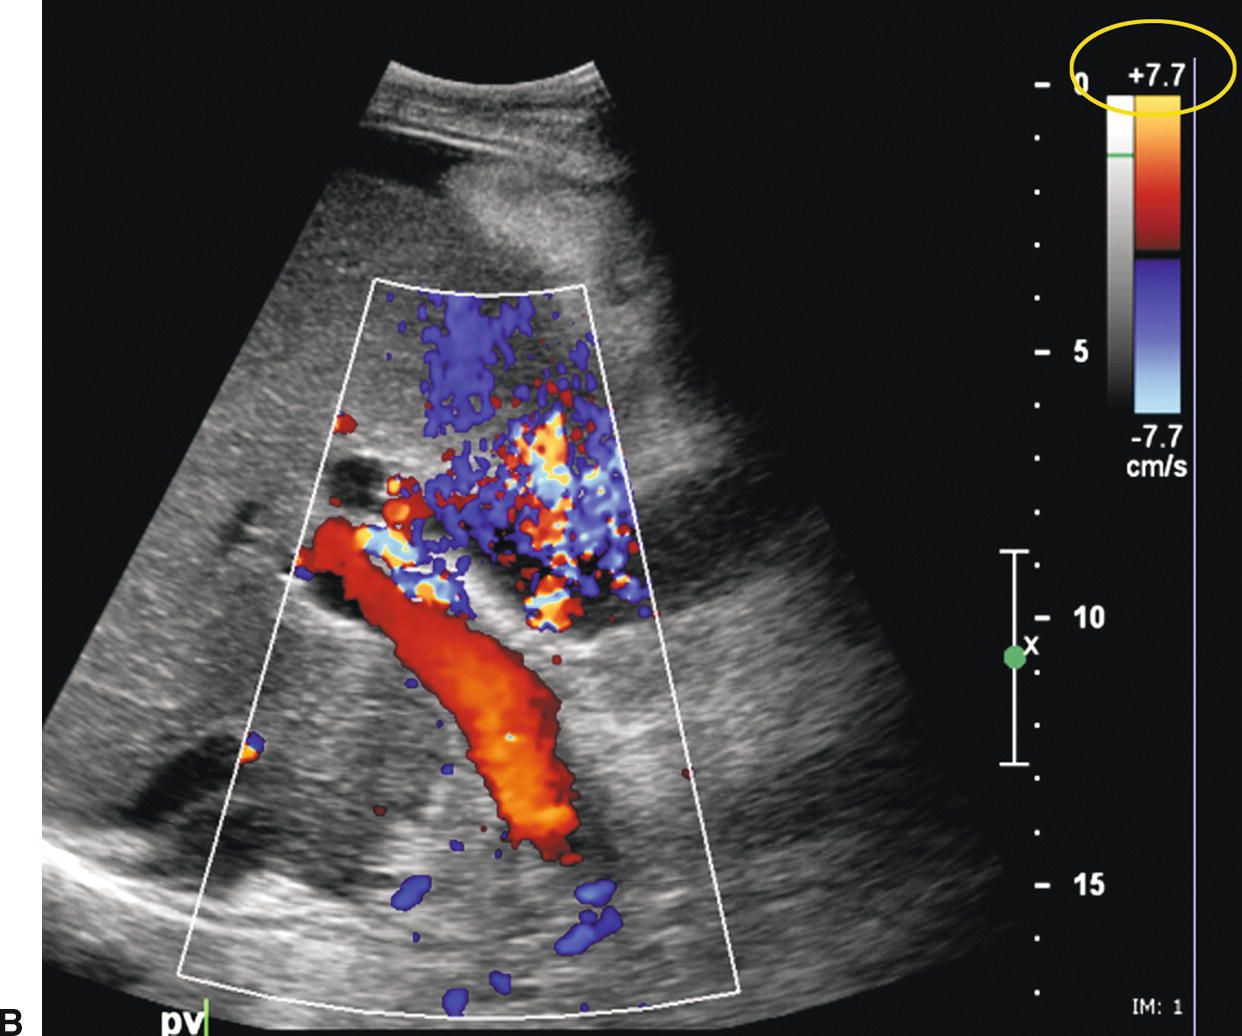
FIGURE 22.26. False-positive diagnosis of PVT. A,Initial color Doppler image reveals no flow in the main portal vein (arrow), suggestive of PVT. No intraluminal echoes are seen. However, acute PVT may appear anechoic on ultrasound. Note the color scale (yellow circle). B,When the color scale (yellow circle) is lowered from 18.5 to 7.7 in, flow fills the lumen of the portal vein.
BUDD-CHIARI SYNDROME
BCS can be caused by venous outflow obstruction at the level of the hepatic venules, large HVs, or IVC. BCS is classified as primary when the venous outflow obstruction is due to an intrinsic venous problem (thrombus, stenosis, or webs) and secondary if it is related to extrinsic compression.72 If untreated, BCS will result in increased hepatic sinusoidal pressure and PHT. Venous stasis and hypoxia in the hepatic parenchyma result in centrilobular necrosis, fibrosis, nodular regenerative hyperplasia, and eventually cirrhosis.73 The presenting symptoms are variable depending upon the exact site of occlusion. Patients may present with a fulminant, acute, subacute, or chronic course.73 The subacute form is most common, and these patients present with ascites, abdominal pain, hepatomegaly, jaundice, abnormal liver function tests, and hypertrophy of the caudate lobe. Lower extremity swelling is common if the IVC is thrombosed. The most common predisposing risk factors are myeloproliferative disorders (especially polycythemia vera), hypercoagulable states, and malignancy (especially hepatocellular, adrenal, and renal cell carcinomas). Other risk factors include oral contraceptives, pregnancy, malnutrition, collagen vascular diseases (especially Behcet’s disease), paroxysmal nocturnal hemoglobinuria, IVC webs, and infections. Webs and stenoses within the IVC are a much more common cause of BCS in Southeast Asia in comparison to the United States.74 No identifiable cause is found in 10% to 20% of patients.73,75,76
Ultrasound is considered as the primary diagnostic imaging modality for patients with suspected BCS. Findings include hepatomegaly with hypertrophy of the caudate lobe, ascites, and findings of PHT (Fig. 22.27). Although BCS is much less common than PVT, as many as 25% of patients with BCS may have associated PVT.11,75 Doppler interrogation will reveal absence of flow with echogenic intraluminal thrombus in or nonvisualization of the HVs or IVC (Figs. 22.28 and 22.29) If thrombus is acute, the HVs may be distended. Veins may also dilate proximal to a stenosis. A dampened monophasic Doppler waveform in the peripheral HVs suggests more central obstruction (see Fig. 22.29), although a dampened hepatic venous waveform pattern may be observed in patients following deep inspiration or secondary to extrinsic compression of the IVC.19 Intrahepatic collaterals, especially subcapsular in location (Fig. 22.30), have been described as relatively specific findings in BCS but may also be seen in patients with PHT or cirrhosis.74,77,78 DUS has been estimated to have a sensitivity and specificity of at least 85% for the diagnosis of BCS.79 Inability to visualize the HVs has been reported to be suggestive of BCS,74,77 but this is a nonspecific finding also seen in cirrhosis and extensive fatty infiltration of the liver. Narrowing of the IVC or HVs may be noted in association with high-velocity flow and color aliasing at the site of stenosis (Fig. 22.31).74 Association of HV or IVC thrombus with an adrenal, renal, or liver mass should raise concern for tumor thrombus. The presence of arterial flow within the thrombus will confirm this diagnosis.11
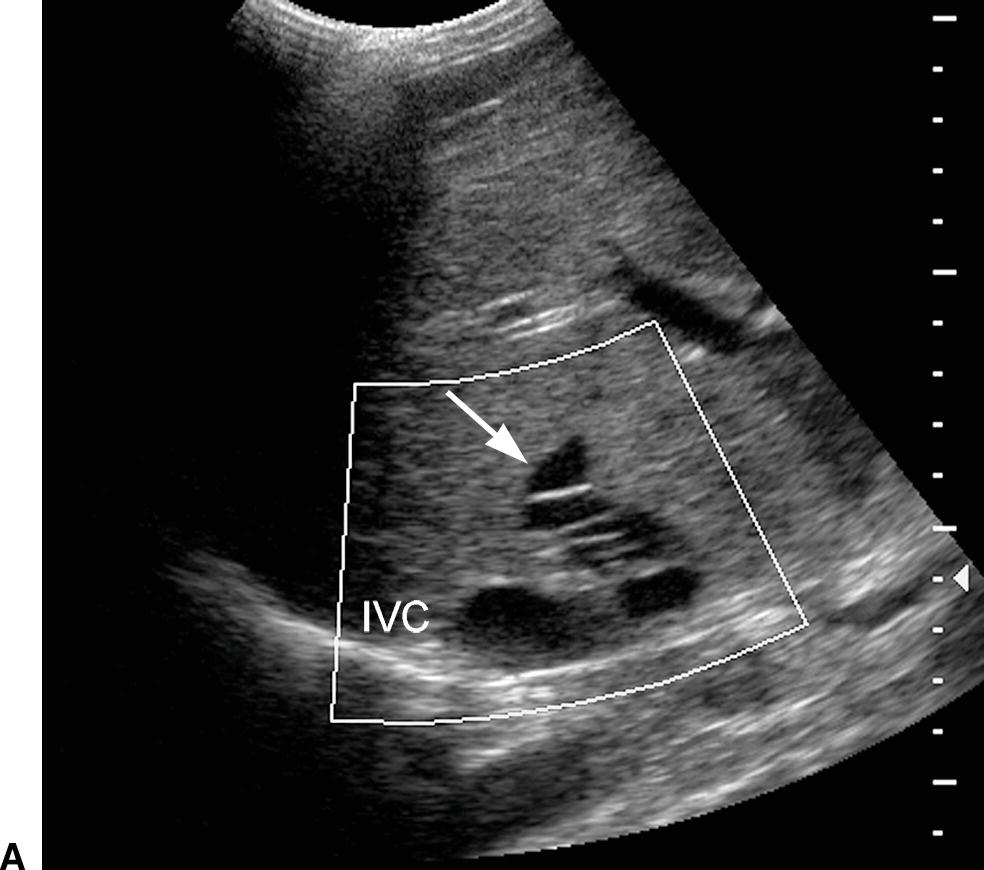
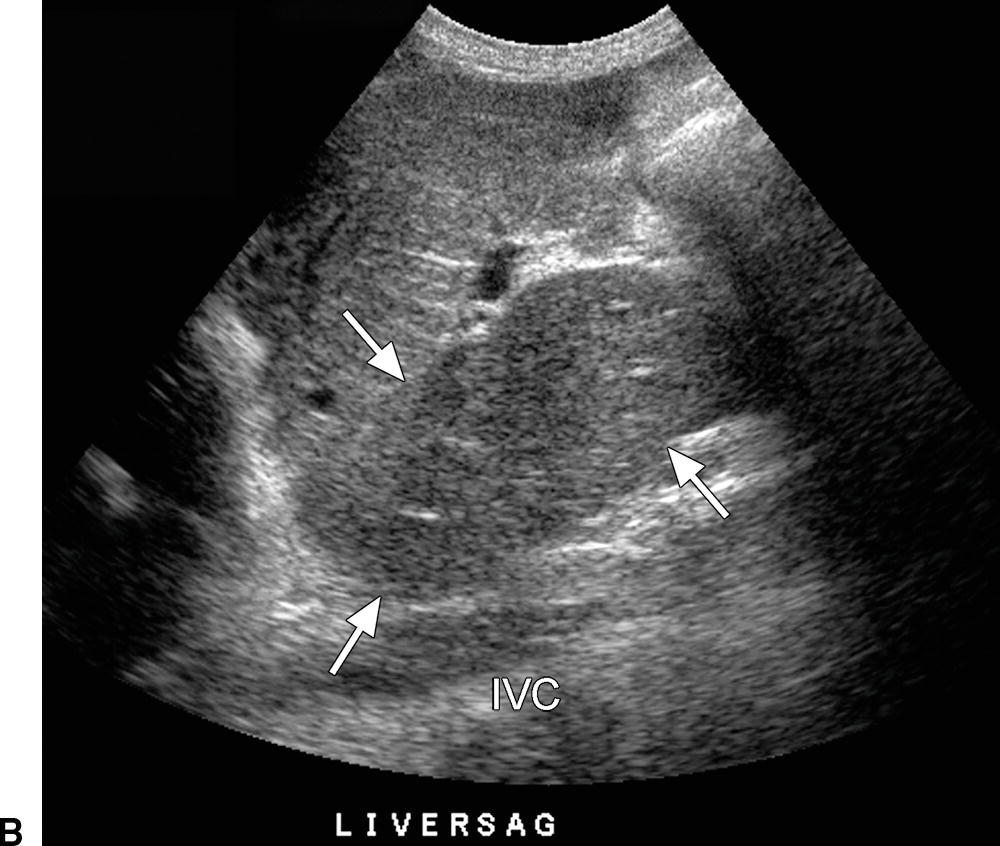
FIGURE 22.27. Budd-Chiari syndrome. A,Gray-scale image of a dilated middle HV (arrow) reveals numerous echogenic intraluminal linear structures, consistent with webs. B,Transverse image of the liver reveals marked hypertrophy of the caudate lobe (arrows), a frequent finding in BCS. IVC, inferior vena cava.
Stay updated, free articles. Join our Telegram channel

Full access? Get Clinical Tree


