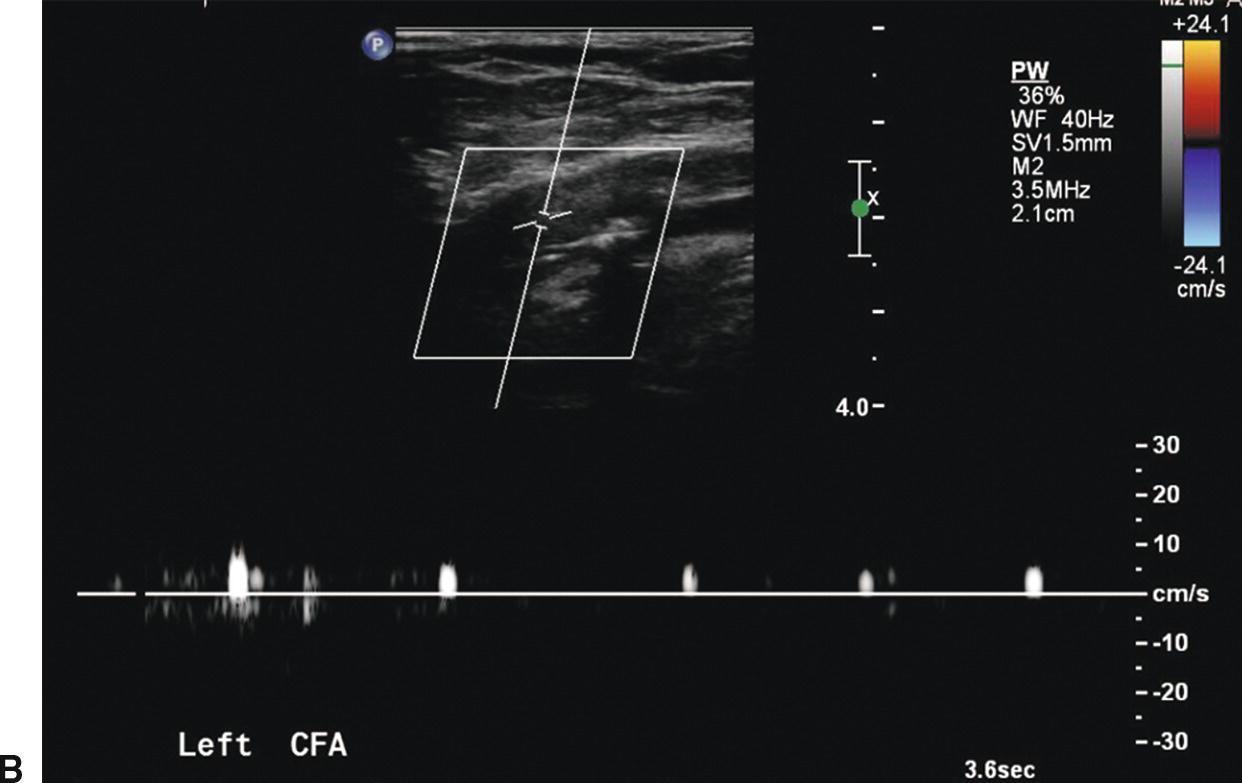
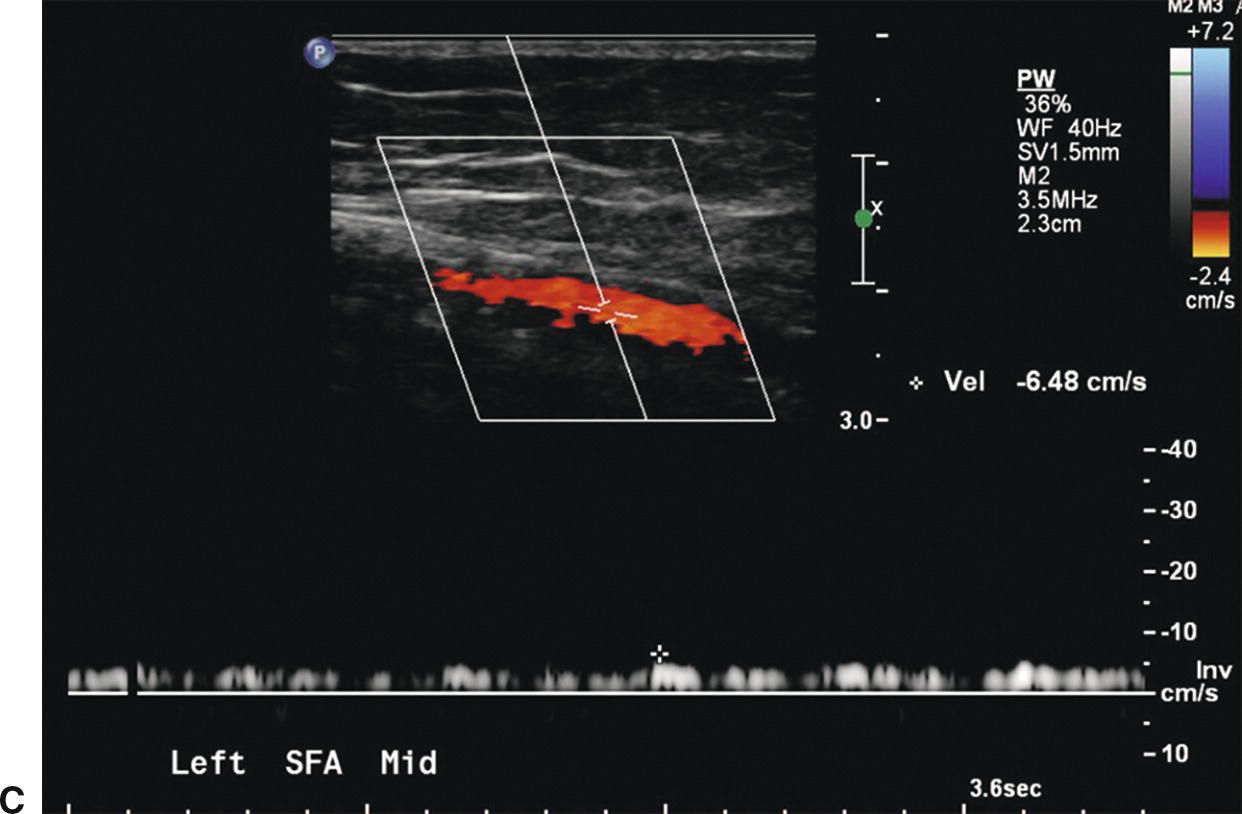
FIGURE 12.1. Patient with an embolus to the left common femoral artery. The common femoral artery (CFA) is occluded with absence of color filling (A) and a preocclusive “thumping” flow waveform (B). More distally the superficial femoral artery (SFA) reconstitutes, as shown by color filling with a low-velocity waveform (C).
A variety of transducers is needed for a complete lower extremity arterial duplex examination. Low-frequency (2- or 3-MHz) transducers are best for evaluating the iliac arteries, whereas a higher frequency (5-MHz) transducer is adequate in most patients for the infrainguinal vessels. In general, the highest frequency transducer that provides adequate depth penetration should be used. As for other applications of arterial duplex scanning, Doppler angle correction is important when examining the peripheral arteries. Although 60 degrees is generally regarded as “ideal,” angles between 30 and 70 degrees are sufficient to provide clinically accurate information.3
EXAMINATION TECHNIQUE
A complete lower extremity arterial duplex examination includes the abdominal aorta; the common and external iliac arteries; the common femoral artery; the profunda femoris artery origin; the proximal, middle, and distal superficial femoral artery; the popliteal artery; and the tibial arteries. Examining patients after a fast of 8 to 12 hours facilitates examination of the intra-abdominal vessels. A complete duplex study in a patient with complicated arterial anatomy may require from 1.0 to 1.5 hours.
The examination begins with the abdominal aorta. With the patient in the supine position, a low-frequency transducer is placed below the xiphoid process and angled cephalad (Fig. 12.2). The proximal abdominal aorta can be seen in long axis with visualization of the origins of the celiac trunk and superior mesenteric artery. This aortic segment is evaluated by both B-mode imaging and pulsed Doppler. The transducer is then angled caudad and moved inferiorly to evaluate the distal abdominal aorta. The aortic bifurcation is visualized by placing the transducer at the level of the umbilicus and using an oblique approach from the patient’s left side (Fig. 12.3). It is important to sweep the pulsed Doppler sample volume slowly through the distal aorta and proximal common iliac arteries to detect stenotic lesions. The transducer is placed at the level of the iliac crest to evaluate the middle to distal common iliac and proximal external iliac arteries (Fig. 12.4). This usually requires applying considerable probe pressure. In many cases, the internal iliac artery can also be evaluated from this approach. The internal iliac artery is used as a landmark to separate the common iliac from the external iliac artery.
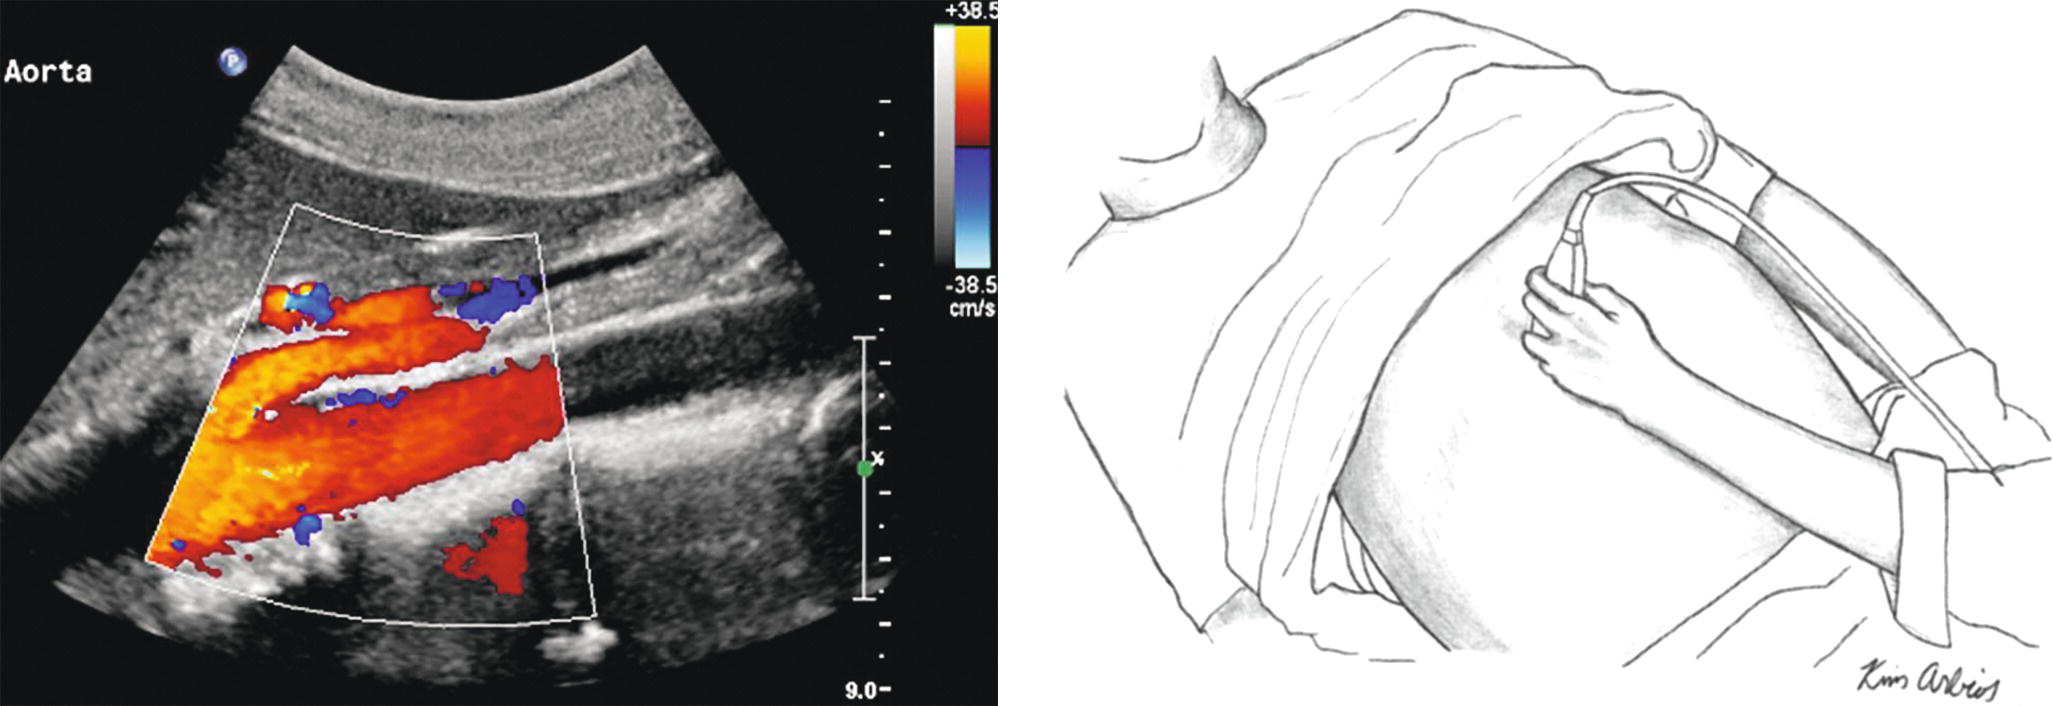
FIGURE 12.2. The transducer is placed just below the xiphoid process and angled cephalad to image the proximal abdominal aorta. The superior mesenteric artery is shown anterior to the aorta in this duplex image.
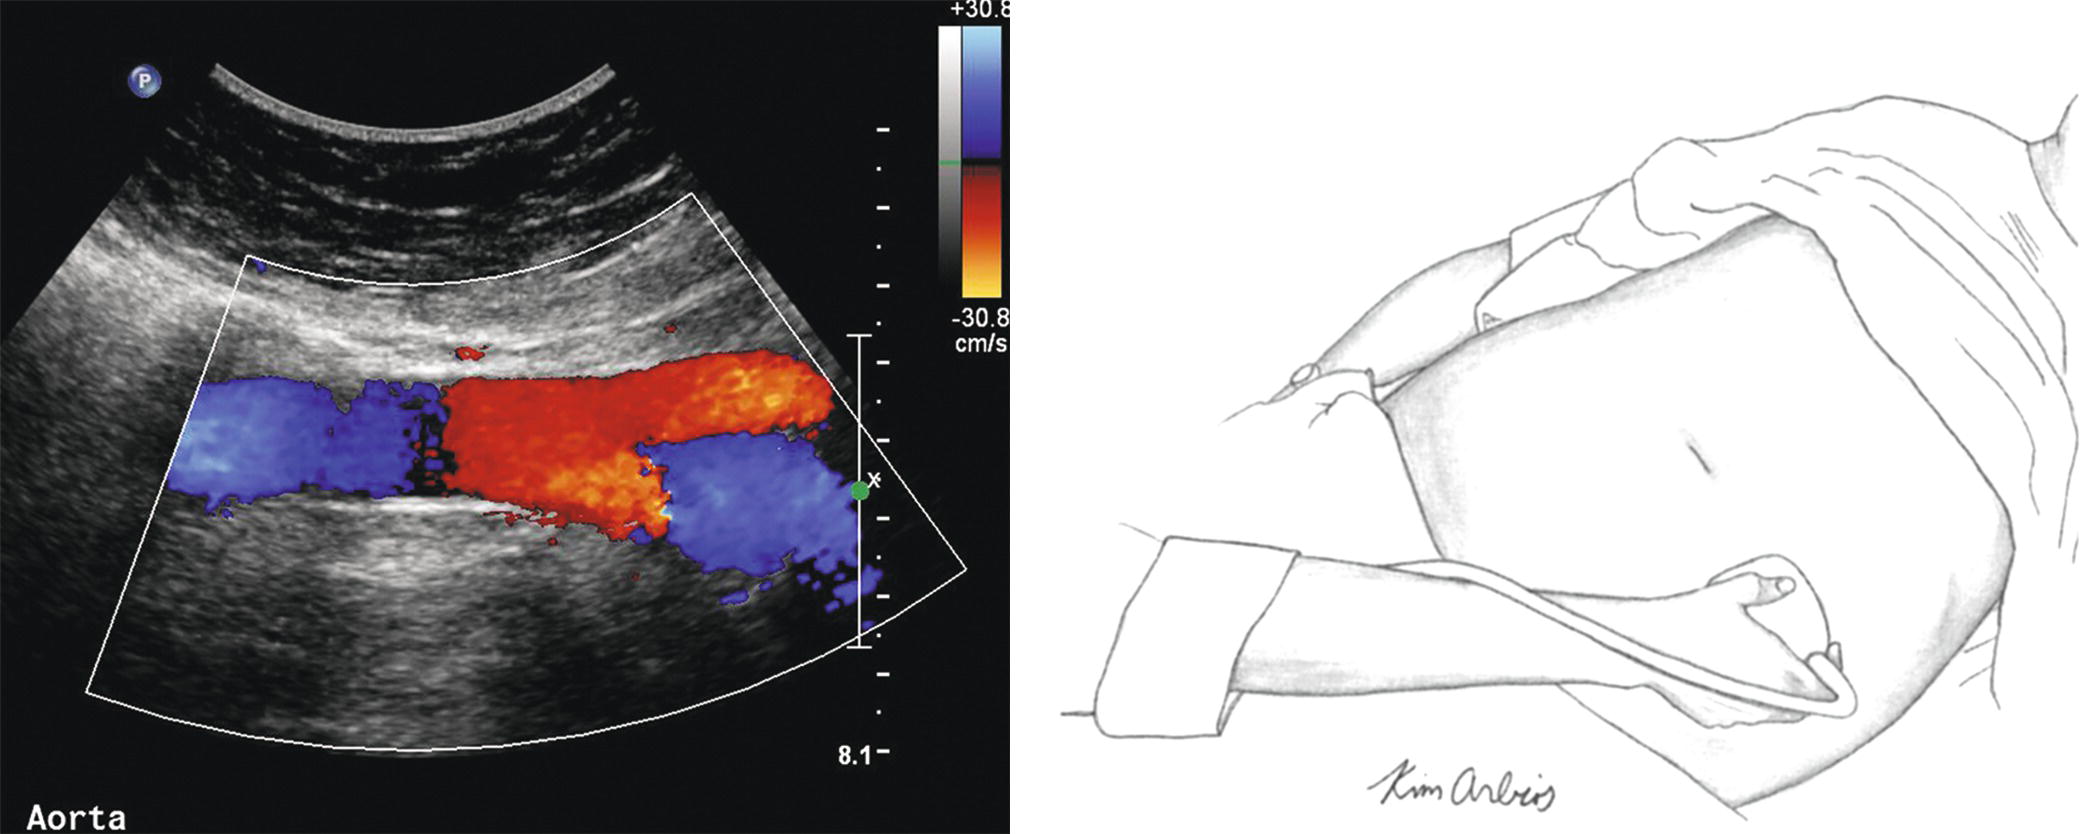
FIGURE 12.3. The transducer is positioned obliquely from the left side at the level of the umbilicus to visualize the distal aorta and proximal common iliac arteries.
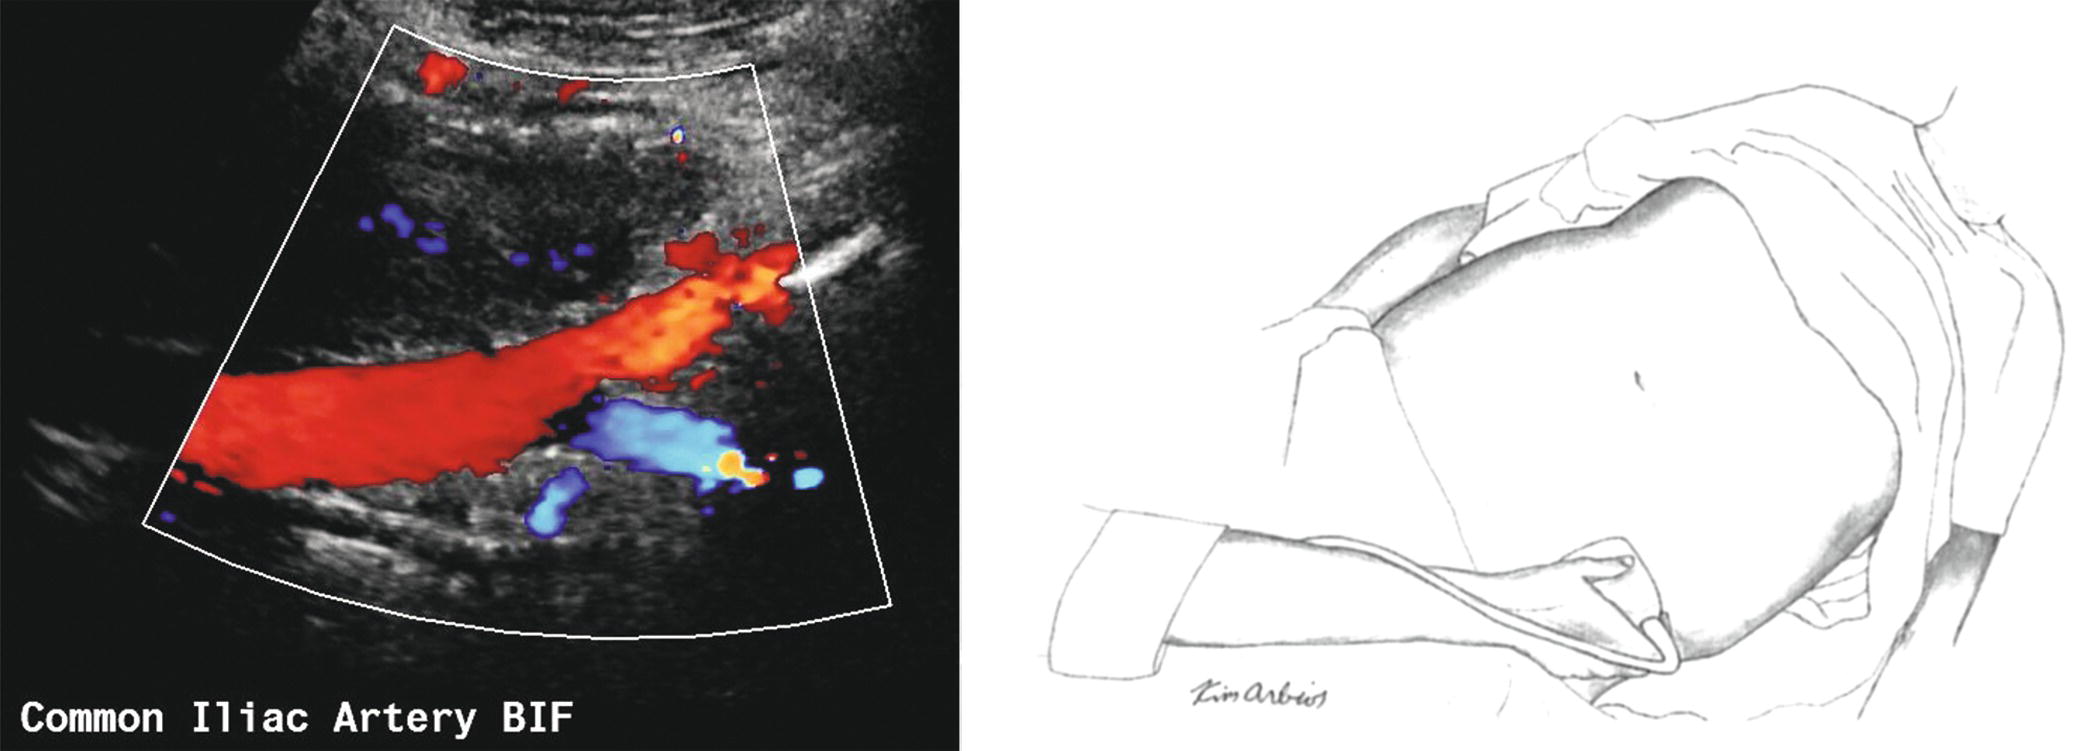
FIGURE 12.4. The transducer is placed at the level of the iliac crest and angled medially to evaluate the middle to distal common iliac artery and the bifurcation (BIF) into the proximal external iliac and internal iliac arteries.
Next, a higher-frequency transducer is placed in the groin and pointed in a cephalad direction to assess the distal external iliac and common femoral arterial segments (Fig. 12.5). The transducer is moved distally down the leg to identify the origins of the profunda femoris and superficial femoral arteries. The profunda femoris artery is normally evaluated for the first 3 or 4 cm, at which point it begins to descend more deeply into the thigh. Attention then turns back to the superficial femoral artery, which is followed down to the level of the knee. When the superficial femoral artery passes through Hunter’s canal, it assumes a deeper position that may make it difficult to assess with the patient supine. At this point, the patient may need to be placed in the prone position to assess the distal superficial femoral and popliteal arteries. As the popliteal artery is scanned in a longitudinal view, the first branch vessel to be encountered is usually the anterior tibial artery.
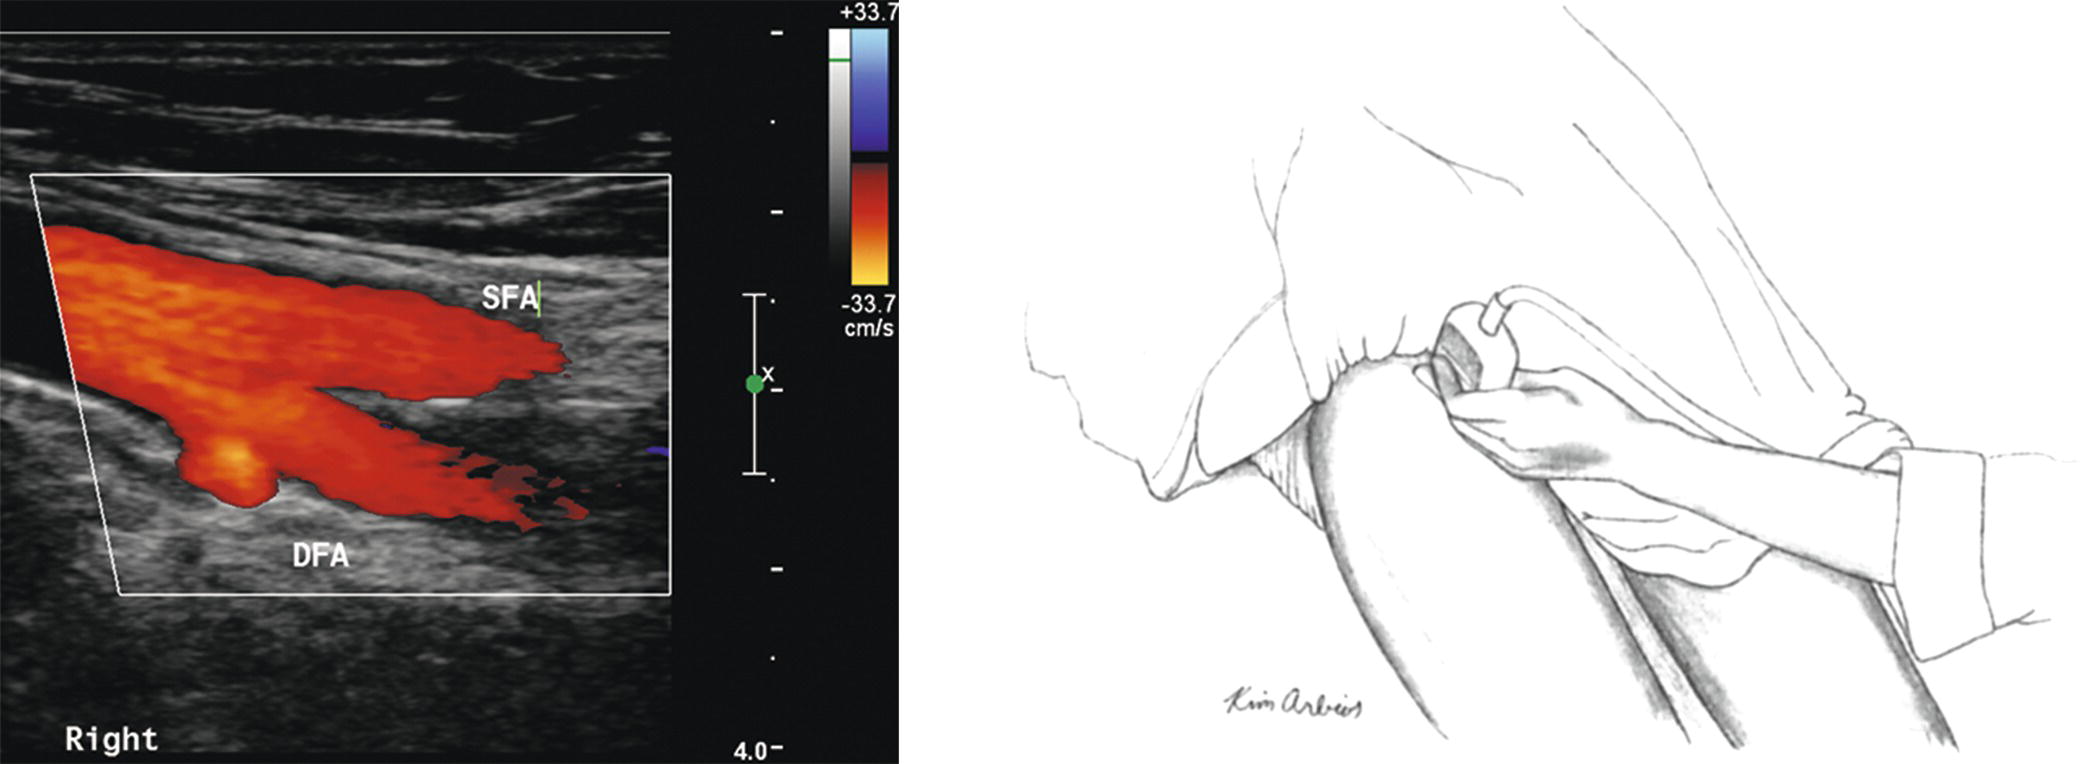
FIGURE 12.5. The transducer is placed in the groin and angled in a cephalad direction to assess the distal external iliac and common femoral arteries. (SFA, superficial femoral artery, DFA, deep femoral artery.)
After the origin of the anterior tibial artery has been identified and interrogated, the technologist places the transducer at the level of the ankle, posterior to the medial malleolus, to visualize the posterior tibial artery (Fig. 12.6). It is possible to follow the posterior tibial artery throughout its entire length up to and including the bifurcation of the tibial-peroneal trunk in the proximal calf. The adjacent paired veins help identify the tibial and peroneal arteries. After scanning the length of the posterior tibial artery, the transducer is placed posterior to the lateral malleolus to assess the distal peroneal artery. Sliding the transducer proximally, the entire length of the peroneal artery is evaluated. Finally, with the transducer placed anteriorly on the ankle, it is possible to follow the anterior tibial artery up to the level at which it penetrates the interosseous membrane to reach its origin from the popliteal artery.
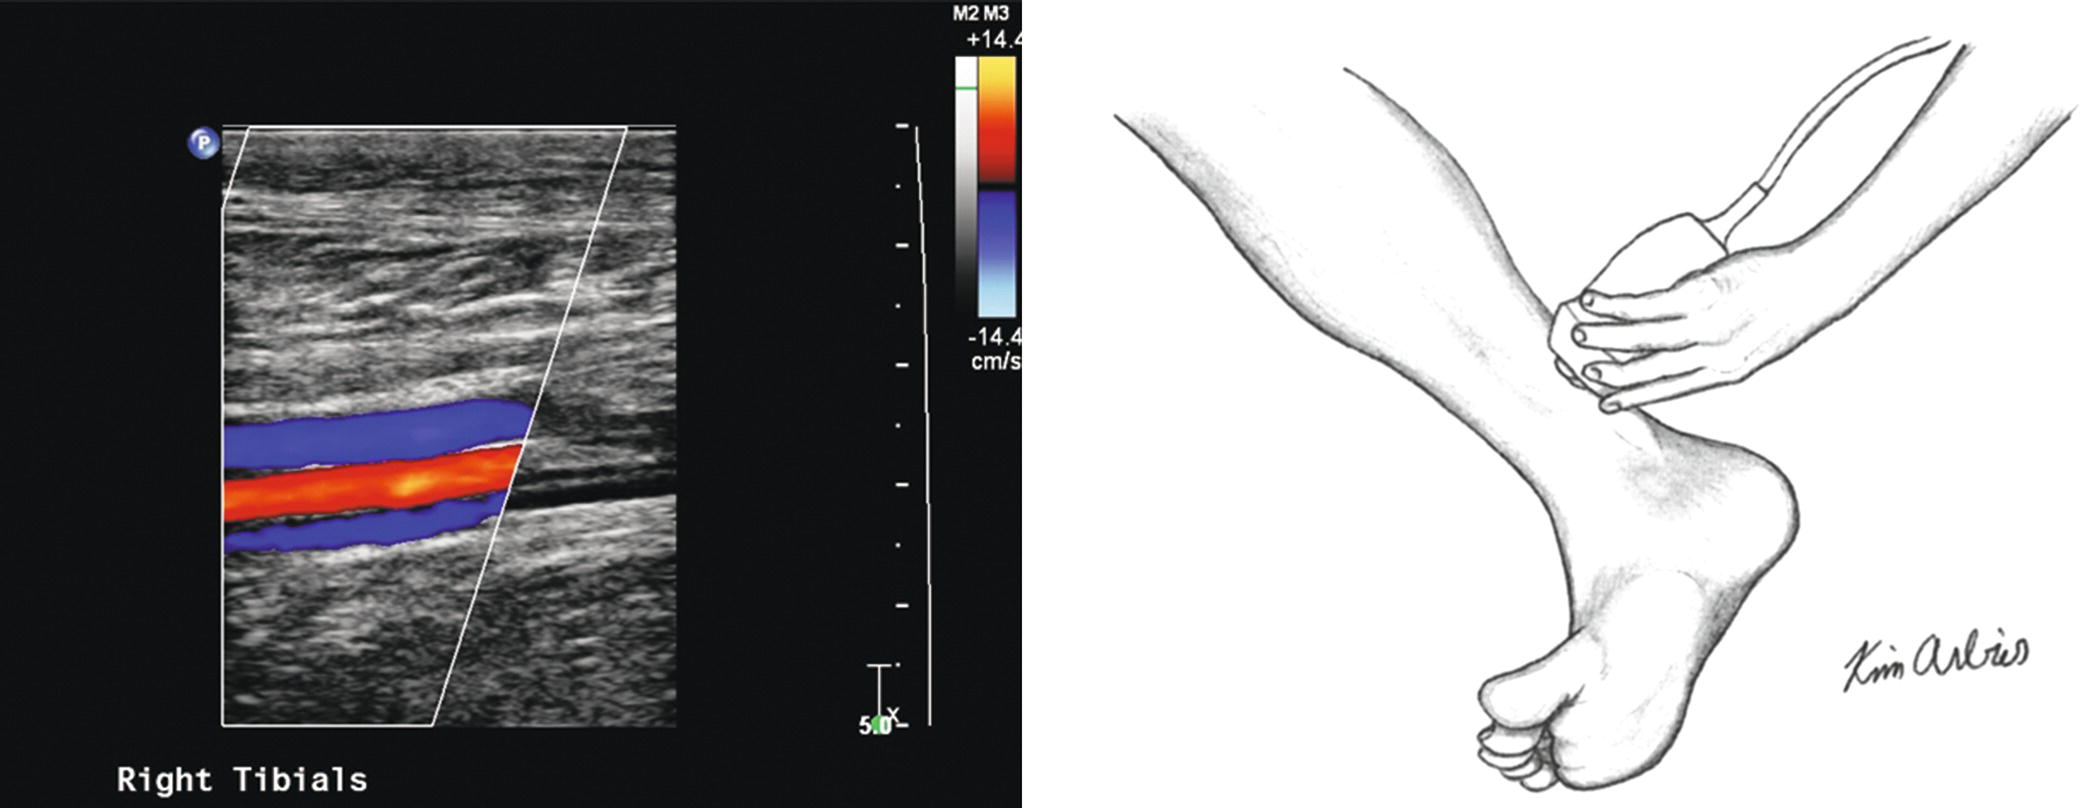
FIGURE 12.6. The transducer is placed at the level of the ankle, posterior to the medial malleolus, to visualize the posterior tibial artery between the adjacent paired veins.
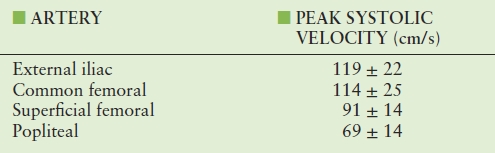
Velocities should be routinely recorded from specified sites and from any site at which a flow disturbance is identified. Areas of both high velocity (suggestive of a hemodynamically significant stenosis) and low velocity (indicating a more proximal stenosis or occlusion) should be noted. Table 12.1 lists expected blood flow velocities from normal lower extremity arterial segments.
TABLE 12.1 Blood Flow Velocities in Normal Lower Extremity Arterial Segments as Measured During Duplex Scanning
CLASSIFICATION OF STENOSIS
As discussed in Chapter 13, flow waveforms from normal resting lower extremity arteries are triphasic, and end-diastolic flow velocity is near the zero baseline, reflecting the high end-organ resistance associated with the peripheral circulation. This triphasic waveform pattern is maintained throughout the length of the lower extremity, but peak systolic velocity (PSV) decreases from the iliac to the tibial vessels (see Table 12.1). There are no significant differences in velocity measurements among the three tibial/peroneal arteries in normal subjects.
Important changes in the lower extremity flow waveforms that signify occlusive disease include the absence of an end-systolic reverse flow component and focal elevation of the PSV. A 50% reduction in arterial diameter (equivalent to a cross-sectional area reduction of 75%) is associated with a pressure drop across the lesion. The University of Washington criteria for classification of peripheral arterial stenoses by duplex scanning are summarized in Table 12.2 and illustrated in Figure 12.7.
TABLE 12.2 University of Washington Duplex Criteria for Classification of Lower Extremity Arterial Stenosis
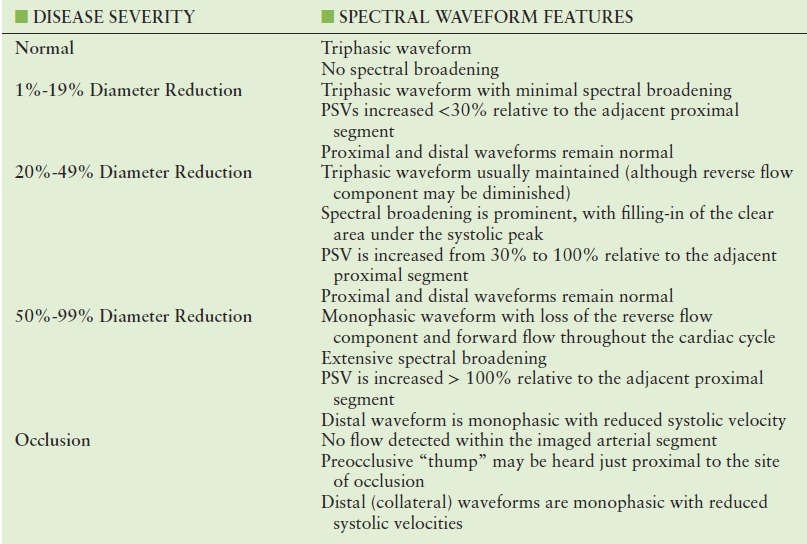
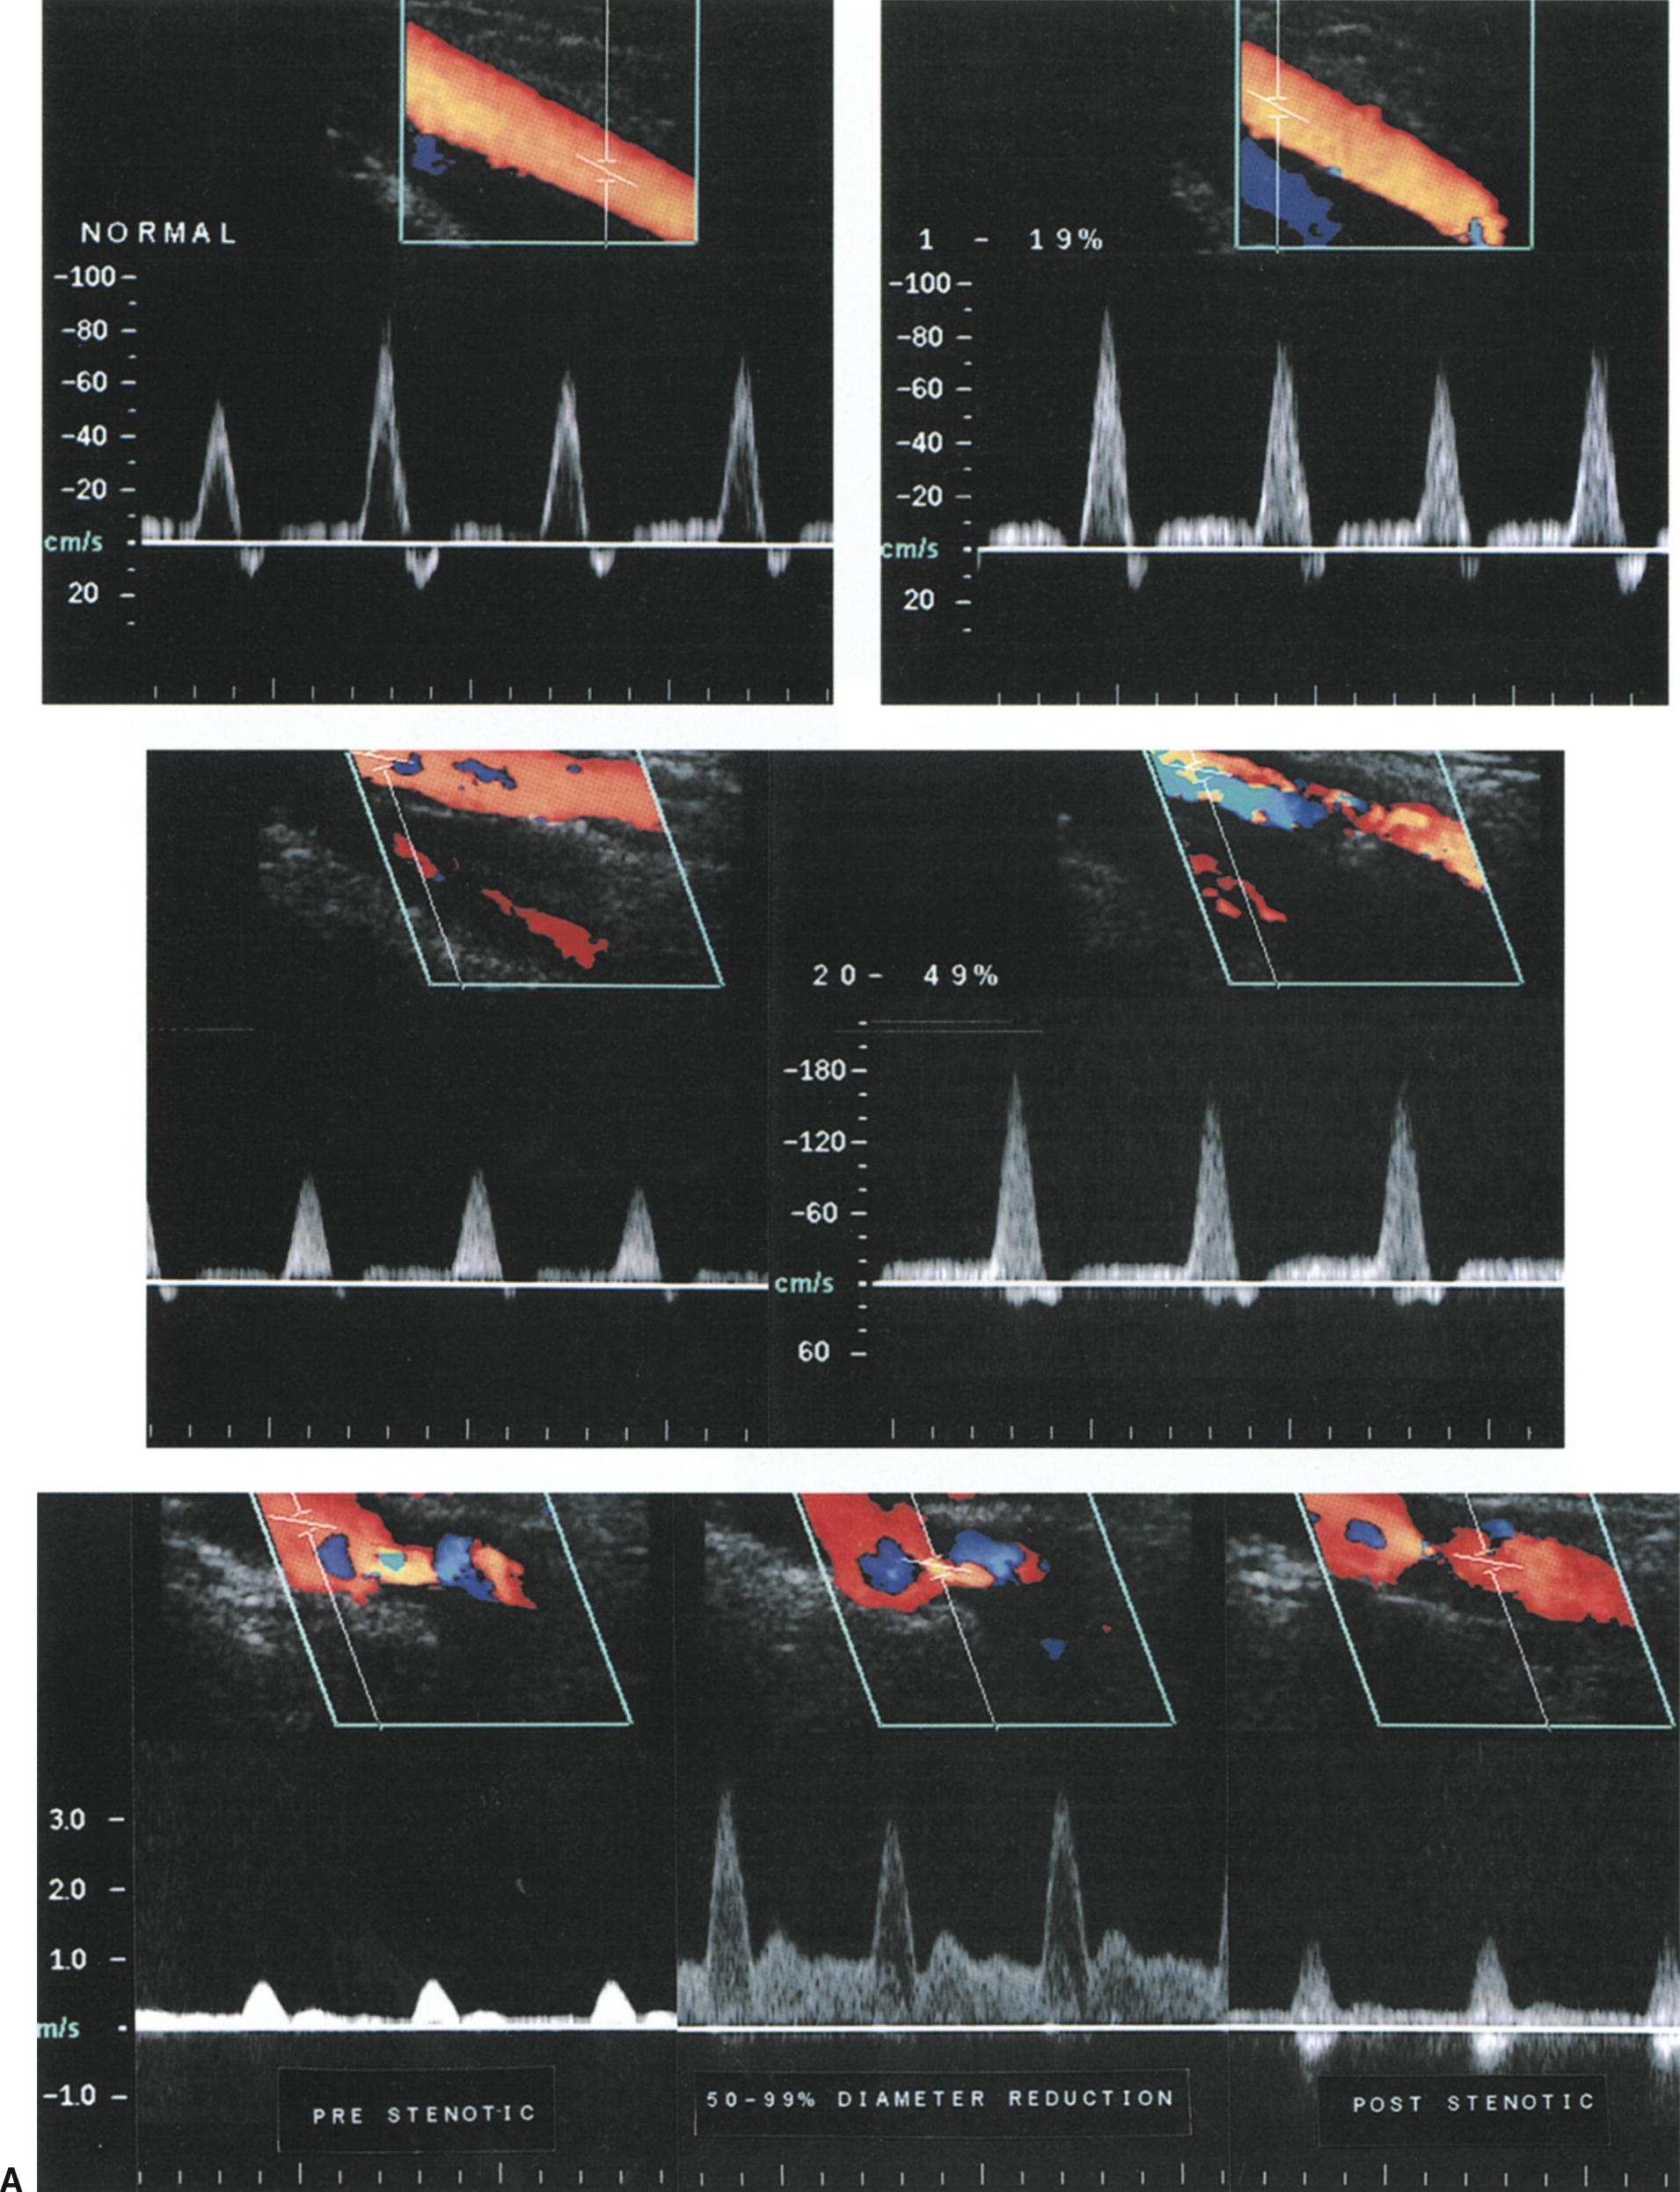
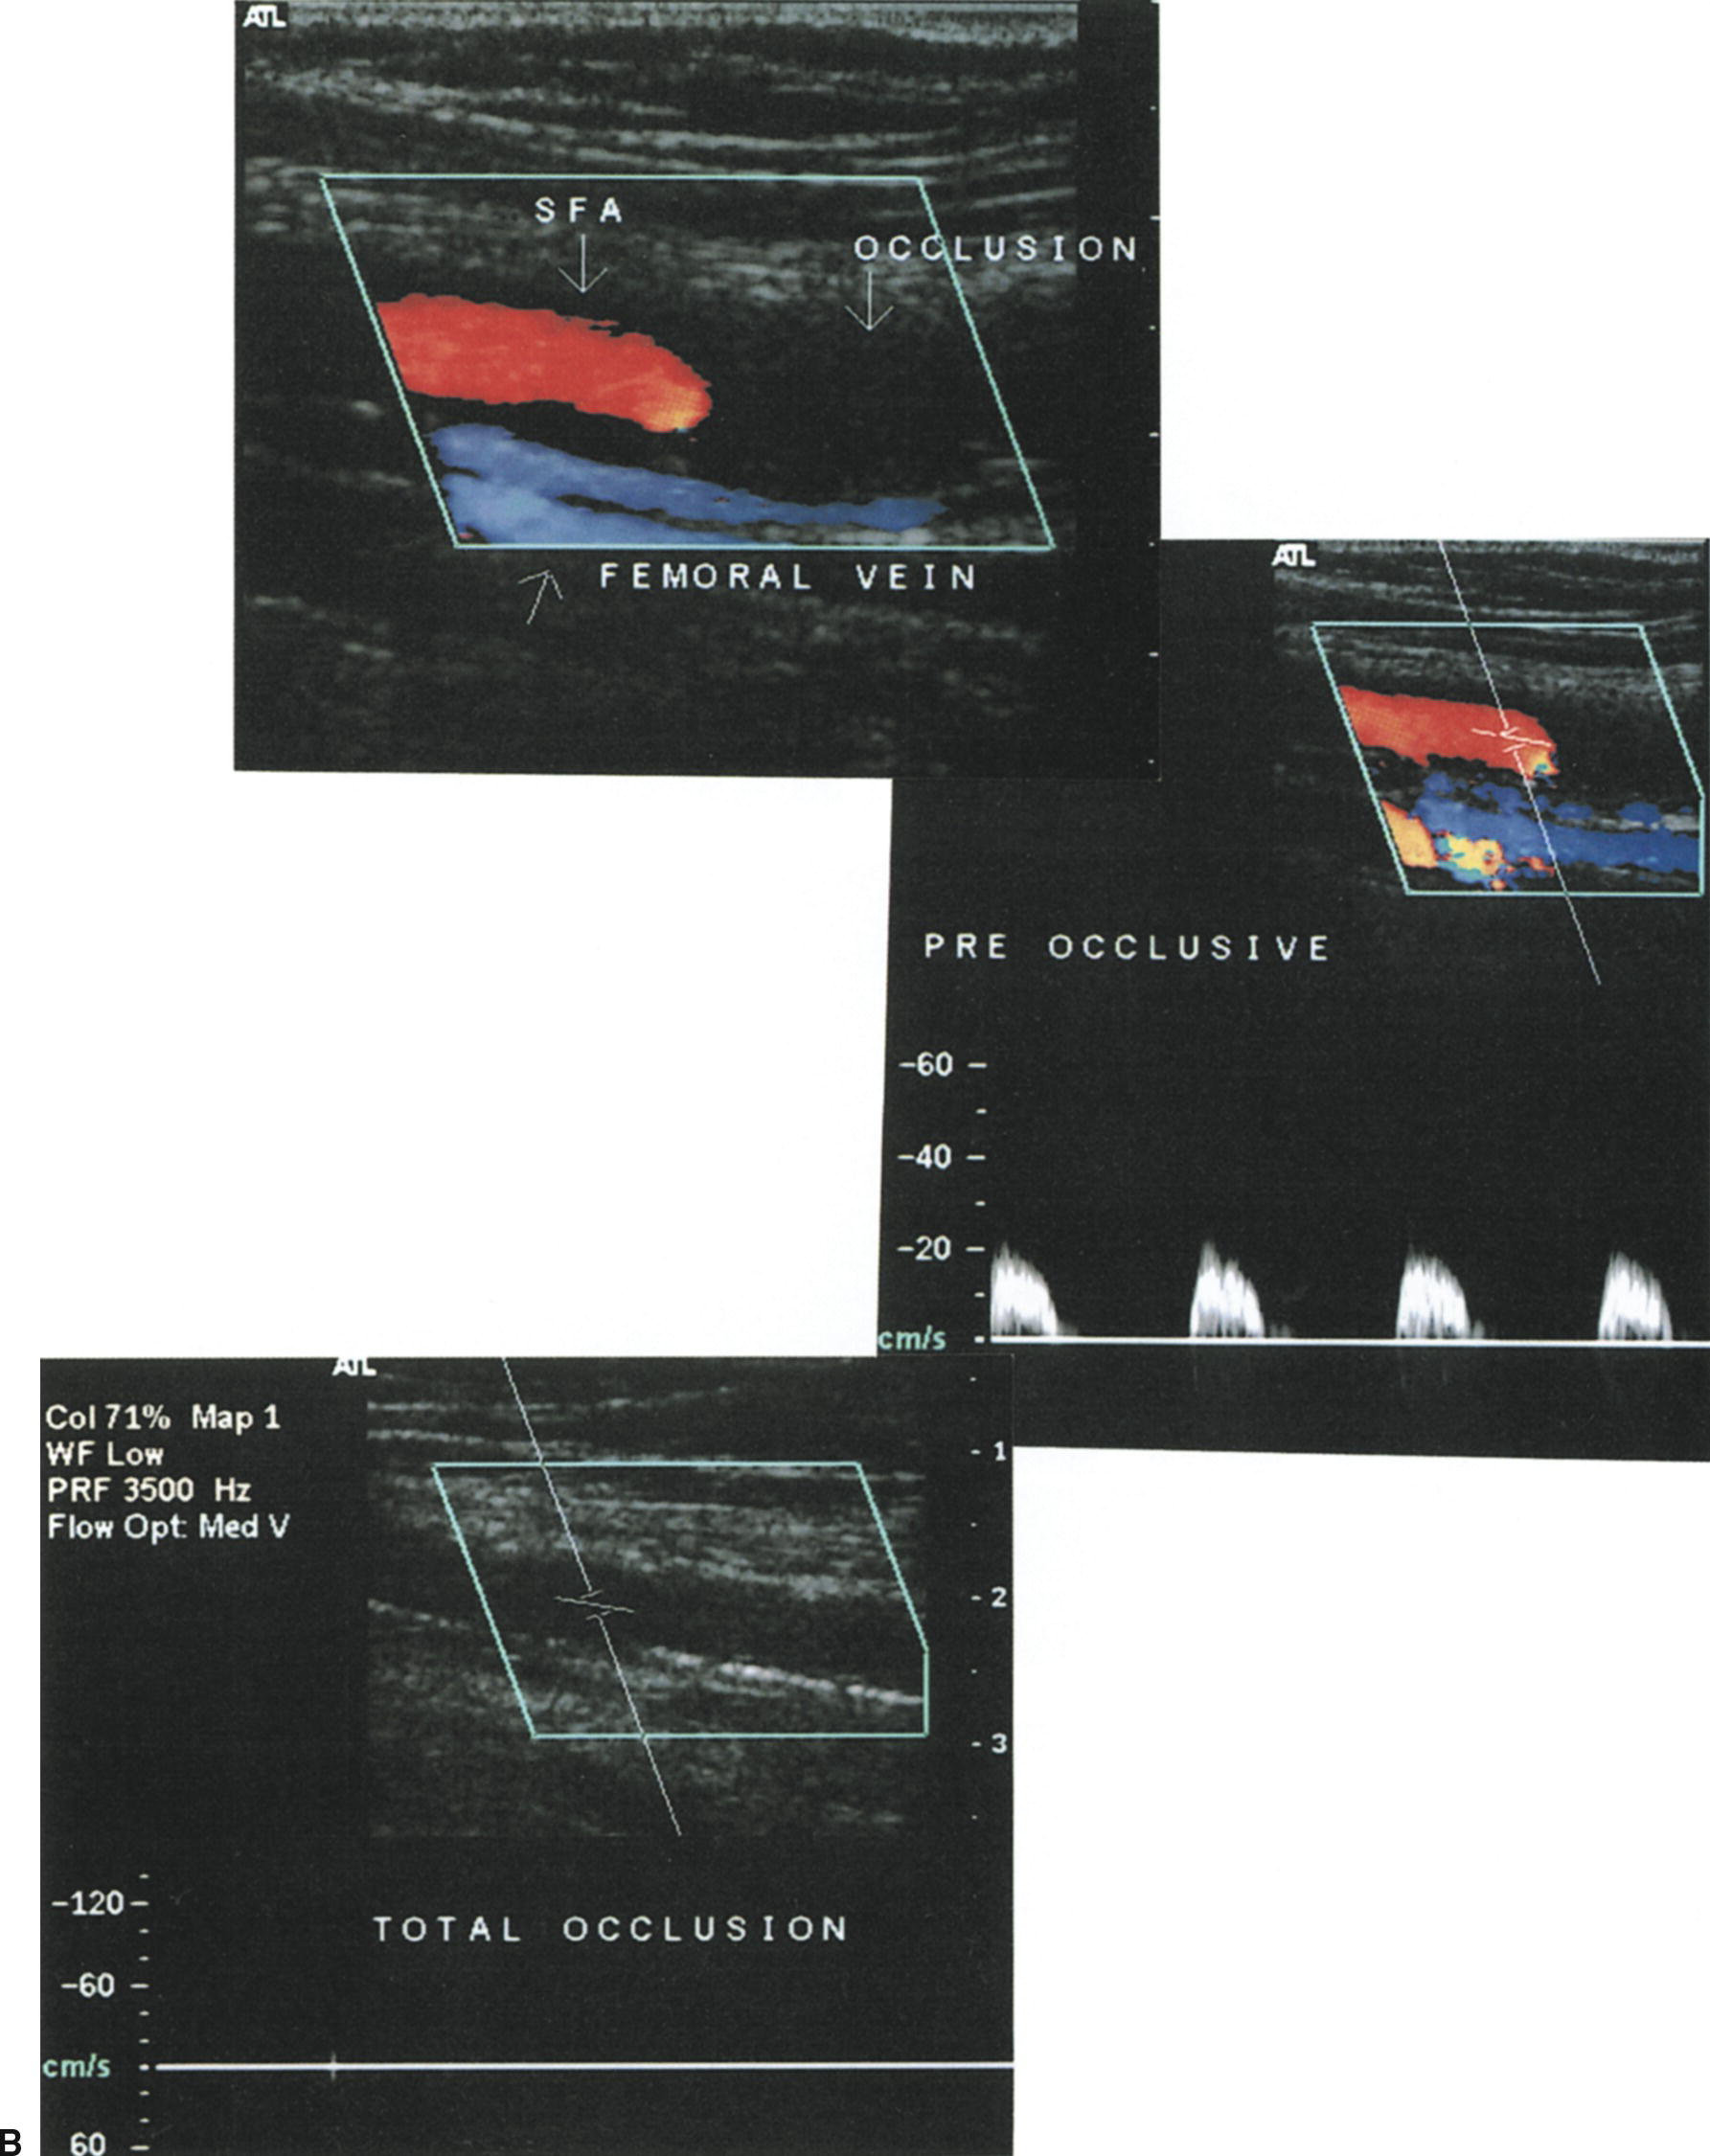
FIGURE 12.7. Examples of typical Doppler spectral waveforms for the peripheral arterial disease categories listed in Table 12.2. (A) Waveforms for normal arteries, 1–19% diameter reduction, 20–49% diameter reduction, and 50–99% diameter reduction. (B) Findings associated with a superficial femoral artery (SFA) occlusion, including a color-flow image taken just proximal to the site of occlusion, the pre-occlusive waveform, and a B-mode/color-flow image of the occluded segment. (C) Distal waveform from an SFA occlusion showing reversed flow direction and monophasic flow in a “re-entry” collateral vessel.
Stay updated, free articles. Join our Telegram channel

Full access? Get Clinical Tree


