Fig. 11.1
Postprocessing curves for GSM analysis
The overall gain should be increased until the plaque can be easily recognized, and noise appears within the lumen. It should then be decreased to obtain a lumen free of noise (black).
The time gain compensation (TGC) curve is adjusted (gently sloping) with the aim of obtaining images where the far and near walls of the artery produce the same echogenicity (Fig. 11.2). At the level of the arterial lumen, no gains of the TGC curve must be done. This is essential for normalization of carotid plaques with anterior and posterior components. The consequence of this is that the ultrasound beam should be at 90° to the arterial wall, with a horizontal adventitia (Fig. 11.3).
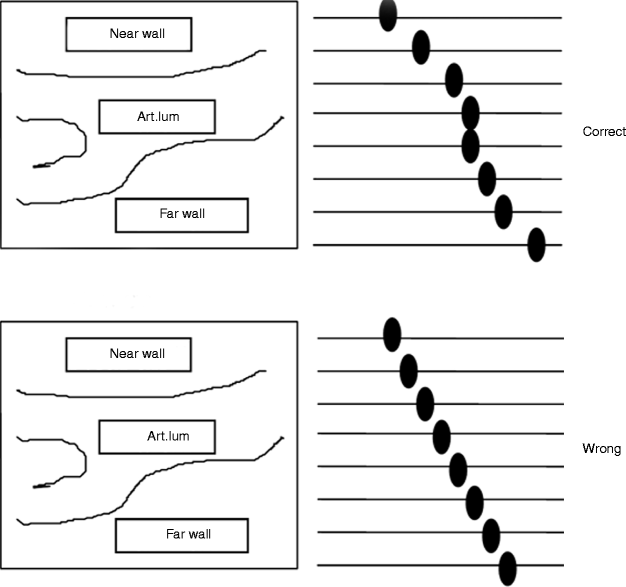
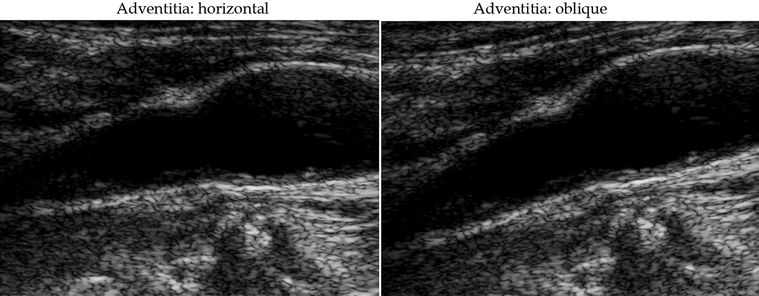

Fig. 11.2
GSM analysis. The setup of the time gain compensation curve

Fig. 11.3
GSM analysis. The orientation of the adventitia in the common carotid artery
The patient should be in a supine position. The carotid vessels are analyzed using different longitudinal views (medial, lateral, and posterolateral). The minimum depth should be used, so that the plaque occupies a large part of the image. Excessive magnification is not required.
In case of acoustic shadow, the image can be analyzed only if >50% of the area depicts acoustic information. The GSM cannot be calculated in plaques without any ultrasound information due to acoustic shadowing. The bigger the section of plaque that can be visualized, more accurate is the information provided by GSM.
Before image recording, the following criteria should be fulfilled:
(a)
Blood: a noiseless vessel lumen in the vicinity of the plaque.
(b)
Adventitia: in the proximity of the plaque, it should be bright, thick, and horizontal (Fig. 11.4).
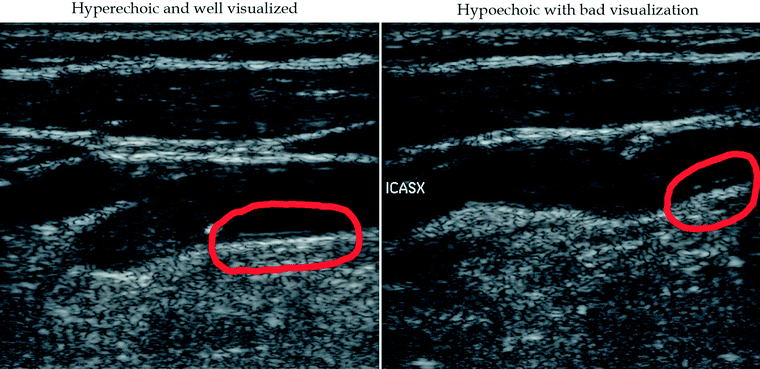

Fig. 11.4
GSM analysis. The identification of the adventitia suitable for image normalization. Left red circle: good visualization of adventitia. Right red circle: bad visualization of adventitia
(c)
Plaque: well-defined and with the maximum thickness.
The following images (in longitudinal projections) should be recorded:
(a)
The B-mode (gray scale) image.
(b)
The color image: it may help in the delineation of the luminal margin of the plaque (especially with hypoechoic dark plaques).
Attention should be paid in order to have B-mode and color image in the same plane.
Digital storage media (magneto-optical disk and compact disk) are preferred to analogical video tape requiring video grabber card.
2.
Image normalization is performed using Adobe Photoshop.
In Adobe Photoshop, both the B-mode and the color image should be open. In the B-mode image, the color information should be discarded: from the “Image” menu, click on “Mode,” then “Gray scale” (Fig. 11.5).


Fig. 11.5
GSM analysis. The color information should be discharged. Left red circle: RGB image; this kind of image should be discarded. Right red circle: grey scale image; this is the optimal image for GSM analysis
Using the “Lasso” tool, drag the pointer to outline the plaque. Then, click on “Histogram” in the “Image” menu. The “median” value shown in the panel is the GSM.
Hypoechoic dark (echolucent) regions are associated with a GSM that tended to approach 0, whereas hyperechoic bright (echogenic) regions are associated with a GSM that tended to approach 255.
The GSM calculated in this manner is not standardized, and, consequently, the GSM is influenced by duplex scanner settings. The lack of reproducibility of non-standardized GSM has been demonstrated by our group and by others: the GSM cutoff point for the identification of carotid plaques at increased risk of stroke was 50 in Milan and 32 in London.
Normalization (standardization) allows to compare images from different scanners by different ultrasonographers. Thanks to normalization, GSM is highly reproducible index of echogenicity.
Image normalization is a gray scale transformation using linear scaling: gray scale values of all pixels in image are adjusted according to two reference points, blood and adventitia. Blood and adventitia were selected because they are easily recognizable near the plaque and constitute the two distinct ends of gray scale (blood = dark, adventitia = bright). The process modifies the image such that in the resultant image the GSM of the blood is 0 and the GSM of the adventitia 190.
Several steps are required for image normalization.
Using the “Lasso” tool, drag the pointer to select an area in the blood that should be free of noise. To check this, in the “Image” menu, click on “Histogram.” The “median” value shown in the panel is the GSM. The GSM of the selected area in the blood should be 0 (Fig. 11.6). If not, the gain of duplex scanner is not set properly (see above).
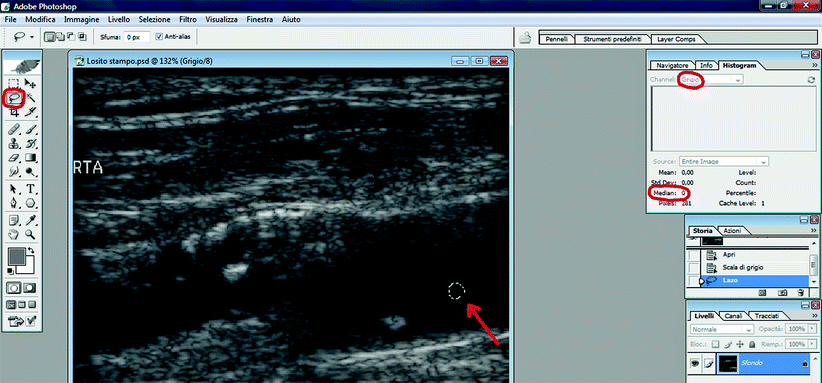

Fig. 11.6
GSM analysis. The GSM calculation of the blood. red arrow: selection of a blood sample with the “lasso” tool
Similarly, using the “Lasso” tool, the brightest part of the adventitia on the same arterial wall of the plaque should be selected (Fig. 11.7). It is important to note that:
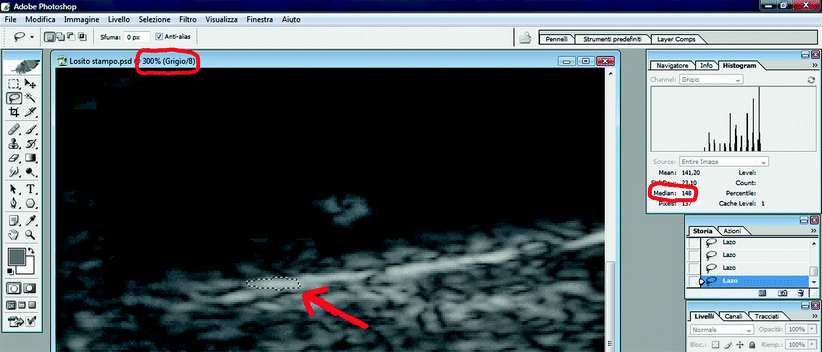

Fig. 11.7
GSM analysis. The GSM calculation of the adventitia. red arrow: selection of a sample of adventitia with the “lasso” tool
Image magnification should be performed before adventitia outlining.
The selected area should not be too small (area, not a point!).
The selected area should be horizontal.
The GSM of adventitia should then be obtained using the “Histogram” function (the GSM of the adventitia in Fig. 11.7 is 148). Unlike the GSM of blood, every GSM value measured in the adventitia is accepted.
To normalize the image, click on “Image” menu, then “Adjustments,” and finally “Curves” (Fig. 11.8). The straight line shown in the panel represents the relationship between the gray scale of the input (x-axis) image and that of the output (y-axis). Each axis has a black and a white edge: this is the gray scale, ranging from 0 (completely black) to 255 (completely white).
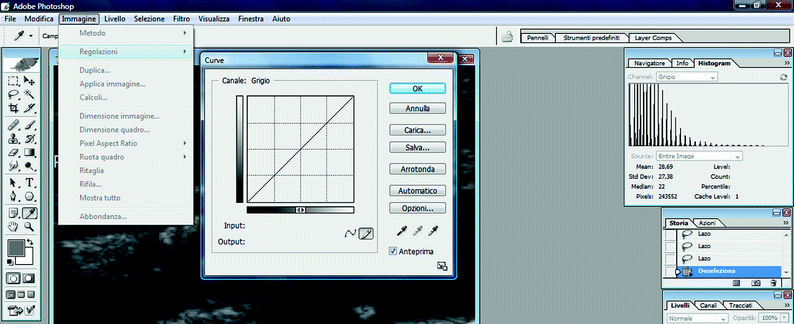

Fig. 11.8
GSM analysis. The “curve function” in Adobe Photoshop used for image normalization
The aim of normalization is to modify the subjectivity related to the echographic examination. This purpose can be achieved using the brightest (adventitia) and the faintest (blood) areas of the image: in particular conditions (the duplex scanner settings described above), these areas are independent of the type of duplex scanner and the ultrasonographer. Normalizing the image, the faintest point remains unchanged with a GSM value of 0 before and 0 after standardization (a proper gain adjustment is essential for this purpose). On the other hand, the GSM value of the brightest area (adventitia) drives all the normalization process: the adventitial GSM value measured before (input value) is converted arbitrarily to a GSM value of 190 (output value). In the normalized image, the GSM value of blood and adventitia is 0 and 190, respectively, independent of the type of duplex scanner and the ultrasonographer.
In Adobe Photoshop, the straight line shown in the panel should be modified so that the new line crosses a new point with the input value corresponding to measured adventitial GSM value and the output value corresponding to 190 (Fig. 11.9). The image is now standardized (Fig. 11.10).
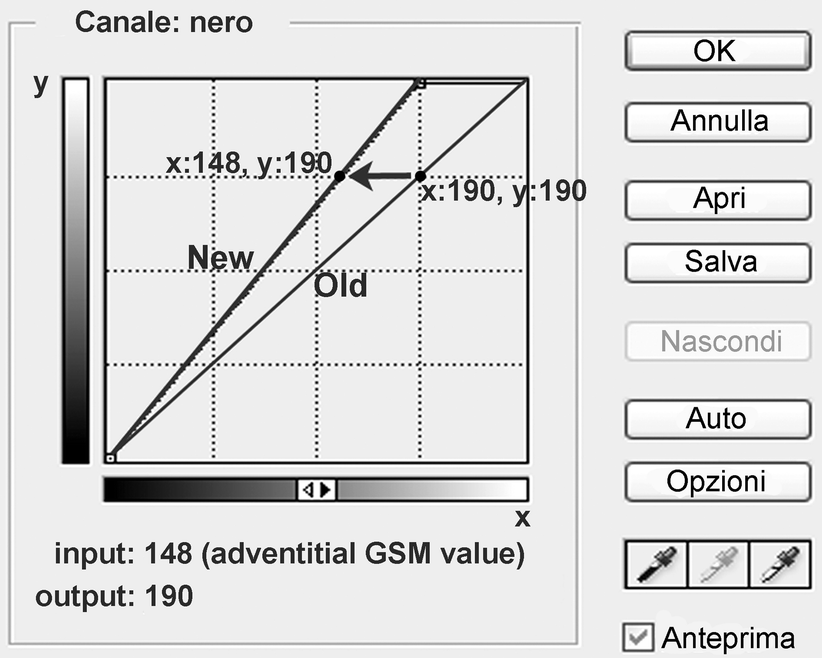
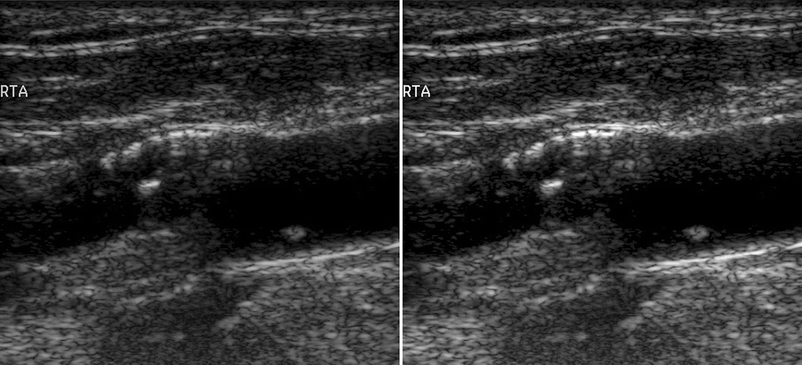

Fig. 11.9
GSM analysis. The shift of the curve for image normalization

Fig. 11.10
Left side: carotid plaque before image normalization. Right side: carotid plaque after normalization
3.
In Adobe Photoshop, using the “Lasso” tool, the plaque should be outlined. In the “Histogram” panel, the following measurements are obtained:
(a)
GSM, defined as the median of overall gray values of the pixels in the plaque (Fig. 11.11).
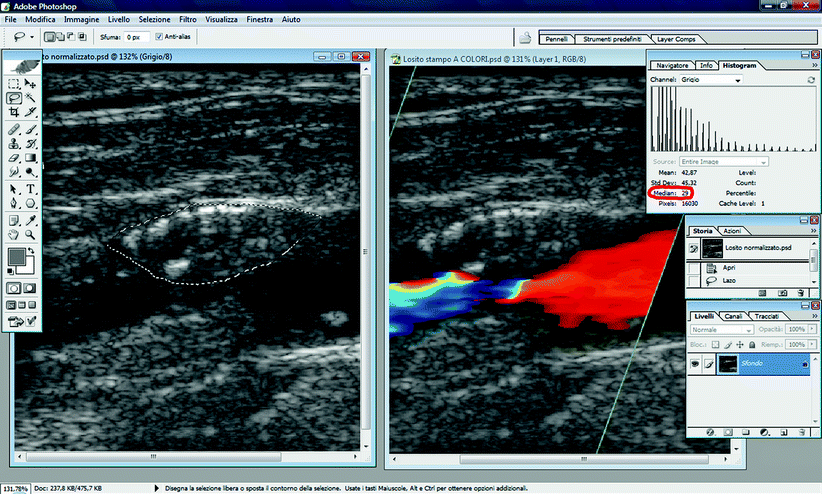

Fig. 11.11
GSM calculation in the normalized image
(b)
Standard deviation (SD). SD is a measure of dispersal, or variation, in a group of numbers. SD tells how tightly a set of values is clustered around the average of those same values.
If you need help to measure the GSM, please feel free to contact us at alberto.froio@unimib.it
Clinical Trials on Carotid Plaque Echolucency and Clinical Endpoints
With the Imaging in Carotid Angioplasty and Risk of Stroke (ICAROS) study, an international multicenter registry that collected 418 CAS cases from 11 centers, we evaluated the relationship between the echogenicity of carotid plaque, as measured by GSM, and the risk of stroke during CAS in order to obtain a better selection of candidates for CAS [11, 12]. An echographic evaluation of carotid plaque with GSM measurement was made pre-procedurally. The onset of neurological deficits during the procedure and the post-procedural period (30 days) was recorded. The GSM value in complicated patients was significantly lower than in uncomplicated cases, both in the stroke (p < 0.005) and the stroke plus TIA (p < 0.005) subsets. A receiver operating characteristic curve was used to choose the best GSM cutoff value: the most successful threshold was 25. The prevalence of a GSM value <25 (echolucent plaques) was high: 37% (155 of 418 patients). Eleven (7.1%) of the 155 patients with GSM ≤ 25 had a stroke compared to 4 (1.5%) of 263 patients with GSM > 25 (p = 0.005) [11].
The Asymptomatic Carotid Stenosis and Risk of Stroke study (ACSRS) was an international multicenter study whose aim was to detect groups of patients with asymptomatic carotid stenosis associated with greater or lower risk of a natural neurological event [13]. A total of 1,121 patients with 50–99% asymptomatic ICA stenosis in relation to the bulb (European Carotid Surgery Trial [ECST] method) were followed up for 6–96 months (mean, 48). Severity of stenosis; age; systolic blood pressure; increased serum creatinine; smoking history of more than 10 pack-years; history of contralateral transient ischemic attacks (TIAs) or stroke; low gray scale median (GSM); increased plaque area; plaque types 1, 2, and 3; and the presence of discrete white areas (DWAs) without acoustic shadowing were associated with increased risk. Carotid stenosis, history of contralateral TIAs or stroke, GSM, plaque area, and DWAs were independent predictors of ipsilateral events. Combinations of these could stratify patients into different levels of risk for ipsilateral events: in the 923 patients with >70% stenosis, the predicted cumulative 5-year stroke rate was <5% in 495, 5–9.9% in 202, 10–19.9% in 142, and >20% in 84 patients.
The prospective, observational, international multicenter Asymptomatic Carotid Emboli Study recruited subjects with severe asymptomatic carotid stenosis (≥70%), analyzing carotid plaque features and embolic signals (ES) [14]. A total of 164 (37.7%) plaques were graded as echolucent. Plaque echolucency at baseline was associated with an increased risk of ipsilateral stroke alone (HR 6.43, 95% CI 1.36–30.44, p = 0.019). A combined variable of plaque echolucency and ES positivity at baseline was associated with a markedly increased risk of ipsilateral stroke alone (HR 10.61, 95% CI 2.98–37.82, p = 0.0003). This association remained significant after controlling for risk factors, degree of carotid stenosis, and antiplatelet medication. The combination of ES detection and plaque morphology allows a greater prediction than either measure alone and identifies a high-risk group with an annual stroke risk of 8% and a low-risk group with a risk of <1% per annum.
Ishizu compared carotid ultrasonic imaging with biomarkers such as high-sensitivity C-reactive protein (hs-CRP) and oxidized low-density lipoprotein (LDL) stratifying cardiovascular risk [15]. Carotid plaque echolucency was quantified by measuring GSM. Univariate Cox regression analysis showed CRP and several ultrasonic parameters to be significant determinants for cardiovascular events. Multivariate Cox analysis determined CRP and plaque echolucency to be independent variables predicting cardiovascular events after adjustment for classic CAD risk factors. In Kaplan–Meier plots, patients with both high CRP (≥1.0 mg/L) and echolucent plaque (GSM ≤ 65) showed higher event rates than did patients with high CRP but without echolucent plaque.
The Health Insurance Portability and Accountability Act–compliant study correlated echogenicity and severity of atherosclerotic carotid artery lesions at standard ultrasound with the degree of intraplaque neovascularization at contrast material–enhanced (CE) ultrasound [16]. Echogenicity was inversely correlated with grade of intraplaque neovascularization (p < 0.001). More echolucent lesions had a higher degree of neovascularization compared with more echogenic ones (p < 0.001). The degree of stenosis was significantly correlated with grade of intraplaque neovascularization (p = 0.003). Intraplaque neovascularization in the carotid arteries detected with CE ultrasound was more pronounced in symptomatic patients with a history of cerebrovascular or cardiac events [17, 18].
At the University of Copenhagen, the association between carotid plaque ultrasound echogenicity and the presence of inflammation depicted with positron emission tomography (PET) of plaques with the use of [18F]-fluorodeoxyglucose (FDG) was evaluated [19]. There was a negative correlation between GSM and FDG maximum standardized uptake values (SUV). Whereas echo-rich plaques tended to show low FDG uptake, echolucent plaques ranged from high to low inflammatory activity, as depicted with PET. There was a positive correlation between CD68 expression and FDG uptake. Choi demonstrated that serum hs-CRP levels were found to be correlated with F-18 FDG target-to-background ratio (TBR) values of carotid arteries [20]. The higher the amount of inflammation in carotid plaques, the higher the risk of stroke: dense plaque inflammation (especially infiltration with macrophages) was the feature most strongly associated with both cap rupture and time since stroke (p = 0.001) [21].
These studies demonstrated the relationship between carotid plaque echolucency evaluated by GSM, hs-CRP, carotid plaque infiltration by macrophage, neovascularization, plaque rupture, embolic load to the brain, and eventually risk of stroke.
Clinical Implications of Carotid Plaque Analysis
A 58-year-old man was referred by a cardiologist to the San Gerardo Vascular Surgery Department for the evaluation of a right internal carotid plaque, diagnosed 4 months earlier with a 60% degree of stenosis. The medical history was the following:
Hypertension
Type 2 diabetes
Obesity
Dyslipidemia
Smoker
Myocardial infarction (1997), PTCA on right coronary artery
Atrial fibrillation on amiodarone (1999)
Acute pancreatitis treated by papillosphincterotomy (2003)
Hospital admission for uncontrolled glycemia (2004), successful therapy with glimepiride and metformin
Anxious state + depression on trifluoperazine + clomipramine
Gastric ulcer with bleeding, pantoprazole + aspirin (contraindication to warfarin)
Unstable angina, coronarography, trivessel disease without surgical/endovascular indication (Jan 2007)
Coronary bypass (July 2009)
Acute heart failure with atrial fibrillation and pericarditis (Sep 2009), therapy with ramipril, amlodipine, furosemide, and nebivolol
What can we suggest to reduce the cardiovascular risk?
A.
Weight loss program
B.
Smoking cessation advice
C.
Psychotherapy
D.
Physical activity program
E.
Hypocholesterolemic diet
The patient refused any diet, smoking-cessation, and psychotherapeutic program.
How often should a high-risk patient with a carotid degree of stenosis of 60% be evaluated by ultrasound?
A.
Every month
B.
Every 3–4 months
C.
Every 9 months
D.
Every 12 months
E.
Every 18 months
The screening program should be very tight in patients with a severe cardiopathy refusing the cessation of smoking and a hypoglycemic and hypocholesterolemic program.
Stay updated, free articles. Join our Telegram channel

Full access? Get Clinical Tree


