Smoke-free ordinance implementation and advances in smoking cessation (SC) treatment have occurred in the past decade; however, little is known about their impact on SC in patients with coronary artery disease. We conducted a retrospective cohort study of 2,306 consecutive patients from Olmsted County, Minnesota, who underwent their first percutaneous coronary intervention (PCI) from 1999 to 2009, and assessed the trends and predictors of SC after PCI. Smoking status was ascertained by structured telephone survey 6 and 12 months after PCI (ending in 2010). The prevalence of smoking in patients who underwent PCI increased nonsignificantly from 20% in 1999 to 2001 to 24% in 2007 to 2009 (p = 0.14), whereas SC at 6 months after PCI decreased nonsignificantly from 50% (1999 to 2001) to 49% (2007 to 2009), p = 0.82. The 12-month quit rate did not change significantly (48% in 1999 to 2001 vs 56% in 2007 to 2009, p = 0.38), even during the time periods after the enactment of smoke-free policies. The strongest predictor of SC at 6 months after PCI was participation in cardiac rehabilitation (odds ratio [OR] 3.17, 95% confidence interval [CI] 2.05 to 4.91, p <0.001), older age (OR 1.42 per decade, 95% CI 1.16 to 1.73, p <0.001), and concurrent myocardial infarction at the time of PCI (OR 1.77, 95% CI 1.18 to 2.65, p = 0.006). One-year mortality was lower in the group of smokers compared with never smokers (3% vs 7%, p <0.001). In conclusion, SC rates have not improved after PCI over the past decade in our cohort, despite the presence of smoke-free ordinances and improved treatment strategies. Improvements in delivery of systematic services aimed at promoting SC (such as cardiac rehabilitation) should be part of future efforts to improve SC rates after PCI.
Previous research has shown that smoking cessation (SC) after percutaneous coronary intervention (PCI) improves patient outcomes, and other research has identified various predictors of SC after PCI, including previous cigarette consumption and number of coexisting coronary artery disease risk factors. Little is known about current trends in SC after PCI and about the potential impact of smoke-free policies and SC therapies on SC and subsequent health outcomes after PCI. To help shed light on these issues, we assessed the trends and predictors of SC after PCI in Olmsted County, Minnesota, during the enactment of local and statewide smoke-free public policies (time frame of the PCI was January 1, 1999, to December 31, 2009, with 12 months of follow-up). We hypothesized that the smoking quit rate after PCI would be higher in 2010 than in 1999 and that smoking quit rates would increase during the time periods immediately after the implementation of local and statewide smoke-free legislation.
Methods
We carried out a retrospective cohort study that included patients from Olmsted County, Minnesota, who underwent PCI at the Mayo Clinic in Rochester, Minnesota. Olmsted County is located in southeastern Minnesota and has a population of 144,248 (2010). Only 1 medical center in Olmsted County (Mayo Clinic/St. Mary’s Hospital) has a coronary catheterization laboratory capable of performing PCI. A data registry has been maintained since 1979 for the Mayo Clinic/St. Mary’s Hospital coronary catheterization laboratory that has prospectively collected data on patient characteristics, including baseline demographic, clinical, and angiographic data at the time of the procedure, obtained from each patient’s Mayo Clinic medical records. Follow-up data have also been collected by structured telephone interviews at 6 and 12 months after PCI and then annually thereafter. The Mayo Clinic Cardiovascular Rehabilitation Program was the only program in the community during the study period. More information is available about the program and related details in the online supplement . The study was approved by the Institutional Review Committee at the Mayo Clinic, in Rochester, Minnesota.
We assessed the change in 6- and 12-month smoking quit rates in patients who underwent PCI from January 1, 1999, to December 31, 2009, with particular attention to quit rates around 2 dates when 3 smoke-free ordinances were implemented to reduce secondhand tobacco exposure in Olmsted County, Minnesota: (1) January 1, 2002: an ordinance requiring smoke-free restaurants was implemented in Olmsted County; (2) October 1, 2007: an ordinance requiring smoke-free workplaces was implemented in Olmsted County; and (3) October 1, 2007: an ordinance requiring smoke-free workplaces was implemented in the entire state of Minnesota.
Respecting the timing of these smoke-free policies, we analyzed data from 3 time periods: time period 1 (TP1), from 1999 to 2001, time period 2 (TP2), from 2002 to 2006, and time period 3 (TP3), from 2007 to 2010 (enrollment ended by December 31, 2009, with the follow-up of 12 months). More about the methods of our research is described in the online supplement .
Continuous variables are summarized as mean ± SD. Categorical variables are presented as frequency (percentage). Kaplan-Meier methods were used to estimate survival for time-to-event variables. Comparisons between smokers and nonsmokers were made using the Student’s t test for continuous variables, Pearson’s chi-square test for categorical variables, the rank-sum test for ordinal variables, and the log-rank test for time-to-event variables. Logistic regression was used to fit a model to quit rates after PCI within patients who were potential quitters (smoking at the time of PCI, at least 6 or 12 months of follow-up). Variables selected for the model based on clinical relevance were age, gender, pack years, calendar quarter in which PCI was done (because of higher quit attempts at the beginning of the calendar year), smoking ordinance variables, previous PCI or coronary artery bypass graft surgery, myocardial infarction (MI) within 24 hours before PCI, and cardiac rehabilitation (CR) participation. Landmark analysis was used to model the association between SC after PCI and long-term cardiovascular events. Patients who did not have at least 6 months of follow-up were excluded from the landmark analysis, and group affiliation was determined according to the 6-month phone call status. Cox proportional hazards models were used to estimate partial hazard ratios between quitting (vs continuing to smoke) with covariate adjustment for age; gender; recent MI before PCI; unstable angina; chronic heart failure at PCI; diabetes; hypertension; history of cholesterol ≥240 mg/dl, MI, PCI, coronary artery bypass graft surgery, peripheral vascular disease, stroke/transient ischemic attack, and tumor; the cardiovascular specific co-morbidity index (Sachdev index) ; multivessel disease; urgency of PCI; multivessel intervention; glycoprotein IIb-IIIa use; vessel location of intervention; and vein graft intervention. Breslow-Day test was used for testing the association between treatment and smoking status across time periods. Additional information regarding our research methods is available in the online supplement .
Results
There were exactly 18,000 PCIs at the St. Mary’s Hospital at the Mayo Clinic in Rochester, Minnesota, during the 10-year study period (1999 to 2009). In that group, we identified 2,453 unique patients (3,190 PCIs) who were Olmsted County residents. We excluded 145 patients who withheld consent to allow use of their records for research purposes. Of the remaining 2,308 patients, we used the first PCI during the study period for analysis only. Of these, 492 were current smokers at the time of PCI, 812 had never smoked, 1,002 were former smokers, and 2 had unknown smoking status and were excluded. There were no patients who reported starting smoking for the first time after their PCI. Median (with interquartile range, IQR) follow-up was 5.8 years (3.1, 8.6) and was 5.9 and 5.1 years in nonsmokers and smokers, respectively. The demographic and clinical characteristics of our sample of 2,306 patients who underwent first PCI from January 1, 1999, to December 31, 2009, are listed in Table 1 . Of these results, we need to underline that current smokers at the time of PCI were younger than nonsmokers (55.8 ± 10.7 years compared with 68.9 ± 12.3 years, p <0.001), but more differences were observed (see Table 1 ). Smokers were more likely than nonsmokers to have an emergent PCI (46% vs 26%, p <0.001), to present at the time of PCI with thrombus in any lesion (35% vs 54%, p <0.001), to have pre-PCI Thrombolysis In Myocardial Infarction score of 0 (38% vs 23%, p <0.001), and were less likely to have calcium in any stenosis (28% vs 36%, p <0.001). Some markers of cardiovascular risk increased over time in our study cohort during these 3 time periods (TP1, TP2, and TP3), including treated hypertension (65%, 71%, and 77%, respectively, p <0.001) and body mass index (29.1 ± 5.5 kg/m 2 , 29.6 ± 6.1 kg/m 2 , and 30.0 ± 6.1 kg/m 2 , p = 0.027). Drug-eluting stents were not used in any patients in the TP1 (before 2001) but were used in 55% of patients in the TP2 (2002 to 2006) and 71% in the TP3 (2007 to 2010) (p <0.001). A majority of patients in each time period were given glycoprotein IIb-IIIa at the time of PCI (70%, 66%, and 76%, for TP1, TP2, and TP3, respectively, p <0.001).
| Variable | Non-Smokers (n=1814) | Smokers (n=492) | P value |
|---|---|---|---|
| Age, years (mean, ± SD) | 68.9 (12.3) | 55.8 (10.7) | <.001 |
| Male | 1226 (68%) | 360 (73%) | 0.018 |
| Most recent Myocardial Infarction | <.001 | ||
| <24 hours | 509 (29%) | 234 (48%) | |
| 1-7 days | 236 (13%) | 76 (16%) | |
| > 7 days | 275 (15%) | 49 (10%) | |
| Never | 765 (43%) | 129 (26%) | |
| Diabetes mellitus | 444 (25%) | 91 (19%) | 0.005 |
| Hypertension | 1283 (74%) | 269 (59%) | <.001 |
| Smoking status | <.001 | ||
| Never | 812 (45%) | 0 | |
| Former | 1002 (55%) | 0 | |
| Current | 0 | 492 (100%) | |
| Prior Percutaneous Transluminal Coronary Angioplasty | 314 (17%) | 76 (15%) | 0.33 |
| Prior Coronary Artery By-pass | 288 (16%) | 36 (7%) | <.001 |
| Peripheral Vascular Disease | 166 (9%) | 45 (9%) | 0.97 |
| Stroke/Transitory Ischemic Attack | 230 (13%) | 40 (8%) | 0.005 |
| Chronic Obstructive Lung Disease | 187 (11%) | 75 (16%) | 0.003 |
| Sachdev index, median (Q1,Q3) | 1.0 (1.0, 3.0) | 1.0 (0.0, 3.0) | <.001 |
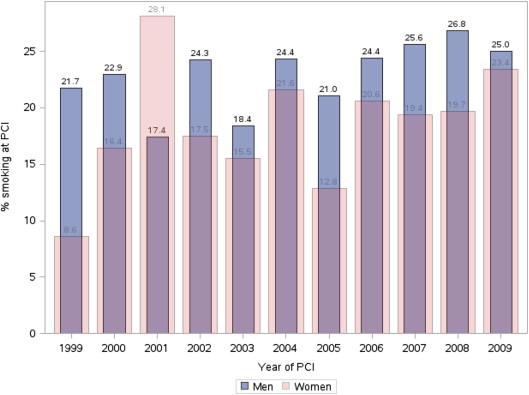
We observed a slight nonsignificant increase in smoking prevalence among PCI patients in TP3 compared with TP1 and TP2 (24% in TP3 compared with 20% in TP1 and 21% in TP2, p = 0.14). As listed in Table 2 , during the period 1999 to 2010, there was a decrease in smoking rates in Rochester, in Olmsted County, and in the state of Minnesota. Throughout the entire time period of this study, the percentage of current smokers among PCI patients was higher than the percentage noted in the general population of Rochester, Olmsted County, and Minnesota. Although men typically were more likely to be smokers at the time of PCI than women ( Figure 1 ), that trend was reversed in 2001 when 28% of women and 17% of men were smokers at the time of PCI (p = 0.006 for comparison with pooled data from other time periods).
| 1999 | 2000 | 2001 | 2002 | 2003 | 2004 | 2005 | 2006 | 2007 | 2008 | 2009 | 2010 | |
|---|---|---|---|---|---|---|---|---|---|---|---|---|
| Rochester | 11.0 | 12.5 | 11.8 | 12.5 | ||||||||
| Olmsted County | 20.0 | 20.4 | 19.8 | 21.7 | ||||||||
| Minnesota | 19.5 | 19.8 | 22.2 | 21.7 | 21.1 | 20.7 | 20.0 | 18.3 | 16.5 | 17.6 | 16.8 | 14.9 |
| USA | 23.3 | 23.1 | 22.6 | 21.5 | 20.8 | 20.8 | 19.7 | 20.6 | 20.6 | 19.9 |
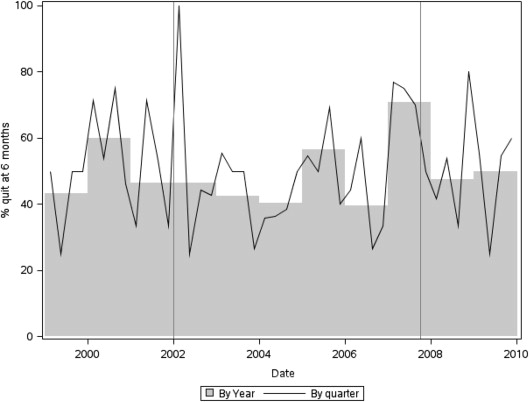
The 6-month smoking quit rate did not change significantly over the study period (50% in TP1 compared with 49% in TP2 and 49% in TP3, p = 0.82 for trend, unadjusted data). The 12-month quit rate also did not change significantly (48% in TP1, compared with 46% in TP2, and 56% in TP3, p = 0.38 for trend, unadjusted data). Rates of SC did not change significantly during the time periods after the enactment of smoke-free policies (see Figure 2 ).
Stay updated, free articles. Join our Telegram channel

Full access? Get Clinical Tree


