Transthoracic Echocardiography
Richard A. Grimm
James D. Thomas
Overview and History
Echocardiography (cardiac ultrasound) remains the most powerful diagnostic tool in cardiology (1). Although technically demanding, its diagnostic accuracy, cost effectiveness, availability, and noninvasive nature have made it the largest cardiovascular expense item in the Medicare budget.
Modalities of Echocardiography
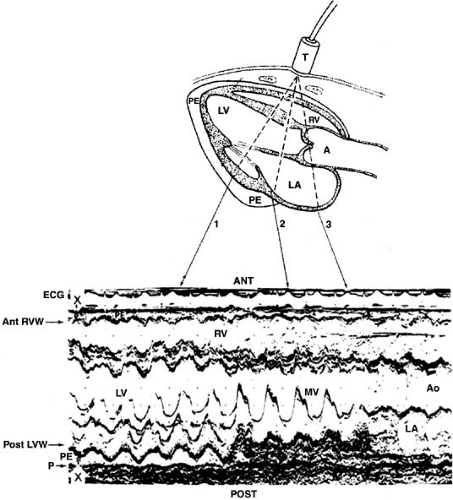
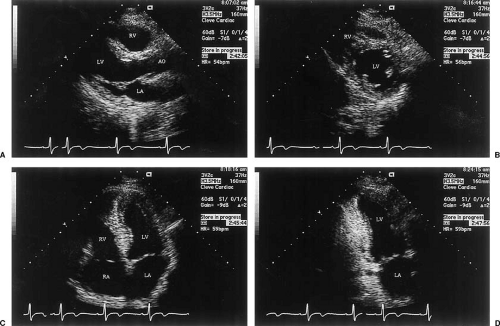
M-mode echocardiography was the first form of cardiac ultrasound (Fig. 49.1), in which a single beam is directed toward the heart and reflected signals are displayed on a strip chart or oscillograph at high data rates (200 Hz in most contemporary machines). Two-dimensional echocardiography (Fig. 49.2) is created by sweeping an ultrasound beam back and forth through an arc either mechanically or by phased-array transducer.
Echocardiographic Evaluation of the Ventricles
Left Ventricle
Left ventricular (LV) evaluation is probably the single most important clinical application of echocardiography. A combined M-mode, two-dimensional, and Doppler evaluation of the LV can provide reliable information about overall systolic function, regional wall motion, and ventricular mass and geometry (2).
Evaluation of Global Systolic Function
Reliable determinations of LV function require the qualitative and quantitative evaluation of images taken from several standard windows. Typically, the LV is first viewed in the parasternal long-axis and short-axis planes (Fig. 49.2). From these planes, M-mode tracings are generated. If quantitation of M-mode tracings is used clinically, the American Society of Echocardiography recommends obtaining these from the parasternal short-axis view in the two-dimensional M-mode image (3,4) (Fig. 49.3).
M-Mode Evaluation
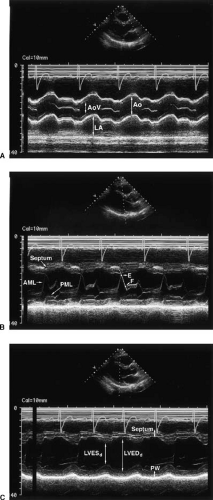
Standard M-mode measurements are shown in Figure 49.4. Fractional shortening by M-mode imaging is given by LV diameter at end diastole (LVEDd) minus LV diameter at end systole (LVESd)/LVEDd where EDd is the LV minor axis in diastole and ESd in systole. Normally, fractional shortening is approximately 50% and is considered clearly abnormal when it falls to less than 30% (5,6). Another M-mode measurement is the E-point septal separation (7,8), which is a marker of LV dysfunction when it exceeds 7 mm.
Apical Window Imaging
After the parasternal images, the LV is displayed along its long axis from the apical impulse location. The standard examination typically includes the apical four- and two-chamber views (orthogonal to each other, Fig. 49.2) and the apical long-axis
view (9,10).
view (9,10).
The four-chamber view (9) displays the midseptum and inferolateral LV wall as well as the right ventricle (RV) at its widest point, including the moderator band. At the cardiac base, the mitral valve (MV) and the tricuspid valve (TV) are shown, with the TV displaced approximately 1 cm more apically than the MV by the membranous septum. The atria are shown partitioned by the interatrial septum. Posterior transducer angulation reveals the coronary sinus and papillary muscles. Anterior angulation shows the LV outflow tract. To enhance endocardial definition, ultrasonic contrast agents that cross the lungs intact (unlike agitated saline contrast) can be used. Contrast augmentation is gained by displaying the second harmonic of the transmitted ultrasound carrier frequency.
The shape of a healthy LV is a truncated ellipsoid with the long axis roughly twice the length of the short axis. As the heart decompensates, it assumes a more globular shape (11). Diastolic wall thickness is viewed in absolute terms (approximately 1 cm is normal, >1.2 cm is considered hypertrophied) and relative to LV cavity size, with a radius-to-thickness ratio that is typically about 2:1. The distribution of hypertrophy is important. In secondary hypertrophy (e.g., from hypertension or outflow obstruction), the increase in wall thickness is uniform or concentric, whereas it is typically confined to the septum in asymmetric hypertrophy. Regional LV function is assessed by evaluating segmental thickening and wall excursion. Myocardial texture is also informative. Scar formation results in a thin bright segment, and infiltrative disease yields increased reflectance in approximately half of such cases. Geometric uniformity is another useful feature and becomes important after infarction. LV remodeling in its extreme form involves an entire region in an aneurysm that is distinguished from simple dysfunction by deformity throughout the cardiac cycle. Generally, all endocardial segments should move inward synchronously, with incoordinate contraction suggesting at least moderate LV dysfunction. However, dyssynchronous contraction can also be seen with left bundle branch block (12) or RV apical pacing. Finally, the longitudinal motion of the heart can be observed by the descent of the cardiac base (annular plane) toward the nearly fixed cardiac apex (13). A decrease in this parameter is often the first sign of nascent cardiomyopathy.
Quantitation of Left Ventricular Function
Although automated methods of measurement have been developed for assessing LV function (14), the standard method remains manual border tracing (15,16,17). Ejection fraction (EF) is commonly estimated by visual inspection, but this approach is prone to error and interobserver variability.
M-mode measurements of LV function (18,19,20,21) are limited because they use a single LV short-axis dimension, generally assuming a long-axis–to–short-axis ratio of 2:1 to extrapolate information to three dimensions. Unfortunately, many pathologic states introduce regional asymmetry or alter the ratio toward unity. Because volume is a cube function of dimension, errors are compounded. In contrast, two-dimensional volumes and mass compare favorably with those that are obtained from angiography and autopsy, but only if care is taken to optimize data acquisition and analysis (3).
The best apical images are obtained with the patient lying in the left recumbent position and during unforced suspended expiration. A foreshortened ventricle can be avoided by
maximizing the visualized long axis.
maximizing the visualized long axis.
The biplane method of disks (referred to less precisely as the modified Simpson rule) most closely predicts angiographic volumes (10,15,16,17). The single-plane area length is also suitable, provided the ventricle is symmetric (22) (Fig. 49.5). These algorithms are applied to orthogonal apical two- and four-chamber views. The apical four-chamber view (10) should display the true LV apex, by showing neither the aorta nor the coronary sinus while maximizing RV size. The two-chamber view should not include any portion of the RV, aorta, or right atrium (RA) (Fig. 49.2).
LV mass computed from two-dimensional images is more reproducible and anatomically more rational than with M-mode imaging but is still limited by relatively wide standard deviations (±35 g for 95% confidence intervals) (23). The truncated ellipsoid and area-length methods are both recommended by the American Society of Echocardiology for mass determination (3,24).
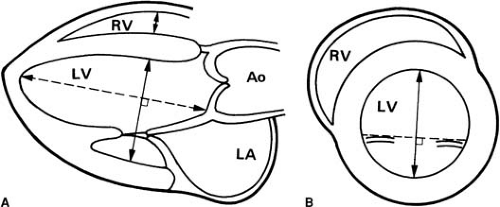 FIGURE 49.3. Quantitation of left ventricular size. Measurement sites recommended by the American Society of Echocardiography. A: Parasternal long-axis view. B: Parasternal short-axis view. Ao, aorta; LA, left atrium; LV, left ventricle; RV, right ventricle. (From reference 3.) |
Wall Thickness and Left Ventricular Mass
Hypertrophy is defined anatomically as an increase in the mass of the ventricular myocardium, but wall thickness often serves as its surrogate. Initially obtained from M-mode imaging (25), wall thickness is usually determined from two-dimensional images with normal values from 0.6 to 1.1 cm. Wall thickness should be measured at the onset of the QRS complex (rather than in diastasis), because atrial contraction may thin the wall considerably. Analogously, if filling volume is greatly reduced (e.g., in cardiac tamponade), the wall becomes thickened despite normal mass, and a dilated ventricle may have increased
mass with normal thickness. To overcome the shortcomings of simple wall thickness, actual mass can be estimated. However, M-mode formulas (18,26,27,28) suffer the same theoretic limitation as the cube method of estimating LV volume, especially in hearts with asymmetric thickening (29). Despite this, the Framingham Heart Study has used M-mode methods to yield valuable insight into the electrocardiographic (ECG) criteria for hypertrophy (27,30,31) and the adverse prognosis of ventricular hypertrophy (32).
mass with normal thickness. To overcome the shortcomings of simple wall thickness, actual mass can be estimated. However, M-mode formulas (18,26,27,28) suffer the same theoretic limitation as the cube method of estimating LV volume, especially in hearts with asymmetric thickening (29). Despite this, the Framingham Heart Study has used M-mode methods to yield valuable insight into the electrocardiographic (ECG) criteria for hypertrophy (27,30,31) and the adverse prognosis of ventricular hypertrophy (32).
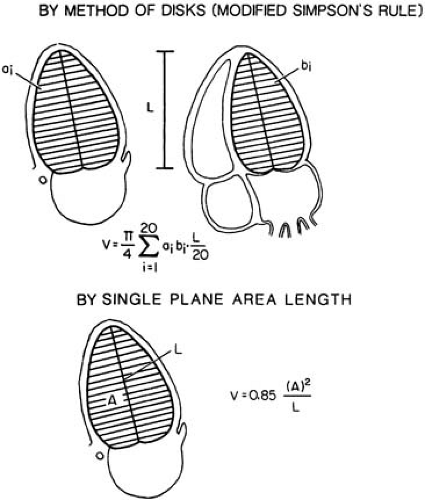 FIGURE 49.5. Left ventricular (LV) volume determination. The biplane method of disks (top) requires orthogonal two- and four-chamber apical views and is more accurate in asymmetric hearts than the single-plane method shown at the bottom. In symmetric ventricles, the single-plane method is almost as accurate as the biplane method. (From reference 3.) |
Most two-dimensional methods for determining LV mass (3,23,24,33) are similar because they combine a short-axis estimation of wall thickness with an estimation of ventricular length. The difference between the endocardial and epicardial volumes multiplied by the specific gravity of myocardium (1.05 g/mL) yields myocardial mass. Even two-dimensional methods have relatively wide 95% confidence bounds (±25 g) (23,33,34).
Two-Dimensional Echocardiography in Ischemic Heart Disease
Myocardial infarction produces regional akinesis within seconds of coronary occlusion. The presence of scarring (thinning and increased brightness) indicates an old infarction. The interface between contracting and akinetic tissue forms a visually distinctive “hinge point.” The diffuse hypokinesis of ischemic cardiomyopathy can be difficult to distinguish from primary myocardial disease.
To localize segmental wall motion abnormalities in a standardized format, the American Heart Association has recommended dividing the ventricle into 17 segments (35). Grading of these segments generates a wall motion score index that has been shown to have prognostic value (36). A diastolic deformity, sharply demarcated, indicates aneurysm formation. Hypokinesis without wall thinning suggests ischemia rather than completed infarction, but the specificity of this is not high.
Echocardiography is valuable in the assessment of chest pain (37,38,39,40,41), because a normal echocardiogram makes cardiac ischemia unlikely. The reliability and speed in detecting ischemic hypokinesis have led to the use of echocardiography in conjunction with exercise and pharmacologic stress testing (see Chapter 50).
Echocardiography is valuable in the assessment of chest pain (37,38,39,40,41), because a normal echocardiogram makes cardiac ischemia unlikely. The reliability and speed in detecting ischemic hypokinesis have led to the use of echocardiography in conjunction with exercise and pharmacologic stress testing (see Chapter 50).
Complications of Myocardial Infarction: Recognition by Echocardiography
Many of the complications of myocardial infarction can be diagnosed by a bedside echocardiogram. LV thrombi occur frequently in the setting of extensive anteroapical infarction and rarely in inferior infarction. They can appear within days of the infarction and typically are highly mobile. Older thrombi tend to have smooth surfaces and a texture like liver, and they may have a layered appearance. The more mobile and irregular the surface of the thrombus, the higher is the risk of embolization (42,43,44,45). Thrombi can be difficult to differentiate from apical trabeculations, which may be pronounced in cardiomyopathy (46).
Postinfarction aneurysms are characterized by a wall motion abnormality with a diastolic deformity. The ability of echocardiography to delineate aneurysm is well described (47,48,49).
Pseudoaneurysms, which result from frank wall rupture or cardiorrhexis, are actually composed of pericardium, which confines the rupture. Because only small ruptures in the wall are compatible with survival, pseudoaneurysms tend to have narrow necks, in contrast to the more open neck of true aneurysms (see Chapter 105). Pseudoaneurysms typically form at the inferoposterior base of the heart, are usually accompanied by pericardial effusion (50), and carry a poor prognosis if they are not repaired.
Abrupt myocardial rupture into the pericardial sac is rapidly fatal, although slower accumulations can allow time for surgery. Most postinfarction pericardial effusions are the result of either local inflammation (early) or Dressler syndrome (late). The incidence of pericardial effusions has ranged from 6% (51) to 37% (52) after infarction, and the correlation with physical signs of pericarditis is poor. Ventricular septal defect is a contained cardiorrhexis (53,54,55,56,57), typically at the anteroapex for left coronary infarction and the inferior base for right coronary infarction.
Mitral regurgitation (MR) is regularly encountered as a periinfarction complication (11,53). Papillary muscle rupture is always disabling and may be rapidly fatal (58,59). Because of cross support of the chordae, free motion of the liberated papillary muscle can sometimes be inapparent. Therefore, any patient with severe heart failure and unexpectedly good ventricular function after infarction should have papillary muscle rupture considered. Less severe MR is also commonly seen after myocardial infarction, typically owing to the abnormal wall motion displacing or undermining the papillary muscle (see Chapter 51).
RV infarction can be seen in approximately 40% of inferior infarctions (60,61), with injury ranging from subclinical depression to severe RV dysfunction causing a low-output state with high mortality. RV infarction is characterized by ventricular enlargement, decreased descent of the base, and inferior vena cava (IVC) plethora (60,61). Elevation of right-sided filling pressures can cause right-to-left shunting through a patent foramen ovale and can be easily documented by the passage of saline microbubbles across the interatrial septum.
Cardiomyopathies: Their Recognition by Echocardiography
Dilated, hypertrophic, and restrictive cardiomyopathies can be characterized by two-dimensional echocardiography. Congestive cardiomyopathy shows spheric cavitary dilatation (LV volume often >250 mL), normal wall thickness, and poor wall thickening and endocardial motion. M-mode echocardiography displays MV septal E-point separation, poor MV and aortic valve (AV) opening, and decreased systolic aortic root motion. Involvement of the right side of the heart is important because it implies pulmonary hypertension and RV cardiomyopathy, which independently worsen prognosis (62,63). In spite of an EF of less than 30%, cardiac output (stroke volume × heart rate) may be normal because of tachycardia and the large end-diastolic volume.
Early signs of cardiomyopathy are a decrease in the descent of the cardiac base (13), an increase in sphericity (13), and a rise in end-systolic volume index (64,65). This latter value is highly useful in detecting early cardiomyopathy because the end-systolic volume tends to be more sensitive to contractility than the preload volume (22). An end-systolic volume index that exceeds 30 mL/m2 indicates significant global dysfunction. In a study of valve disease, patients whose end-systolic volume index exceeded 60 mL/m2 (64) had a much poorer outcome than did other patients. Similarly, in ischemic cardiomyopathy, the value of 45 mL/m2 segregates patients with poor outcome.
Hypertrophic Cardiomyopathies
Primary hypertrophic cardiomyopathies are characterized by increased LV mass without apparent cause, such as hypertension or aortic stenosis (AS), and they can be asymmetric or symmetric (66,67,68,69). In asymmetric septal hypertrophy (ASH), the increased wall thickness is typically localized in the basal septum (67), and although it is clearly heritable, there is variable expressivity among affected family members. An unusual variation of ASH is apical hypertrophy (so-called Yamaguchi disease) (70,71). When dynamic outflow tract obstruction accompanies ASH, hypertrophic obstructive cardiomyopathy is present (72,73,74). Findings that are consistent with obstruction may be noted echocardiographically at rest or with provocation by amyl nitrite, exercise, or inotropic stimulation (66). Fully developed hypertrophic obstructive cardiomyopathy consists of ASH, systolic anterior motion of the MV, crowding of the LV outflow tract by the MV apparatus and septum, partial midsystolic closure or notching of the AV, and MV annular calcification.
Stay updated, free articles. Join our Telegram channel

Full access? Get Clinical Tree


