FIGURE 9.1. A stylized map of the main extracranial arteries (in blue), which will be considered inflow vessels, and the intracranial vessels (in green), which will be considered outflow vessels for the purposes of this chapter. (Copyright © Sheila Raynor.)
Circle of Willis
The anterior and posterior circulations are linked together by small connecting vessels, the single anterior communicating artery (ACoA) and a posterior communicating artery (PCoA) on each side; this unique structure is called the circle of Willis. These small connecting vessels form a link between separate flow systems in the brain—the anterior and posterior circulations via the PCoAs and the right and left hemispheres via the ACoA. This arrangement provides backup blood flow delivery should one or more of the contributing arteries become diseased. Although the circle of Willis appears to be an effective system for maintaining constant blood flow, less than half of the human population has a complete circle of Willis.3 The communicating arteries are frequently hypoplastic or absent, so the shunting of blood flow from one artery to another may be ineffective in times of need. It is difficult to determine the completeness and the capacity of the circle of Willis to supply collateral flow without carotid compression maneuvers; therefore, it is rarely assessed without a compelling indication.
Flow rates in the communicating arteries are normally small but sufficient to keep these vessels active. The flows arise from pressure phase delays between the right and left sides of the circle of Willis, which are the consequence of the asymmetry introduced by the brachiocephalic artery. Because the volume flow rates along these arteries are normally about two orders of magnitude smaller than the volume outflow rates in the other cerebral arteries,9 even magnetic resonance angiography (MRA) techniques may not be able to detect the presence of the communicating arteries in subjects with a complete circle of Willis or with anatomic variations involving these arteries. The most frequent anatomic variations reported in Lippert and Pabst3 are shown in Figure 9.2.
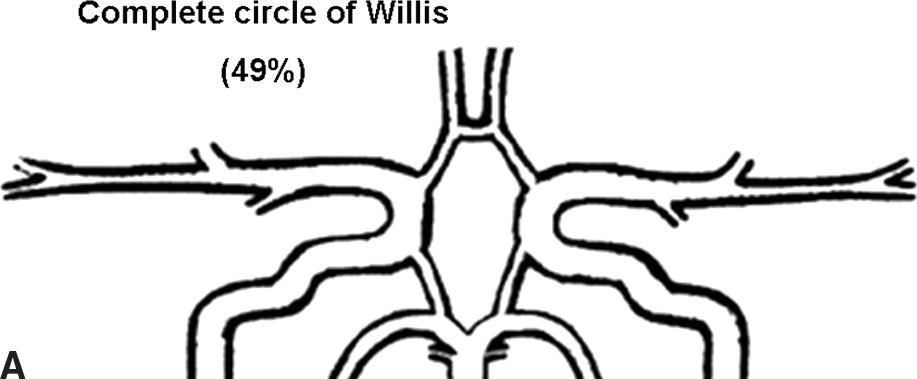
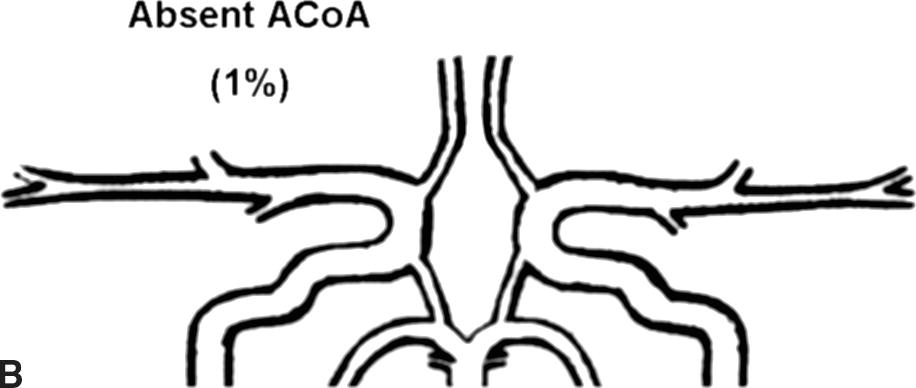
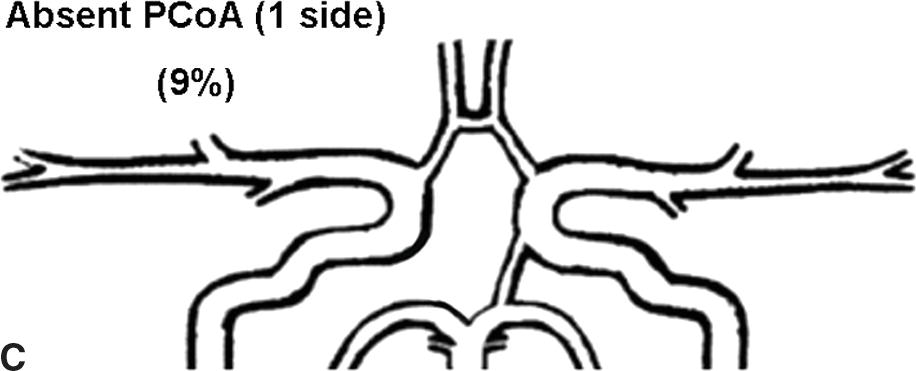
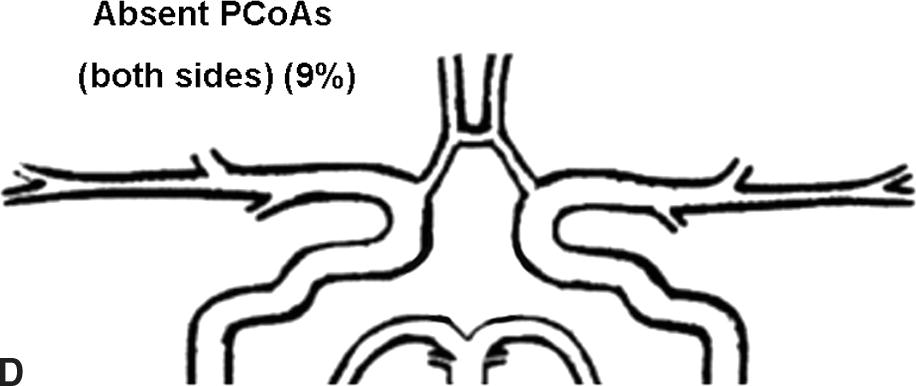
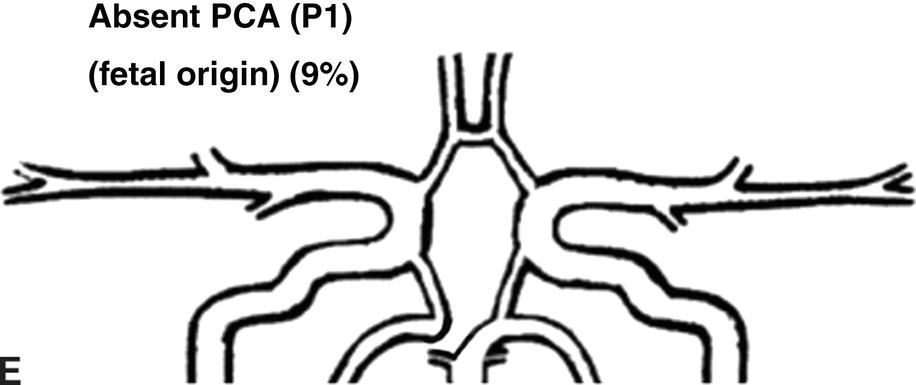
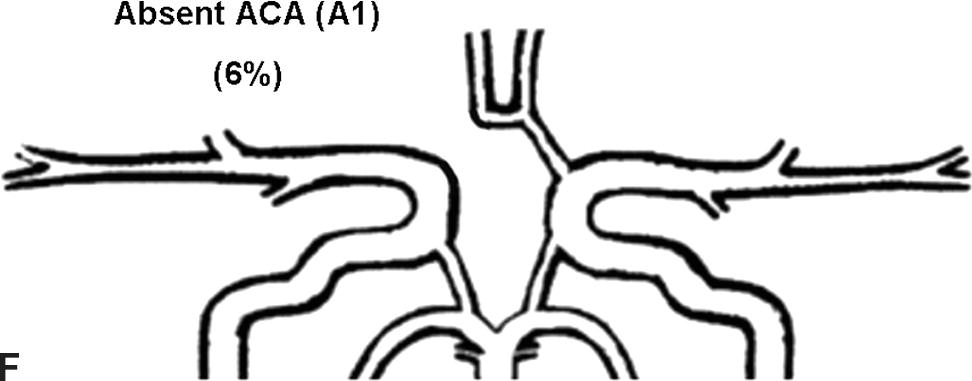
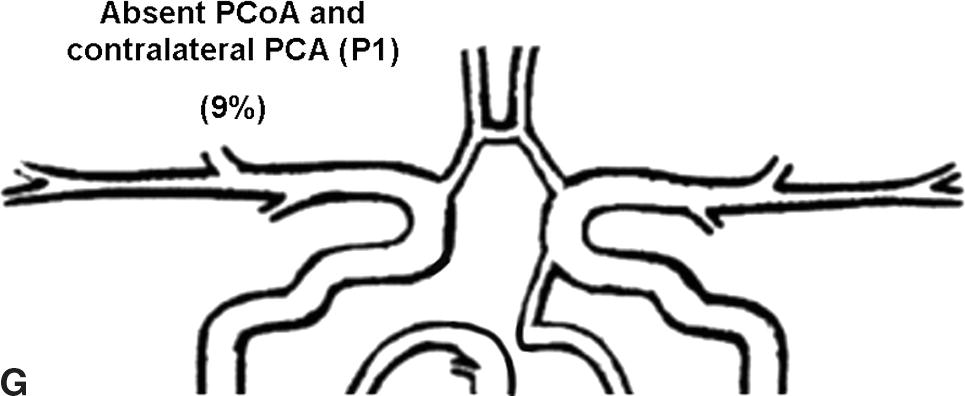
FIGURE 9.2. A-G, Anatomical variations of the circle of Willis.
For each case, the absent artery and its frequency are indicated, according to Lippert H, Pabst R. Arterial Variations in Man: Classification and Frequency. Munich: JF Bergmann, 1985 (depicted on only one side, but it can also be absent on the other side).
INTERPRETATION
Step 1. Goals of the Examination
For patients with extracranial carotid stenosis, the main goals of the TCI examination are to detect the presence or absence of collateral flow, determine the pathways of collateral flow (this may prove important for surgical planning or intervention), comment on the symmetry of the MCA velocities between hemispheres, and in some cases, relate the findings to established normal ranges. The TCI examination can also identify significant stenoses in the intracranial cerebral arteries. This information is meant to give the clinician an indication of how well the patient is or is not compensated for the inflow disease. Whether intracranial collateral flow is present or absent is largely determined by the hemodynamic effects of the extracranial carotid stenosis.
Step 2. Flow Velocities
There are well-established normal values for TCD flow velocities in the basal cerebral vessels, as listed in Table 9.1.10–13 These cerebral vessels have a consistent flow velocity relationship to each other. The MCA velocity is usually the highest because the majority of blood from the ICA flows directly into the MCA territory. The ACA and PCA supply less brain tissue, so their flow velocities are lower. This results in the important relationship of MCA > ACA > PCA = BA for the relative flow velocities. Recognizing this relationship is the first step in the interpretation of TCI studies. Mean Doppler flow velocities (time-averaged peak velocities) are generally used in TCI. These are often provided directly by the ultrasound machine, but they can also be calculated from peak systolic velocity (PSV) and end-diastolic velocity (EDV) using a simple equation similar to that for mean arterial blood pressure.
TABLE 9.1 Normal Values of Mean Blood Flow Velocity for the MIDDLE CEREBRAL ARTERY, ANTERIOR CEREBRAL ARTERY, POSTERIOR CEREBRAL ARTERY, AND BASILAR ARTERYa
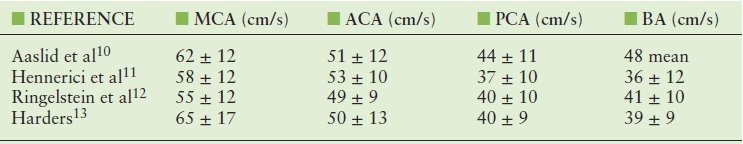
aValues are given as mean velocity ± standard deviation.
ACA, anterior cerebral artery; BA, basilar artery; MCA, middle cerebral artery; PCA, posterior cerebral artery.

Flow velocities show a consistent decrease with increasing age.14 These findings correlate well with age-related studies of CBF.15 This supports the validity and sensitivity of TCD to estimate changes in CBF based on velocity data.
In nonimaging TCD studies, velocities are acquired at a zero-degree Doppler angle. However, because of the tortuosity of the intracranial vessels and the lack of an image, this angle is only an assumption, and measurements are realistically acquired between 0 and 30 degrees. Because nonimaging TCD was the original study method in the 1980s, the majority of published data are based on these assumptions with regard to Doppler angle. When TCI became available, the technologist had the option to angle correct. Although this is a topic of ongoing debate, many vascular laboratories using TCI continue to leave the Doppler angle set at zero degree so their results can be compared with data reported in the literature.
Step 3. Side-to-Side Comparisons
Although it is useful to compare TCI findings from a specific patient with published values, the most helpful comparisons are often within an individual. Comparison of the right and left MCAs, right and left ACAs, and right and left PCAs often gives a better idea of what the “normal” values are for that individual, because heart rate, blood pressure, and cardiac output are all matched. A patient referred for a TCI examination will often have extracranial pathology that affects interpretation of the intracranial findings. For example, in unilateral extracranial ICA stenosis, the downstream effects of a diseased side can be compared with a normal side.
Step 4. Hemodynamics and Indices
Before beginning a TCI examination, it is helpful to know whether to expect evidence of collateral flow based on simple hemodynamic principles. Figure 9.3 reviews the dynamics of an arterial stenosis. In a mild or moderate stenosis, there is a slight increase in velocity (dashed white line) through the stenosis but then a normalization of velocity distal to the stenosis, because very little energy is lost. If we look at the corresponding change in pressure (dashed green line), there is a mild decrease through the stenosis but a recovery of pressure distally. In effect, this indicates that the inflow to the cerebral circulation should be relatively unaffected by mild or moderate stenoses. In this situation, a TCI examination may not demonstrate any collateral flow patterns.
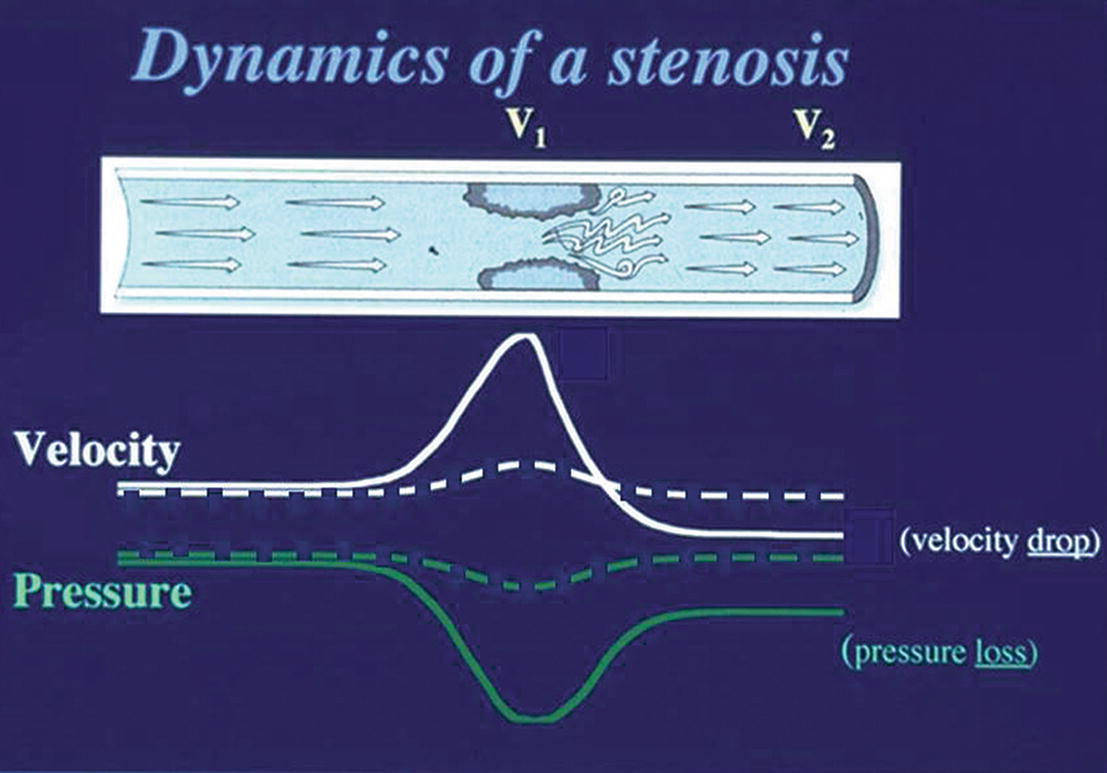
FIGURE 9.3. Changes in velocity (white lines) and associated changes in pressure (green lines) through a focal stenosis. The dashed lines represent changes through a mild or moderate stenosis; the solid lines represent changes associated with a severe stenosis. V1 is the stenotic site; V2 is the poststenotic segment.
Some clinicians have questioned whether TCI adds any valuable information at lower levels of carotid stenosis. However, even at lower levels of stenosis, it can be useful to evaluate the symmetry or asymmetry between the right and the left hemispheres, because there may already be vasodilatory mechanisms activated to maintain CBF at a constant level. In this case, measuring a parameter such as pulsatility index (PI), resistance index (RI), or mean RI may show subtle changes that would otherwise go undetected. Indices have indeed been a major part of TCD interpretation in the past. They are thought to provide indirect information about the small regulatory vessels that are inaccessible by TCI but play an important role in maintaining CBF at a constant level. The two major historical indices: PI16
and RI17

are found throughout the literature on TCD.18 The introduction of these indices was originally based on the assumption of interplay between resistance and compliance of the vascular bed. The accuracy and tendency of these two indices are nearly identical in most clinical applications, and both indices seem to change with alterations in vasomotor tone seen in vasomotor reserve testing.19 Because the cerebral conduit vessels such as the MCA are relatively stiff, we assume that the cerebral arterial compliance is practically negligible, and therefore, the indices must represent changes in resistance. The problem with using PI or RI is that changes in resistance are often small and can be overshadowed by changes in cardiovascular factors such as blood pressure. Therefore, subtle changes in central factors may influence the PI or RI without the investigator being aware of such influence.
A recently derived parameter, the mean RI, could also prove useful.20

This index includes one of the major cardiovascular influences (blood pressure) in conjunction with flow velocity. Although systemic blood pressure is not often recorded during TCI examinations, it should become a more common part of the examination because it can aid in interpretation of relative changes. Of note, mean RI should not be confused with the term cerebral vascular resistance (CVR), which is calculated as the ratio of cerebral perfusion pressure (CPP) to CBF:

where CPP equals the mean arterial blood pressure minus the intracranial pressure. This ratio cannot be calculated from TCD ultrasound velocity measurements; however, the mean RI is an indicator of cerebral resistance, which can be derived from velocity data and does consider the effects of changes in mean arterial blood pressure on the flow velocities.
These indices are generally calculated only on the most distal velocity measurement taken from the MCA trunk in order to look for indirect evidence of vasodilatation or vasoconstriction of the downstream distal vascular bed. Indices are a useful way of showing differences in waveform shape in numeric terms. For example, if the PI for the MCA on the unaffected side is 1.0 whereas the PI for the MCA on the stenotic side is 0.5, this would reflect an important difference in the waveform shape and indicate an asymmetry between the hemispheres.
Step 5. Detection of Stenosis
As with stenosis in the extracranial carotid arteries, intracranial arterial stenosis is associated with characteristic changes in the normal flow pattern: a focal velocity increase, localized turbulence, and a poststenotic decrease in velocity (Fig. 9.4). Slow systolic acceleration and decreased pulsatility may be observed in the spectral waveform distal to the stenosis, and a Doppler bruit may be present. Since many factors other than the presence of a stenosis influence the velocity of flow in the cerebral arteries (hematocrit, blood volume, blood pressure, cardiac output), absolute velocity thresholds for identifying intracranial arterial stenosis may not be reliable. In general, a focally increased mean velocity of ≥80 cm/s with a decrease of more than 30 cm/s distally is suggestive of a 50% or greater stenosis in the MCA. Higher velocity thresholds, such as ≥100 cm/s or ≥120 cm/s, provide a higher positive predictive value for 50% or greater MCA stenosis.21–23 Whenever the previously described normal velocity relationship of MCA > ACA > PCA = BA is disrupted, an abnormality in the basal cerebral arteries should be suspected. Globally high or low flow states may be present. Hyper-dynamic flow is common in younger patients and has been observed with traumatic head injury. Increased velocities in the intracranial arteries can also occur in response to collateral flow and arteriovenous malformations, although in these cases, the velocity increase is typically not focal but is present throughout the involved arterial segments (Fig. 9.5). Diffusely increased velocities occur with vasospasm associated with subarachnoid hemorrhage, and mean velocities of up to 250 cm/s and higher have been observed in that setting. Mean velocity criteria for grading MCA stenosis associated with vasospasm include mild stenosis (>120 cm/s), mild to moderate stenosis (120–150 cm/s), moderate stenosis (150–200 cm/s) and severe stenosis (>200 cm/s).24
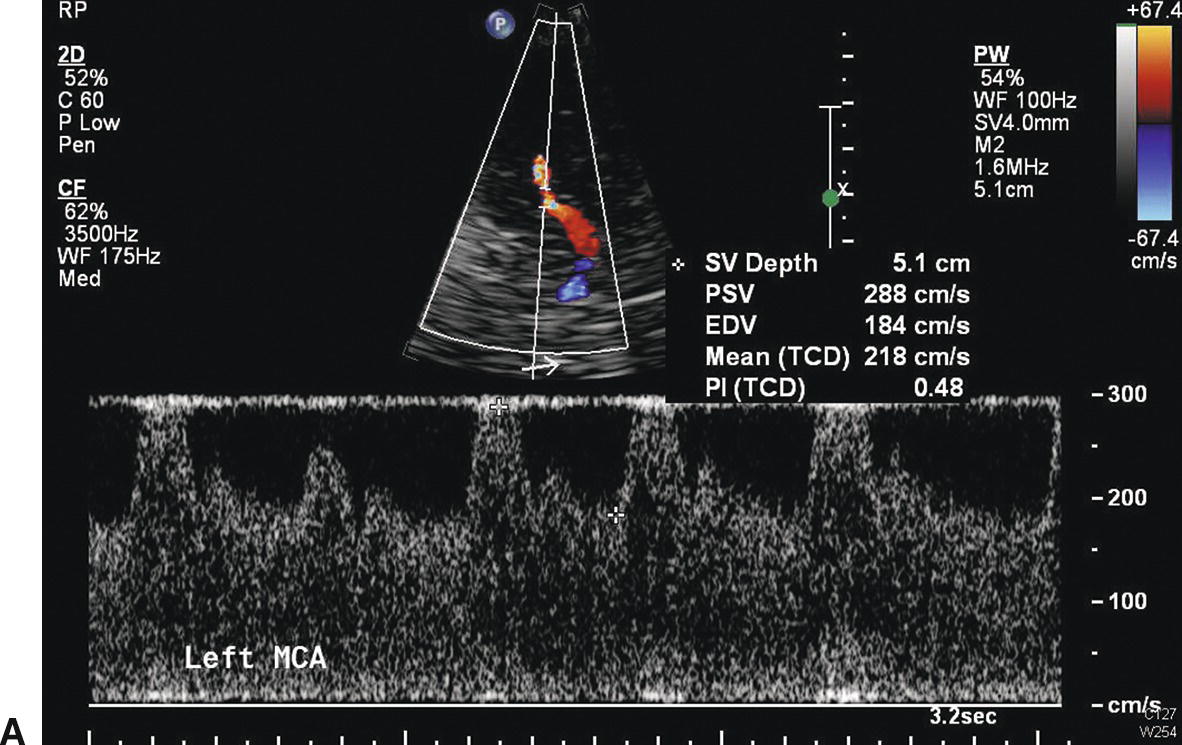
FIGURE 9.4. Velocity waveforms from a stenosis in the middle cerebral artery (MCA). A,Waveform taken at the site of the stenosis shows increased systolic and diastolic velocities, with a mean velocity of 218 cm/s. B,Waveform taken distal to the site of stenosis shows decreased velocities with a mean velocity of 72 cm/s. The flow pattern also shows poststenotic turbulence and a Doppler bruit.
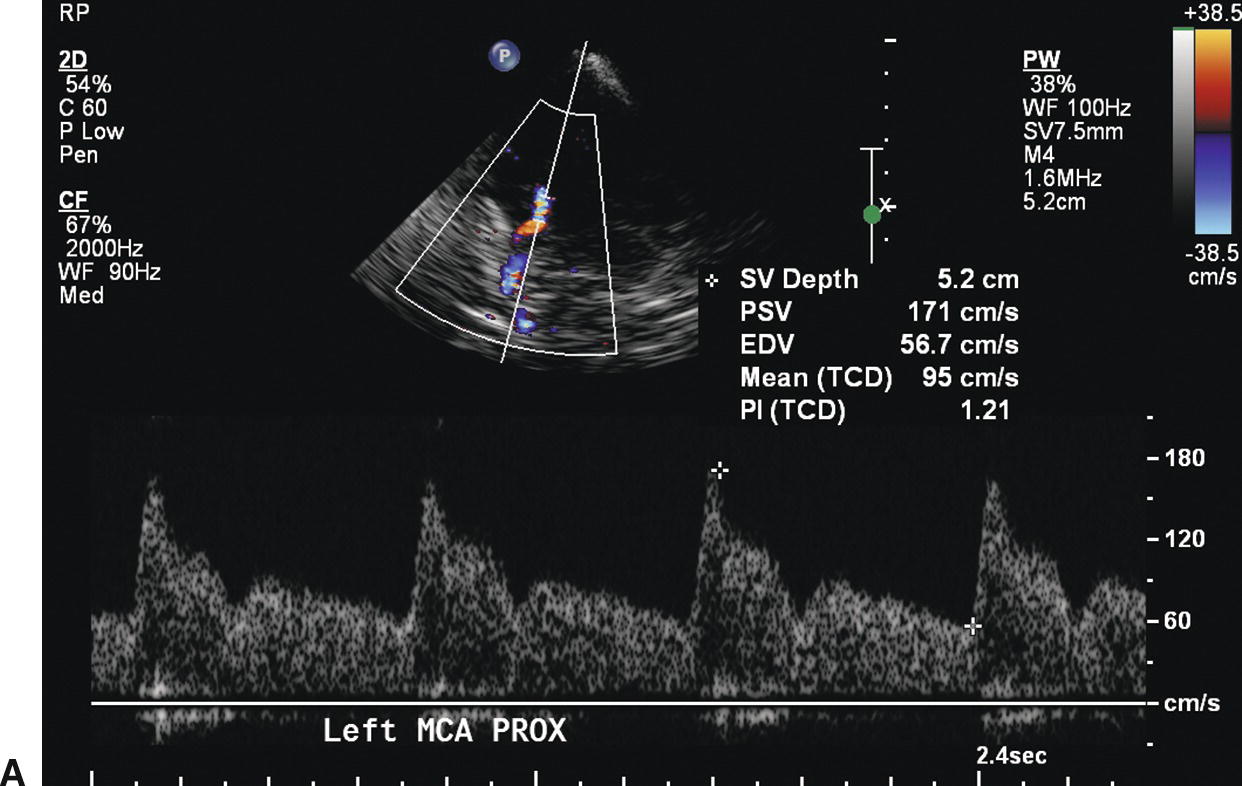
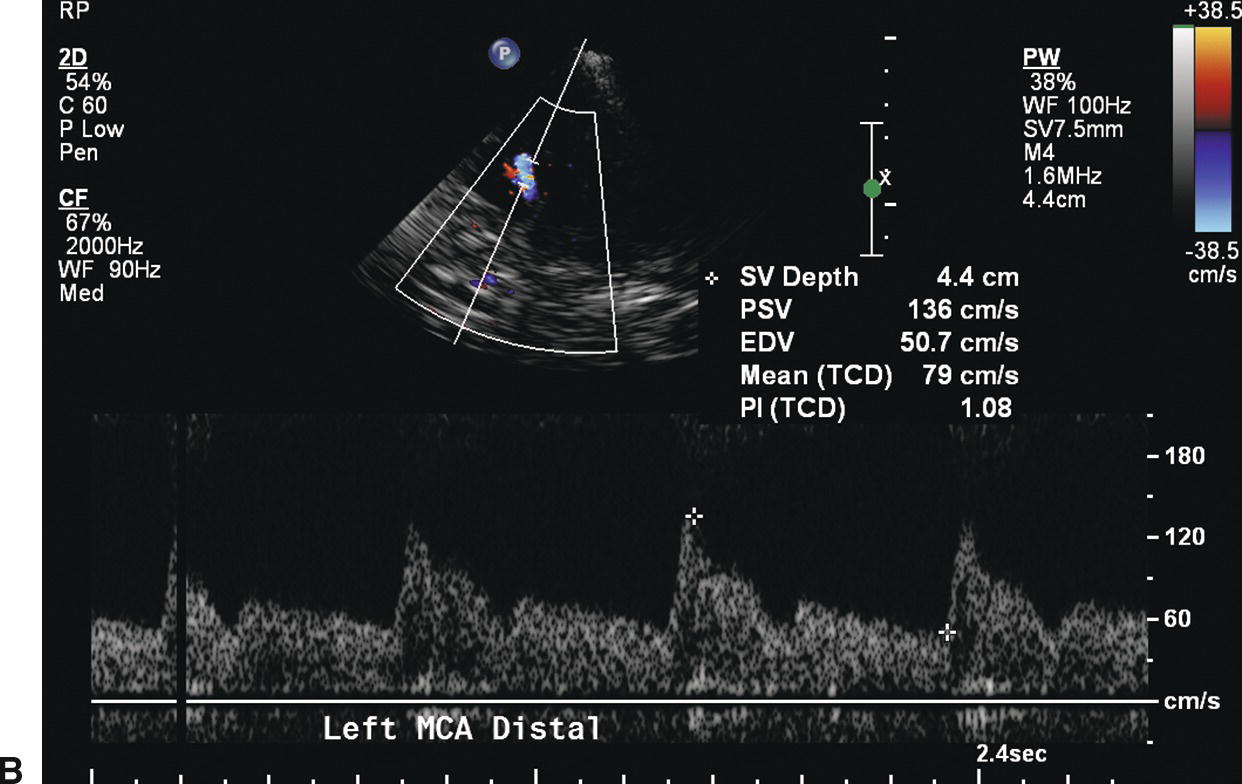
FIGURE 9.5. Velocity waveforms from a middle cerebral artery (MCA) with diffusely increased velocities but no focal flow disturbance. A,Waveform from the proximal MCA shows increased systolic and diastolic velocities, with a mean velocity of 95 cm/s. B,Waveform from the distal MCA shows a similar normal flow pattern with a mean velocity of 79 cm/s.
Step 6. Collateral Flow Patterns
In contrast to a mild or moderate lesion, when a severe extracranial arterial stenosis is present, there are more dramatic hemodynamic consequences. As shown in Figure 9.3, in a severe arterial stenosis the velocity (solid white line) shows a marked increase through the stenosis and a drop beyond the stenosis. The corresponding change in pressure (solid green line) shows a significant drop through the stenosis, but only a partial recovery beyond the stenosis. In this scenario, a significant pressure gradient develops between the right and left extracranial inflow vessels and the intracranial outflow vessels of the cerebral circulation. At this critical level, the rerouting of flow will occur very quickly through the collateral pathways. However, the specific path is determined largely by the configuration of the circle of Willis and the status of the communicating arteries (anterior and posterior). Therefore, when a significant extracranial carotid stenosis is present, TCI studies yield invaluable clinical information.
As mentioned previously, differentiating the high velocities associated with collateralization (compensatory flow) from the high velocities associated with a focal stenosis is a potential interpretation pitfall (Figs. 9.4 and 9.5). Keep in mind that the comparatively high flow velocities in collateral channels will be found throughout all collateral pathways from the aortic arch branches to the brain. These elevated velocities are due to increased flow volume and show little resemblance to the changes produced by a focal stenosis. The inflow/outflow cerebrovascular map is useful in this context because it enables the user to view the entire network and anticipate in what vessels they may expect increased velocities from compensatory flow.
Alastruey et al9 developed a computer model of pressure and flow wave propagation in compliant vessels from the left ventricle to the largest arteries that supply the circle of Willis. These authors evaluated the collateral function of a “complete” circle of Willis and its most frequent anatomic variations under normal conditions and after occlusion of an ICA or vertebral artery (VA). Their research suggests that the system does not require collateral pathways through the communicating arteries to adequately perfuse the brain of normal subjects. They also showed that the ACoA is a more critical collateral pathway than the PCoAs if an ICA is occluded. Occlusions of the VAs proved to be far less critical than occlusions of the ICAs. The worst scenario, in terms of reduction in mean cerebral outflow, is a circle of Willis without the first segment of an ACA combined with an occlusion of the contralateral ICA and a missing PCoA.
Identification of the presence or absence of collateral flow patterns is based on a few basic principles:
- Comparison of TCI flow velocity measurements acquired during the examination with the key relationship model MCA > ACA > PCA. If, for instance, the ACA velocity was greater than the MCA and PCA, this may represent collateral flow through the ACA. If the velocity in the first segment of the PCA (P1) was elevated above the MCA and ACA, this could indicate collateral flow coming through the PCA into the anterior circulation.
- Comparison of findings with the normal flow directions for each artery in the nondiseased state. Because the cerebral arteries (except the MCA) can change their flow direction to shunt collateral flow to an ischemic territory, prior knowledge of the normal flow directions of arteries in the intracranial circulation is essential.
- Understanding of the approximate depth at which each artery should be found, along with its placement in relation to anatomic landmarks such as the sphenoid wing, petrous ridge, midline (falx), or cerebral peduncles, is critical to accurate vessel identification.
- Knowledge of the main collateral pathways. Being aware that the blood flow will move along the path of least resistance, for example, through a large ACoA rather than through a small PCoA.
There are three major collateral pathways that will be reviewed in the context of a significant stenosis or occlusion of an ICA: intracranial crossover, posterior to anterior, and external to internal. General TCI findings are noted both through a schematic diagram and also in reference to TCI images.
Intracranial Crossover via the ACoA
With intracranial crossover, blood is shunted from the unaffected carotid system to the stenotic side through the ACoA (Fig. 9.6A). This appears to be the first collateral pathway to be recruited because it is generally the path of least resistance, but it is dependent on the presence and diameter of the ACoA. The amount of flow that can pass through the ACoA is directly proportional to the caliber of this vessel. The best identifying feature of intracranial crossover is a 25% higher velocity in the ACA contralateral to the ICA lesion compared with the MCA, as shown in Figure 9.6.
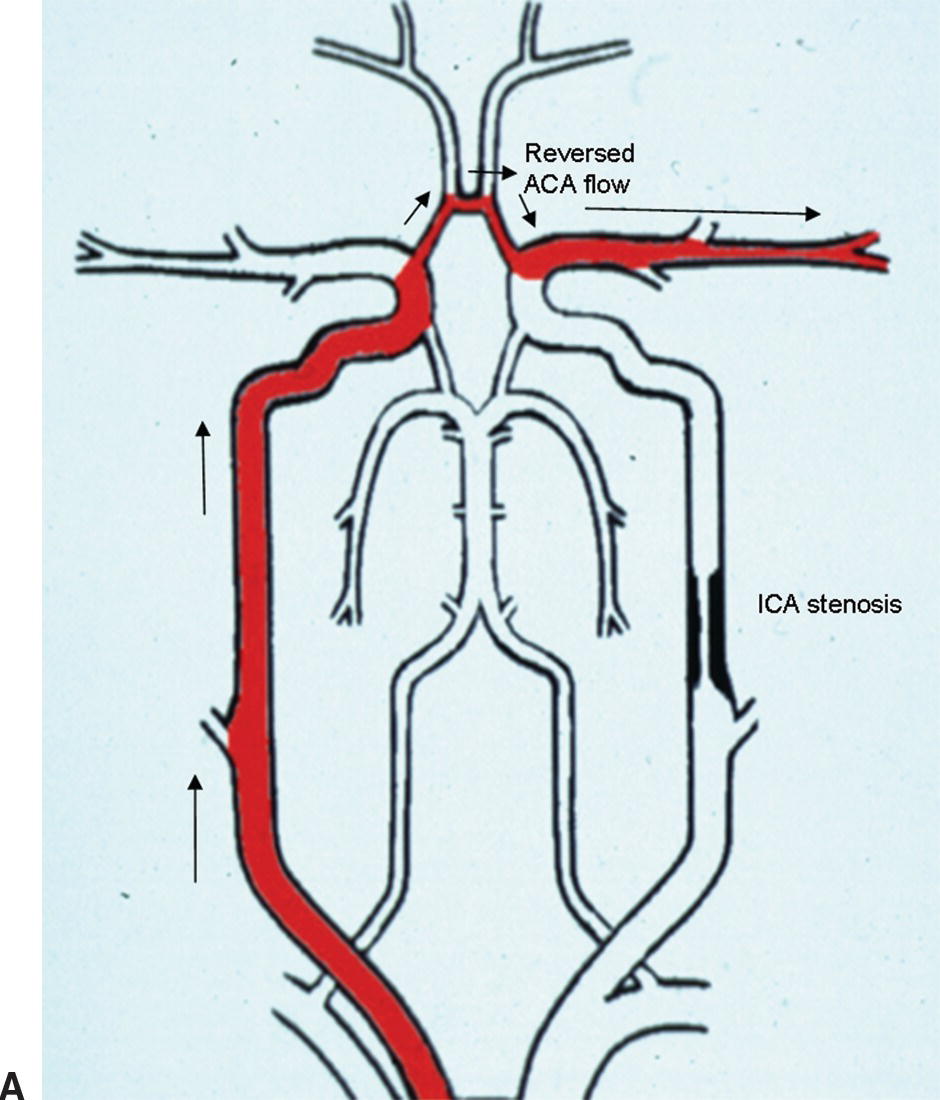
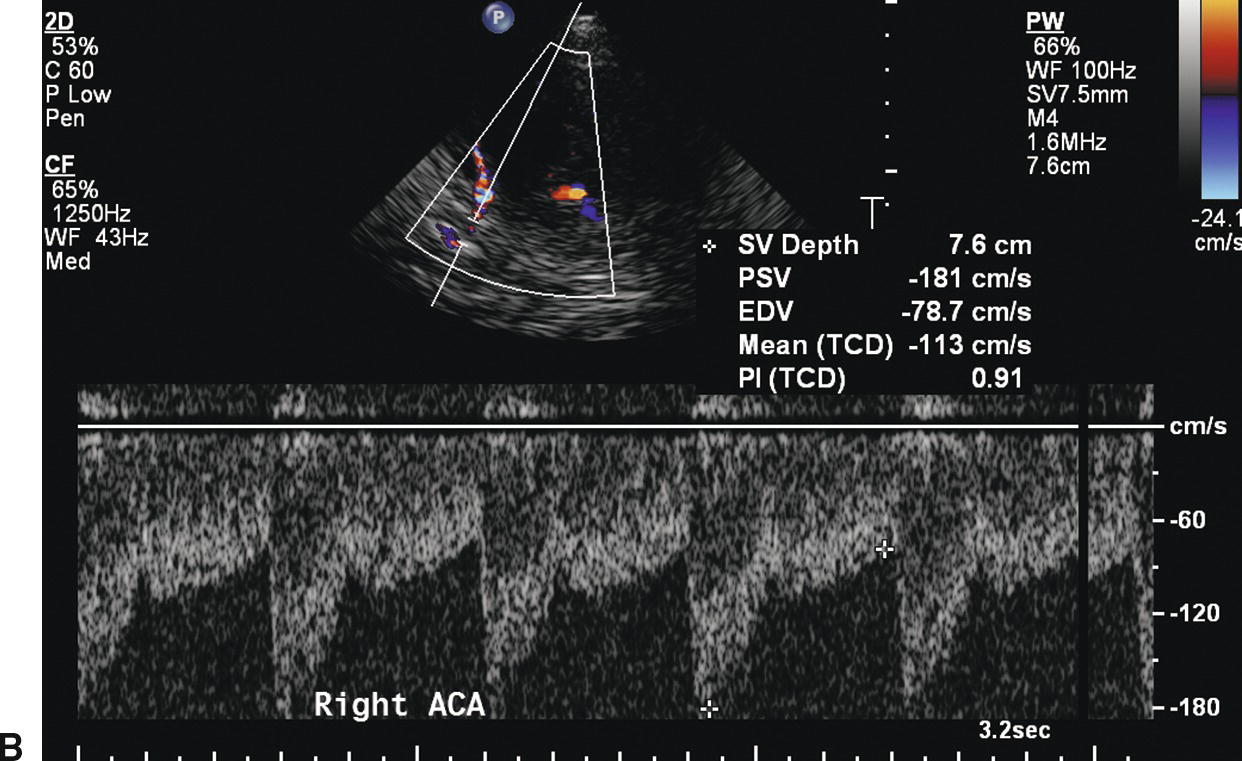
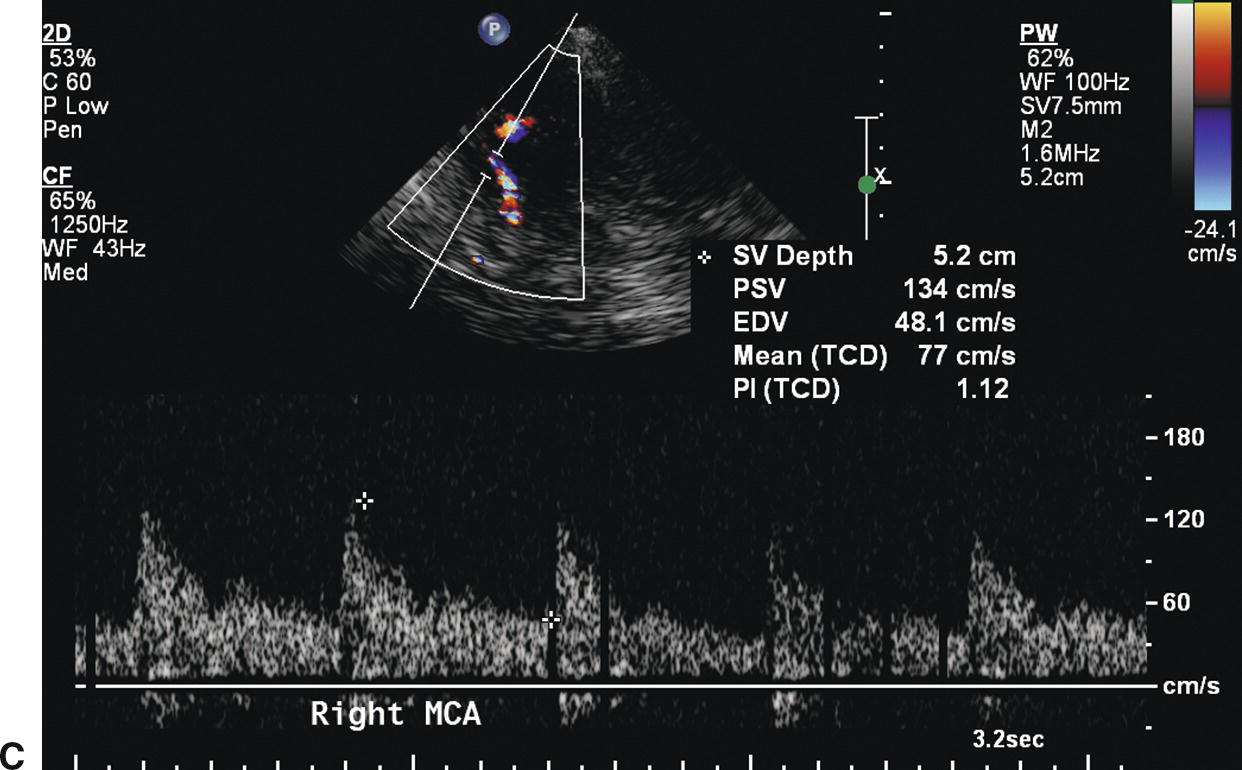
FIGURE 9.6. A,A stylized map of the arterial network showing the pathway (in red) for intracranial crossover from the right to the left hemisphere via the ACoA. Note that the flow direction in the left ACA reverses when this occurs. B,Mean velocity in the ACA contralateral to the extracranial carotid stenosis is increased to 113 cm/s (more than 25% higher than the MCA contralateral to the extracranial carotid stenosis). C,Mean velocity in the MCA contralateral to the extracranial carotid stenosis is 77 cm/s.
Typical Examination Findings
(Red = flow toward the transducer; blue = flow away from the transducer.)
Normal Side
- MCA: normal flow direction (red) and velocity.
- ACA: normal flow direction (blue), velocity elevated at least 25% above the adjacent MCA due to compensatory flow (Figs. 9.6 and 9.7).
- PCA: normal flow direction (P1, red; P2, blue as the artery flows toward then bends away from the transducer) and velocity.
- BA: normal flow direction (blue) and velocity.
- Note: There will be compensatory flow noted throughout the CCA and into the ICA, which will elevate velocities throughout this system.
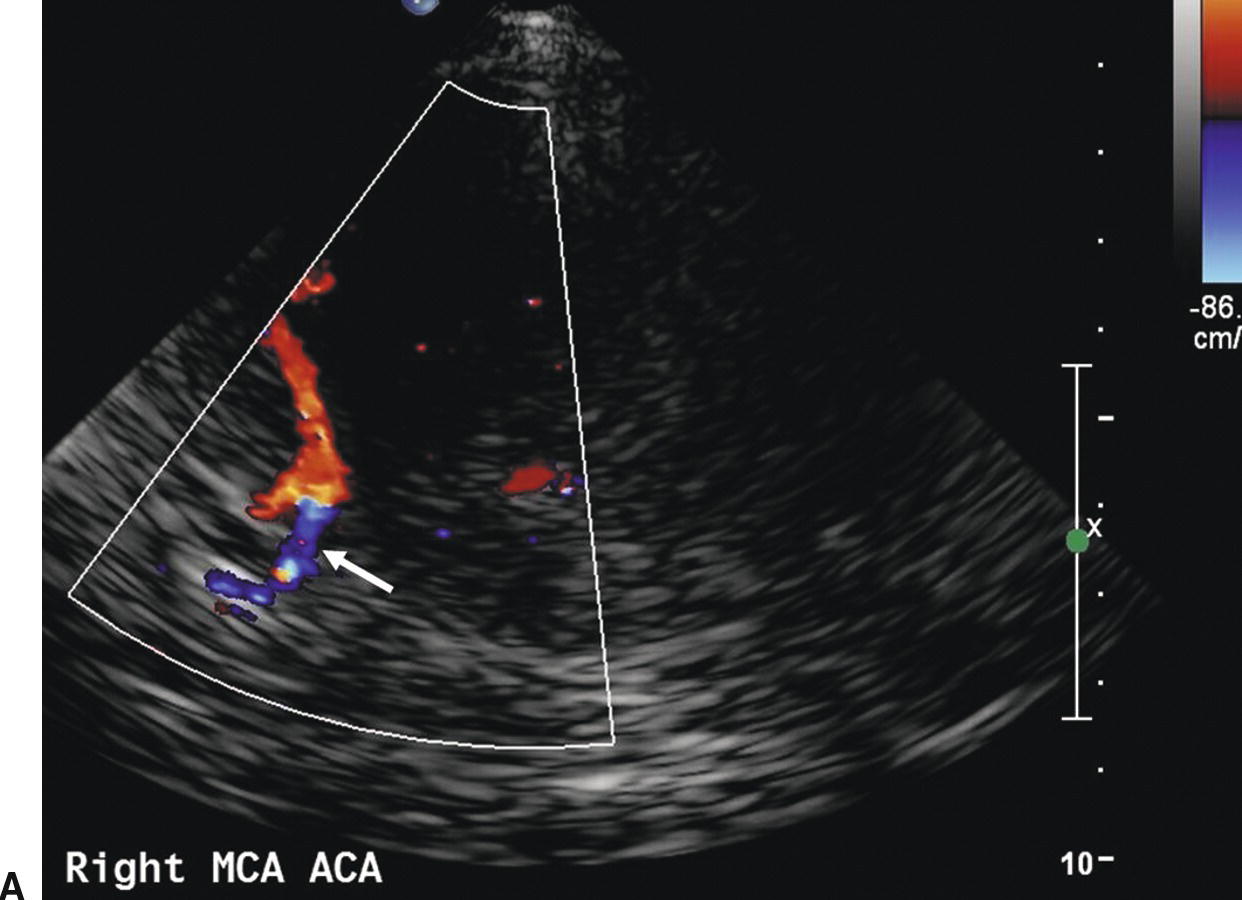
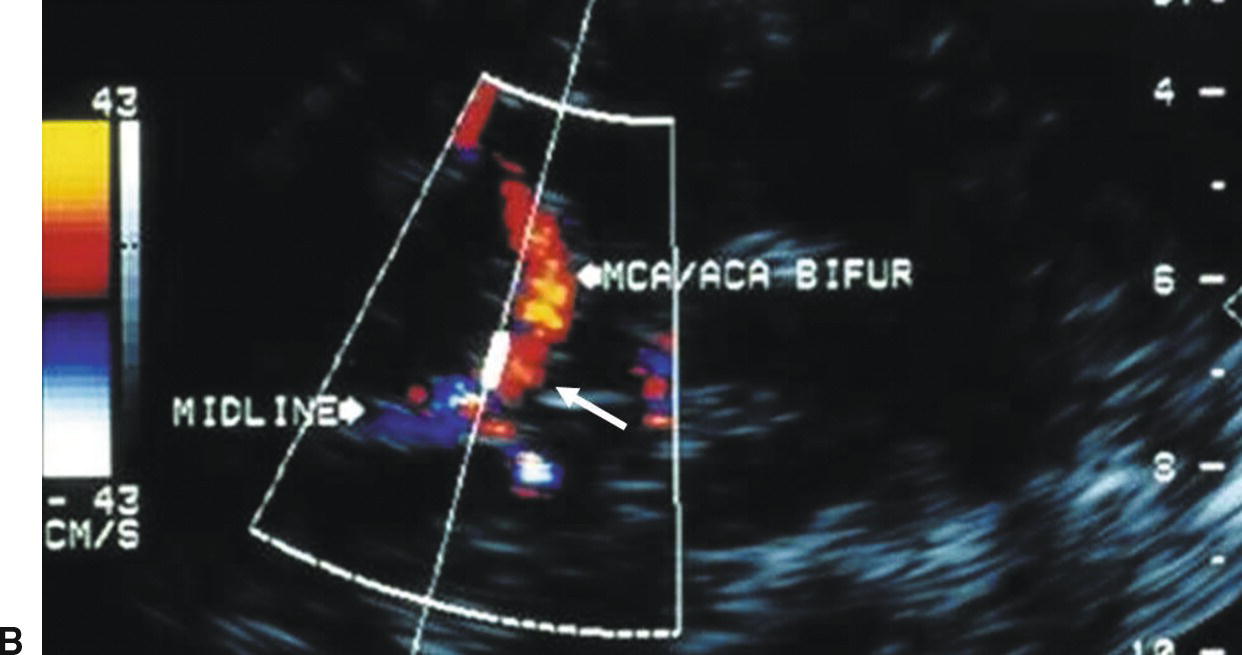
FIGURE 9.7. A,Color-flow image showing normal flow direction (blue) in the ACA contralateral to the extracranial carotid stenosis (arrow). B,Color-flow image showing reversed flow direction (red) in the ACA ipsilateral to the extracranial carotid stenosis (arrow). In both images MCA flow is in the normal direction (red).
Stay updated, free articles. Join our Telegram channel

Full access? Get Clinical Tree


