Fig. 10.1
Three-dimensional CT angiogram shows locations of the acoustic windows for transcranial Doppler examination except transforaminal approach. The transtemporal window for insonation may be found above the zygomatic arch at the (1) middle, (2) posterior, and (3) anterior probe positions. Normal spectral Doppler waveforms obtained through these acoustic windows are shown
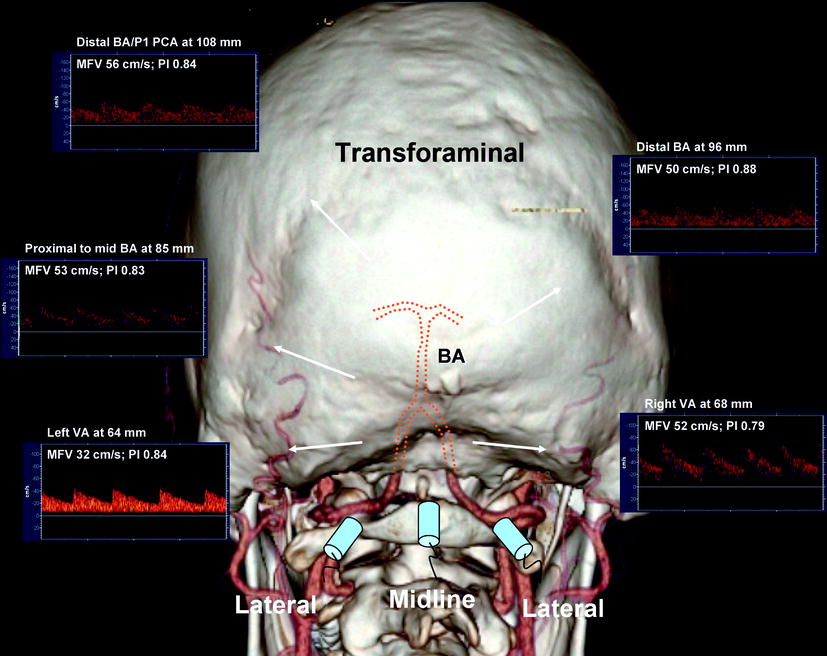
Fig. 10.2
Transforaminal window is shown relative to a three-dimensional CT angiogram with dotted lines identifying terminal vertebral and basilar arteries course. Transducer positions (midline and lateral) are shown relative to the vessels that could be insonated through these approaches. Normal spectral Doppler waveforms obtained from the terminal vertebral and basilar arteries are shown
Transtemporal Insonation Steps
1.
Set the depth at 50 mm (midpoint of the M1 MCA). Place the probe above the zygomatic arch and aim it slightly upward and anterior to the contralateral ear/window. Find any flow signal and avoid too anterior and too posterior angulations. Find a flow signal directed toward the probe that resembles MCA flow (low-resistance waveform). Store the highest velocity at this depth.
2.
Follow the flow signal until it disappears at shallow (30–40 mm) depths (M2 MCA branches). Store any abnormal signal (avoid sampling meningeal arteries at these depths). Return to the midpoint of the M1 MCA.
3.
Follow the M1 MCA stem to its origin at 60–70 mm (insonation of the terminal ICA is possible at this depth). Find the ICA bifurcation at approximately 65 mm and obtain both proximal M1 MCA and A1 ACA (away from the probe) signals. Store a bidirectional signal of the bifurcation.
4.
Follow the A1 ACA signal to 70–75 mm depths. Store the distal A1 ACA signal at 70 mm.
5.
Find the terminal ICA signal just inferior and sometimes slightly posterior to the bifurcation at 60–65 mm. Store any abnormal signal.
6.
Return to the ICA bifurcation and slowly turn the transducer posterior by 10–30° (usually there is a flow gap between the bifurcation and PCA signals). Find PCA signals directed toward (P1) and away (P2) from the probe at a depth range of 55–75 mm. Store the PCA signals with the highest velocity.
Transorbital Insonation Steps
1.
Decrease power to the minimum (17 mW) or 10%. Set the depth at 50–52 mm and place the transducer over the eyelid and angle it slightly medially. Determine flow pulsatility and direction in the distal OA (high pulsatility flow toward the probe). Store the OA signals.
2.
Set the depth at 60–64 mm and find the ICA siphon flow signals (usually located medially in the orbital window). Store bidirectional or unidirectional signals directed toward (lower limb of the siphon) and/or away (upper limb of the siphon) from the probe.
Transforaminal Insonation Steps
1.
Use full power and set the depth at 75 mm (distal VA/proximal BA). Place the transducer at midline 1 in. below the edge of the skull and aim it at the bridge of the nose. Identify a flow signal directed away from the probe (i.e., find the window).
2.
Increasing the depth, follow the flow directed away from the probe. Store the proximal BA signal arbitrarily assigned to the depth of 80 mm (mid-BA to 90 mm, distal BA to >100 mm). Bidirectional signals may be found at various depths resembling cerebellar arteries. Store the highest velocity signal obtained at the most distal BA.
3.
Set the depth at 60 mm and place the transducer about 1 in. laterally to the midline and aim toward the bridge of the nose or slightly toward the contralateral eye. Find the VA flow signal directed away from the probe and follow its intracranial course from 40 to 80 mm. Store the VA signal at 60 mm (or at the depth with the highest velocity). Repeat the examination on the contralateral side.
Submandibular Insonation Steps
1.
Set the depth at 50–60 mm, place the probe laterally under the jaw, and aim it upward and slightly medially. Find a low-resistance flow directed away from the probe. Store the distal ICA signal at the depth that shows the highest velocity. This approach is reserved for patients with subarachnoid hemorrhage (SAH) when vasospasm grading requires calculation of the Lindegaard index.
The TCD interpretation consists of the assessment of:
1.
Mean flow velocity changes (focal or global)
2.
Asymmetry of flow parameters (side-to-side, segmental)
3.
Pulsatility (high or low resistance)
4.
Waveform/sound pattern recognition of flow changes
A normal TCD examination may reveal a wide range of depths of insonation, velocity values, and waveforms.
Criteria for Normal TCD Findings
1.
Good windows of insonation, all proximal arterial segments found.
2.
Directions of flow and depths of insonation are given in Table 10.1.
Table 10.1
Normal depth, direction, and mean flow velocities at assumed 0° angle of insonation for the arteries of the circle of Willis
Artery | Depth (mm, adults) | Direction | Childrena | Adults |
|---|---|---|---|---|
M2 MCA | 30–45 | Bidirectional | <170 cm/s | <80 cm/s |
M1 MCA | 45–65 | Toward | <170 cm/s | <80 cm/s |
A1 ACA | 62–75 | Away | <150 cm/s | <80 cm/s |
A2 ACA | 45–65 | Toward | N/A | <80 cm/s |
ICA siphon | 60–65 | Bidirectional | <130 cm/s | <70 cm/s |
OA | 40–60 | Toward | Variable | Variable |
PCA | 55–70 | Bidirectional | <100 cm/s | <60 cm/s |
BA | 80–100+ | Away | <100 cm/s | <60 cm/s |
VA | 45–80 | Away | <80 cm/s | <50 cm/s |
3.
The differences between flow velocities and pulsatility indices in the homologous arterial segments are usually less than 30%: 15% is attributable to the difference in angle of insonation and another 15% to breathing cycles. Normal variations of up to 100% in flow velocities between homologous segments such as PCA or VA can be attributed to a tortuous vessel course, anatomic variants of the circle of Willis, and subdominance/hypoplasia.
4.
A normal MCA mean flow velocity (MFV) is in the range of 80–100 cm/s in adults free of anemia and does not exceed 170 cm/s in children with sickle cell disease.
5.
A normal velocity ratio: MCA ≥ ACA ≥ siphon ≥ PCA ≥ BA ≥ VA.
6.
A positive end-diastolic flow velocity (EDV) of 25–50% of the peak systolic velocity (PSV) values and a low-resistance pulsatility index (PI) of 0.6–1.1 are present in all intracranial arteries while breathing room air. A normal high resistance flow pattern (PI ≥1.2) is seen in the OAs only.
7.
Abnormal high-resistance flow patterns can be seen in patent cerebral arteries with aging, chronic hypertension, increased cardiac output, and during hyperventilation.
Cerebrovascular Resistance and Hemodynamic Indices
Cerebrovascular resistance (CVR) is determined by several factors that impede cerebral blood flow (CBF) and thus determine MFV: the vessel radius, length, and blood viscosity. The Hagen-Poiseuille law is often used to describe the impact of resistance on blood flow. It states that the flow of a fluid through a tube is directly proportional to the pressure difference that exists between two ends of a tube and to the fourth power of the vessel radius, and inversely proportional to the length of the tube and fluid viscosity. Thus, the diameter of a blood vessel, which is mostly accomplished by arterial-arteriolar constriction and dilatation, is the most significant contributor of all to the rate of blood flow. Under normal conditions, the brain is a low-resistance arterial system, and the ICA branches have considerably greater end-diastolic flow than the external carotid artery branches. The resistance to flow is described by the pulsatility and the resistance index (RI):
PI (Gosling-King) = PSV − EDV/MFV (normal values in the range of 0.6–1.1).
RI (Pourcelot) = PSV − EDV/PSV (normal values are in the range of 0.49–0.63) [13].
These indices quantitatively reflect CVR and depend largely on the strength of the signal recorded as well as the envelope and time averaging software. Therefore, “weak signals,” “poor” windows, incomplete examination, and individual variations may produce substantial drawbacks. Additional information can be gained by visual flow pattern recognition. Pathologically increased pulsatility indices (≥1.2) are seen with increased ICP and decreased cerebral perfusion pressure due to decreased EDV. Further increased PIs can be detected proximal to a severe arterial obstruction, in patients with chronic hypertension and during episodes of hypocapnia. Pathologically low pulsatility indices (≤0.5) are mainly seen in the arteries feeding arteriovenous malformations since direct shunting of blood into the venous system results in abnormally low CVR [14]. Low PIs may also be seen distal to a severe extra- or intracranial stenosis indicating compensatory vasodilation and during hypoventilation. Although these indices per se may not be sufficient to diagnose extra- or intracranial cerebrovascular diseases, they should be used in a battery of TCD parameters allowing integrated assessment of intracranial circulation.
The hemispheric index (also known as the Lindegaard ratio) compares MCA MFV to the ipsilateral ICA and may help to differentiate an MCA MFV increase due to vasospasm and/or hyperperfusion [15]. The M1 MCA vasospasm after SAH is usually associated with a Lindegaard ratio ≥3, while a severe M1 MCA vasospasm has been shown to correlate with values ≥6.
Other factors that affect CBF and CVR include age, gender, cardiac function, hematocrit, fibrinogen, and vasodilatory or constricting medications [13].
TCD measurement of flow velocities, however, does not allow calculation of CBF in ml/min because of the variable and unknown arterial diameter and peripheral resistance [16]. However, the area under the waveform envelope, intensity of the signal, and relative change in the mean flow velocities determined with the same angle of insonation are usually proportional to regional CBF changes [17]. For example, MFV changes due to vasomotor reactivity with different vasodilatory stimuli reflect CBF changes assuming that the perfused territory remains constant during investigation [18]. The use of TCD for monitoring physiological responses to vasodilatory substances is based on the concept of cerebral vasomotor reactivity (VMR) in order to identify patients at a particular risk for cerebral ischemic events.
Specific Clinical Indications and Diagnostic Criteria
The specific established clinical indications for TCD in routine clinical practice include sickle cell disease, cerebral ischemia (stroke, transient ischemic attack; TIA), carotid artery stenosis and occlusions, arterial vasospasm after SAH, cerebral circulatory arrest, and periprocedural or surgical monitoring. In the following, we provide a summary of various diagnostic criteria previously published by other investigators and generated by our vascular laboratory.
Sickle Cell Disease
TCD can identify children with the highest risk of first-ever stroke and those in need of blood transfusion [19, 20]. In a pivotal trial [20], TCD detection of time-averaged maximum MFV of 200 cm/s on two separate examinations was used to determine the need for blood transfusion that resulted in 90% relative risk reduction of first-ever stroke. This trial demonstrated that TCD can select patients for the most effective primary stroke prevention intervention to date that had profound implications on management of children with sickle cell disease. Further observations confirmed that children initially selected by TCD for blood transfusion should stay on transfusion schedule to sustain the benefit in stroke risk reduction [21]. Moreover, recent data including long-term follow-up and final results from the Stroke Prevention Trial in Sickle Cell Anemia (STOP) indicated that persistent elevation in TCD velocities indicates ongoing stroke risk [22]. The skill of TCD testing in children with sickle cell anemia is taught through standard tutorials with sonographers receiving specialized certificates, and diagnostic criteria for interpreting physicians are well defined [22, 23].
Subarachnoid Hemorrhage
Arterial vasospasm following SAH becomes symptomatic in more than 25% of patients leading to a delayed ischemic deficit (DID) [24]. DID usually occurs when vasospasm results in a severe (≤1 mm) intracranial arterial narrowing producing flow depletion with extremely high velocities [25]. It may affect the proximal stem and distal branches of intracranial arteries with the most common locations being:
Numerous studies have shown the effectiveness of TCD in diagnosing cerebral arterial vasospasm both in anterior and posterior circulation following SAH [27–35]. More specifically, TCD can detect the development of vasospasm on days 2–5 following SAH, i.e., before it can become clinically apparent, and this information can be used by intensivists to step up with hemodynamic management of these patients [36]. In addition, TCD can detect progression to the severe phase of vasospasm when development of the DID due to perfusion failure through the residual lumen is the greatest. The maximal sensitivity of TCD for detecting severe cerebral vasospasm is at day 8 after SAH onset, while its sensitivity for diagnosing DID is lower [36].
Although quantitative criteria have been studied extensively, grading arterial vasospasm severity remains difficult, and the interpretation of TCD findings should be individualized. Daily TCD examinations may detect considerable flow velocity and pulsatility changes that may be attributed to early development of vasospasm and progression to a severe stage. However, TCD findings should be related to the patient clinical condition, medications, blood pressure, and time after day 0 (usually the onset of the worst headache of patient’s life) and ICP findings:
1.
Proximal vasospasm in any intracranial artery results in a focal (or present along one or two branching segments) elevation of mean flow velocities without a parallel velocity increase in the feeding extracranial arteries (intracranial/extracranial vessel ratio ≥3).
2.
Distal vasospasm in any intracranial artery may produce a focal pulsatile flow (PI ≥ 1.2) indicating increased resistance distal to the site of insonation. No MFV increase may be found since vasospasm is located distal to the site of insonation. Additional findings may include daily changes in velocities, ratios, and PIs during the first 2 weeks but are particularly pronounced during the critical days 3–7 after the onset of SAH.
MCA vasospasm-specific criteria are shown in Table 10.2. The differential diagnosis includes hyperemia, combination of vasospasm and hyperemia in the same vessel (since most SAH patients routinely receive some part of hypertension-hemodilution-hypervolemia therapy; HHH), residual vasospasm, and hyperemia. Arterial vasospasm may also coexist with hydrocephalus, edema, and infarction.
Table 10.2
TCD criteria for grading vasospasm in the proximal MCA
Mean flow velocity (cm/s) | MCA/ICA MFV ratio | Interpretation |
|---|---|---|
<120 | ≤3 | Hyperemia |
≥120 | 3–4 | Development of mild spasm + hyperemia |
≥120 | 4–5 | Moderate spasm + hyperemia |
≥120 | 5–6 | Moderate spasm |
≥180 | 6 | Moderate-to-severe spasm |
≥200 | ≥6 | Severe spasm |
>200 | 4–6 | Moderate spasm + hyperemia |
>200 | 3–4 | Hyperemia + mild (often residual) spasm |
>200 | <3 | Hyperemia |
Prognostically unfavorable signs include an early appearance of MCA MFV ≥180 cm/s, a rapid (>20% or >65 cm/s) daily MFV increase during critical days 3–7, an MCA/ICA ratio ≥6, and the abrupt appearance of high-resistance PI ≥ 1.2 of flow in two or more arteries indicating increased ICP and/or distal vasospasm [24].
Grading vasospasm severity in the arteries other than MCA is difficult. Sloan and colleagues showed that TCD is highly specific (100%) for VA and BA vasospasm when mean flow velocities are ≥80 and ≥95 cm/s, respectively, and suggested reporting vasospasm in these arteries as possible, probable, and definite (Table 10.3) [25, 35]. The key indicator of a significant vasospasm is a focal, asymmetric, and disproportionate velocity increase that may occur in an artery distant from the aneurysm site or blood clot collection on computed tomography. The differential diagnosis includes hyperemia and its combination with vasospasm in these arteries.
Table 10.3
Sloan’s optimized criteria for grading vasospasm (VSP) in intracranial arteries
Artery/MFV | Possible VSP | Probable VSP | Definite VSP |
|---|---|---|---|
ICA | >80 | >110 | >130 |
ACA | >90 | >110 | >120 |
PCA | >60 | >80 | >90 |
BA | >70 | >90 | >100 |
VA | >60 | >80 | >90 |
Soustiel et al. have shown that the ratio between the BA and the extracranial VA (termed Soustiel’s ratio) may contribute to an improved discrimination between BA vasospasm and vertebrobasilar hyperemia and enhance the accuracy and reliability of TCD in the diagnosis of BA vasospasm [31]. Sviri and colleagues independently validated the accuracy of Soustiel’s ratio, and, after showing that this ratio improved the sensitivity and specificity of TCD detection of BA vasospasm, they introduced new TCD grading criteria for BA vasospasm [32, 33].
An ongoing individual correlation of angiography with same-day TCD findings may improve the accuracy of TCD to detect vasospasm onset. A focal and disproportionate to therapy increase in flow velocities indicates the development of vasospasm. For example, an MCA MFV increase by 50 cm/s may indicate a 20% diameter reduction of the vessel, and since flow velocity is inversely proportionate to the vessel radius, a 50% diameter reduction usually doubles the velocity on TCD [38]. Therefore, TCD may be more sensitive to changes in intracranial artery diameter than angiography particularly at the early phases of vasospasm development. Since TCD is a screening tool, the criteria should be adjusted to a higher sensitivity to detect any degree of vasospasm in order to institute components of the HHH therapy. At the same time, a higher specificity threshold should be used for severe vasospasm to minimize the number of false-negative angiograms, particularly if TCD is used to select patients for angioplasty.
Hyperemia is suspected with elevated velocities in the intracranial and often in the feeding extracranial vasculature. Hyperemia changes on TCD are common in patients with SAH receiving components of HHH therapy. The use of Lindegaard ratio [15] and new flow and area indices [39] may help to minimize false-positive TCD results and predict better the diameter of the residual lumen on angiography.
Other hyperperfusion syndromes may occur after carotid endarterectomy (CEA) or angioplasty (post-revascularization hyperemia) usually characterized by a ≥30% increase in MCA MFV unilateral to the reconstructed carotid artery and low-pulsatility waveforms compared with the contralateral side, indicating decreased capacity of distal vasculature to regulate the reestablished flow [40–42]. Hyperemic reperfusion may also develop with systemic thrombolytic therapy and intra-arterial revascularization procedures for acute ischemic stroke [43].
Acute Cerebral Ischemia
An indication “ischemic stroke” or “transient ischemic attack” may necessitate not only a complete diagnostic TCD examination [44] in order to detect the presence of steno-occlusive disease and collaterals. It can be also extended to include VMR assessment, emboli detection, cardiac right-to-left shunting (RLS) testing, as well as continuous real-time intracranial vessel monitoring. The reasons to perform TCD in patients with suspected or confirmed cerebral ischemia are multiple. First, carotid duplex alone can detect a significant (>50%) carotid stenosis or occlusion in only 15–20% of consecutive patients with stroke or TIA. Thus, the stroke mechanism remains unexplained in the majority of these patients if only carotid duplex is performed for vascular imaging. Second, magnetic resonance angiography (MRA) of the head and neck is often performed, but it is prone to artifacts, often prompting additional contrast angiography or TCD testing.
Complete TCD examination evaluates up to 16 proximal intracranial arterial segments with the goal of detecting normal, stenosed, or occluded intracranial vessels [44]. The assessment of vessel patency has prognostic significance as patients with persisting occlusions have worse outcomes if reperfusion therapy is not instituted timely or is ineffective [45]. This information is also helpful to select patients for catheter angiography, intra-arterial rescue procedures, and potentially hemicraniectomy.
TCD evaluation also has diagnostic significance to identify stroke pathogenic mechanisms, i.e., large-vessel stenosis, or artery-to-artery embolism as opposed to a cardiac or paradoxical embolism source. Patients with intracranial disease are at high (10–15% annually) risk of stroke recurrence. The same TCD examination can detect collateral flow and the hemodynamic significance of extracranial or intracranial steno-occlusive lesions [46–54]. This information is helpful to identify a proximal arterial obstruction and to clarify carotid duplex or noninvasive angiographic findings including MRA and CT angiography (CTA). Carotid duplex and MRA are known to produce falsely elevated estimates of the degree of carotid stenosis, and TCD, via collateral and downstream hemodynamic effects, can help clarify false-negative and false-positive diagnosis of severe ICA stenosis. A severe ICA stenosis should produce downstream flow changes directly detectable by TCD, and if no delay in systolic flow acceleration is seen or no collaterals are detected, these TCD findings likely indicate moderate proximal ICA stenosis [43, 46, 51]. On the other hand, if extracranial duplex scanning does not reveal a severe ICA lesion (e.g., high carotid bifurcation), the presence of unilaterally delayed systolic flow acceleration or intracranial collaterals would suggest the presence of a severe proximal ICA lesion. It is recommended to perform TCD studies always in conjunction with ultrasound examination of the extracranial brain supplying arteries in patients with stroke or TIA [12].
For intracranial steno-occlusive lesions, intracranial MRA often shows flow gaps due to turbulence or reversal of flow direction, thus overestimating the degree of stenosis. TCD findings of focal elevated velocities confirm the presence of an intracranial stenosis or collaterals when applicable, and validated diagnostic criteria are available [43, 55].
Intracranial Atherosclerotic Disease
Intracranial atherosclerotic disease is now recognized as a serious risk factor with severe and multiple lesions carrying the highest risk of stroke recurrence. Recent emphasis on identification of ≥50% and ≥70% stenoses prompted reevaluation of the current criteria and development of new ones.
Middle Cerebral Artery Stenosis
Primary findings for any significant ≥50% MCA stenosis include a focal significant MFV or PSV increase (≥100 or ≥140 cm/s, respectively) or interhemispheric MFV difference of 1:2 in adults free of cerebrovascular disease [48, 51, 56–64]. A ≥70% MCA stenosis could produce higher velocities, and in our laboratory, we use a MFV cutoff >120 cm/s [65]. This velocity increase should be further associated with a ratio to a homologous segment of 1:3 or higher. If anemia, congestive heart failure, and other circulatory conditions associated with elevated or decreased velocities, a focal MFV difference ≥30% between neighboring or homologous arterial segments should be applied to see if the velocity increase reaches any significance. Adult patients with anemia or hyperthyroidism often have increased MCA mean flow velocities. In children with sickle cell disease, MCA MFV ≥170 cm/s is considered abnormal [19].
Additional findings may include turbulence (occasionally a low-frequency noise produced by nonharmonic co-vibrations of the vessel wall and musical murmurs due to harmonic co-vibrations producing pure tones can be heard) or disturbed flow distal to the stenosis or presence of characteristic flow voids on PMD-TCD indicating a low-frequency bidirectional turbulent flow during systole; an increased unilateral ACA MFV may indicate compensatory flow diversion or A1 ACA or ICA bifurcation stenosis, and microembolic signals (MES) found in the distal MCA.
If MFVs are increased throughout the M1 MCA, the differential diagnosis includes MCA stenosis, terminal ICA or siphon stenosis, hyperemia or compensatory flow increase in the presence of contralateral ICA stenosis, ACA occlusion, and incorrect vessel identification.
A critical stenosis or obstruction with near-occlusive thrombus or embolus can either produce a focal velocity increase or a blunted MCA waveform with slow or delayed systolic acceleration, slow systolic flow deceleration, low velocities, and lower MFVs in the MCA than ACA or any other intracranial artery [48, 51, 53]. Decreased or minimal flow velocities with slow systolic acceleration can be found due to a tight elongated MCA stenosis or thrombus causing near-occlusion. These focal lesions should be differentiated from a proximal ICA obstruction that can also produce delayed systolic flow acceleration in the MCA [30, 46–54].
Anterior Cerebral Artery Stenosis
Primary findings for any significant ACA stenosis include a focal significant mean flow velocity increase (ACA > MCA) and/or a ≥30% difference between the proximal and distal ACA segments and/or interhemispheric ACA MFV difference of ≥30% (these are the original criteria, but in reality ACA MFV velocity should at least double the velocity of the reference vessel) [51, 63, 66]. Collateralization via the anterior communicating artery (AComA) can be excluded by a normal contralateral ACA flow direction. Usually an ACA stenosis can be detected at depth of 60–75 mm. The differential diagnosis includes anterior cross-filling due to a contralateral proximal carotid artery obstruction [46–49].
Additional findings may include turbulence and a flow diversion into the MCA and/or compensatory flow increase in the contralateral ACA. Decreased or minimal flow velocities at the A1 ACA origin may indicate a suboptimal angle of insonation from the unilateral temporal window, an atretic or tortuous A1 ACA segment, or A1 ACA near-occlusion. Since the A2 ACA segment cannot be assessed directly by TCD, its obstruction can be suspected only if a high-resistance flow is found in the distal dominant A1 ACA segment.
Common errors include incorrect vessel identification (terminal ICA versus ACA), velocity underestimation (suboptimal angle of insonation, poor window, weak signals) and inability to differentiate a collateral flow from the stenosis.
Terminal Internal Carotid Artery and Siphon Stenosis
A terminal ICA (traceable through the temporal window) and ICA siphon (traceable through the transorbital window) stenosis produces a focal significant MFV increase (ICA > MCA, and/or an ICA MFV ≥70 cm/s, and/or ≥30% difference between arterial segments) [43, 51, 63, 67].
The differential diagnosis includes moderate proximal ICA stenosis and/or compensatory flow increase with contralateral significant ICA obstruction. Additional findings in the presence of an ICA stenosis may include turbulence, blunted unilateral MCA, OA MFV increase, and/or flow reversal with low pulsatility. The ICA siphon MFV may decrease due to siphon near-occlusion (a blunted siphon signal) or distal obstruction (i.e., MCA occlusion or increased ICP).
Common errors include incorrect vessel identification such as MCA versus TICA via transtemporal approach or ACA versus ICA with deep transorbital insonation and consequently collateralization of flow via the anterior cross-filling misinterpreted as an arterial stenosis. In the absence of temporal windows, these findings may be the only yet confusing indicators of a significant carotid artery lesion.
Posterior Cerebral Artery Stenosis
A focally significant PCA stenosis results in an MFV increase PCA > ACA or ICA and/or a PCA MFV ≥50 cm/s in adults [54, 63, 68–70]. Additional findings may include turbulence and a compensatory flow increase in the MCA.
The differential diagnosis includes collateral flow via the posterior communicating artery (PComA) either toward the posterior circulation in case of BA occlusion or toward the anterior circulation in case of MCA, TICA, or tandem extracranial ICA/MCA occlusions and siphon obstruction. Of note, PComA is a tortuous vessel, and its flow direction on TCD does not necessarily indicate where the lesion is that requires collateralization. Using TCCD, it may be possible to differentiate PCA stenosis from collateralization of flow using PSV [71].
Common sources of error include unreliable vessel identification and a top-of-the-basilar stenosis.
Basilar Artery Stenosis
Primary findings in the presence of a BA stenosis include a focal significant MFV increase BA > MCA or ACA or ICA, and/or an MFV BA ≥60 cm/s in adults, and/or a ≥30% difference between arterial segments [43, 54, 63]. The findings of a recent study indicate that a BA stenosis of ≥50% can be more reliably identified when BA MFV exceeds 80 cm/s [53, 64]. To detect ≥70% intracranial vertebrobasilar stenosis, we use MFV increase >110 cm/s and a stenotic/pre-stenotic ratio ≥3 [65].
The differential diagnosis includes a terminal VA stenosis if elevated velocities are found proximally, i.e., at a depth of 70–80 mm. If elevated velocities are found throughout the entire BA course, the differential diagnosis includes a compensatory flow velocity increase, i.e., in case of a carotid artery obstruction. With the latter velocities are increased in at least one of the VAs.
Basilar artery near-occlusion produces a focal MFV decrease (≤30% difference between neighboring arterial segments and/or BA < VA) resulting in a blunted waveform [54]. The differential diagnosis includes a fusiform (dolichoectatic) BA with or without thrombus since an enlarged vessel diameter may reduce flow velocities. If the end-diastolic flow is absent, the differential diagnosis includes BA occlusion or tortuosity with branch insonation at a suboptimal angle.
Additional findings may include turbulence and disturbed flow signals distal to the stenosis, compensatory flow increase in VAs and posterior cerebellar inferior arteries indicating cerebellar collateralization, and a collateral supply via PComA to PCA with a reversed flow in the distal BA.
Common sources of error include a tortuous basilar (“not found” does not always mean obstructed), elongated BA obstruction, and distal BA lesions that were not reached by TCD or identified due to flow presence to the superior cerebellar arteries producing false-negative results. Application of ultrasound contrast and TCCD may help the detection of the distal BA segment, tortuosity, and distal branches [43, 54, 72, 73]. A collateral flow from the posterior to the anterior circulation in the presence of carotid lesions may increase flow velocity changes associated with mild stenosis and/or tortuosity. In the case of flow collateralization, the dominant VA velocities are also increased [74]. Reversed flow in the BA (low-resistance flow toward the probe) is characteristic for a proximal BA occlusion with retrograde filling of the distal BA through the PComA [54, 75]. The origin of the collateral flow in the anterior circulation can be confirmed with carotid artery tapping that can be transmitted to the reversed flow.
Intracranial Vertebral Artery Stenosis
Primary findings of an intracranial VA stenosis include a focal MFV increase VA > BA, and/or MFV VA ≥50 cm/s in adults, and/or a ≥30% difference between VAs or its neighboring segments [43, 63, 76]. Recent findings have indicated that a ≥50% VA stenosis can be more reliably identified when VA MFV exceeds 80 cm/s and when the stenotic-to-normal MFV ratio is ≥2 [53, 64]. A ≥70% VA stenosis could produce higher velocities, and in our laboratory, we use a MFV cutoff >110 cm/s and a stenotic-to-normal MFV ratio of ≥3 [65].
The differential diagnosis includes proximal BA or contralateral terminal VA stenoses and a compensatory flow increase in the presence of a contralateral VA occlusion or carotid lesion.
Additional findings may include turbulence or disturbed flow signal distal to the stenosis; a compensatory elevated velocity in the contralateral VA, posterior cerebellar inferior arteries, or other cerebellar arteries (cerebellar collaterals); low BA flow velocities (hemodynamically significant lesion, hypoplastic contralateral VA) and low-resistance flow distal to stenoses (compensatory vasodilation); and the presence of distal MES in the BA or cerebellar collaterals.
Common sources of error include a compensatory flow increase due to hypoplastic contralateral VA, low velocities in both VAs due to a suboptimal angle of insonation, extracranial VA stenosis or occlusion with well-developed muscular collaterals, elongated VA stenosis/hypoplasia, and incorrect vessel identification, i.e., posterior cerebellar inferior artery (PICA).
Arterial Occlusion
The diagnosis of an acute intracranial arterial occlusion with TCD is difficult. The operator must be experienced and the best results are usually obtained for M1 MCA, terminal ICA/siphon, and BA. The main requirement for confidence in TCD findings is a good window of insonation (or the ability to use imaging or contrast agents) whereby other patent arteries should be identified through the same approach. To achieve better sensitivity to slow and weak flow, a single-gate spectral TCD system should be set at the maximum allowed power and a large sample volume (12–15 mm). A PMD-TCD system should be set at a depth range of presumed arterial occlusion and a small spectral TCD sample volume (3 mm) as it allows a higher power output compared with a large sample volume.
An acute lesion may represent a complete occlusion, subtotal stenosis or partial, yet hemodynamically significant flow obstruction or near-wall thrombus with the only signs being marginal elevation of velocities and occasional distal microemboli. Instead of relying on velocity measurements in detectable segments, the TCD examiner should pay attention to waveform patterns and signs of flow diversion, collateralization, and embolization. Waveform morphology discloses more information about clot location, hemodynamic significance of obstruction, and resistance in the distal vasculature than velocity difference by itself. This approach leads to a greater yield of abnormal TCD findings that are highly predictive of the presence of a thrombus at invasive angiography [77–79]. For example, if the affected MCA MFV is ≤30% compared with the non-affected side and the waveform shows delayed systolic flow acceleration, this could point to a proximal ICA obstruction and not necessarily an isolated MCA lesion. Further waveform analysis of the MCA is required to establish the presence of an additional lesion in the MCA. If diastolic flow disappears at any depth along the MCA, this strongly suggests the presence of a tandem occlusion. The presence of a diastolic flow at 45–65 mm could imply patency of small perforating arteries arising from the M1 MCA. Demchuk et al. developed the Thrombolysis in Brain Ischemia (TIBI) flow grading system to predict success of intracranial clot lysis and short-term improvement after ischemic stroke (Fig. 10.3) [79]. Based on previous studies and our own correlations with invasive angiography, our group described detailed criteria for intracranial occlusions on TCD [57, 68, 78–83].
Fig. 10.3
Detailed TIBI flow grades definitions (With permission from the Health Outcomes Institute, Inc.)
MCA Occlusion
For the diagnosis of an MCA occlusion, an abnormal waveform (TIBI flow grades 0–3) has to be found at a depth of 30–65 mm via the transtemporal approach. The presence of positive end-diastolic flow (TIBI flow grades 2–3) implies flow to the nearest branching vessels to the depth at which these were located such as perforators, anterior temporal artery, or M2 MCA.
Additional findings are a flow diversion and/or a compensatory velocity increase in the unilateral ACA and/or PCA, no flow signals in the ACA and ICA with PCA flow identified (possible “T”-type terminal ICA occlusion), and a diastolic flow and overall velocity decrease from the TICA to the distal MCA.
Intracranial Internal Carotid Artery Occlusion
With an intracranial or TICA occlusion, TCD findings are dependent on collateralization and the extent of occlusion into the MCA such as “T” or “L” types. If an extension into the MCA is present, TIBI flow grades 0–2 are usually found with MCA velocities below 20 cm/s [84]. Additionally, there is either partial or complete anterior cross-filling with A1 ACA reversal and retrograde filling of the siphon. Besides abnormal TIBI waveforms at 60–70 mm and recruitment of collaterals and contralateral compensatory velocity increases, ICA occlusions above the origin of the OA can also produce a high resistance or dampened ICA siphon signal transorbitally and velocity reduction and pulsatility increase in the proximal ICA on carotid duplex examination. The hallmark of an isolated distal ICA occlusion is the presence of patent proximal ICA on duplex and traceable MCA signals (often blunted) throughout MCA stem and the presence of collateralization of flow indicating a hemodynamically significant lesion in the ICA.
With a proximal ICA occlusion, the most common findings include a blunted MCA signal and reversed OA or absent orbital signals from the OA and ICA siphon. TCD cannot differentiate complete ICA occlusion from hemodynamically significant proximal high-grade stenosis, and direct carotid examination should be used to answer this question.
Additional findings may include collateral flow in the PComA and/or anterior cross-filling via AComA, compensatory velocity increase in the contralateral ICA, blunted MCA waveform, and MES in the unilateral TICA/MCA.
Basilar Artery Occlusion
Abnormal waveforms suggestive of a BA occlusion can be found either at the distal end of the dominant VA or at 80–100+ mm via the transforaminal approach. Additional findings may include a flow velocity increase in one or both VAs or PICAs, indicating collateral flow in the cerebellar arteries; a high-resistance flow signal in one or both VAs, indicating proximal BA occlusion; a high-resistance flow signal at the origin of the BA, indicating distal BA occlusion; retrograde (low-resistance, increased velocity) flow toward the probe at the top of the BA (proximal BA occlusion collateralized via anterior circulation); functional PComA with flow directed away from the probe via the transtemporal approach; and decreased velocities in the distal BA or an absent end-diastolic flow indicating distal BA occlusion [43, 54].
Intracranial Vertebral Artery Occlusion
The most accurate diagnosis with TCD can be made for a terminal VA occlusion [76]. However, the sensitivity of abnormal flow findings is low [84], and a normal intracranial TCD examination cannot completely rule out the presence of a VA occlusion.
An occlusion of the intracranial VA may produce a high-resistance (PI ≥ 1.2) flow in one of the VAs proximal to the obstruction and/or a blunted or minimal flow signal including signals with a reverberating or oscillating pattern. However, the diagnosis of an intracranial VA occlusion is difficult to establish using TCD alone, since it has to be differentiated from an atretic terminal VA segment that could be present distal to PICA origin, may present as a short and collateralized occluded segment, and an extracranial segmental VA occlusion may also be present.
Additional findings may include normal flow signals directed toward the probe on the side of occlusion indicating collateralization of flow from the other side and filling of PICA as well as distal embolization in the PICA [54].
Intracranial Collateral Pathways
The intracranial collateral channels are “dormant” under normal circulatory conditions. A collateral channel opens when a pressure gradient develops between the two anastomosing arterial systems. TCD can directly detect collateral pathways via AComA (anterior cross-filling), PComA, reversed OA, and reversed BA [43, 51, 54, 85–88].
Collateral flow is directed from the donor to the recipient vessels. When present, a collateral flow rarely implies an anatomic variant. Mostly, detection of a collateral channel implies the presence of a flow-limiting lesion or an anatomic variant proximal to the recipient arterial system and the origin of the collateral channel.
The direction of flow determines which arterial system is the donor (the source of flow) and which is the recipient (the collateral flow destination). TCD can provide information on whether any collateral channel is functioning and in which direction it is working. This information can be used to estimate the level of the arterial obstruction and to refine the extracranial duplex ultrasound or MRA findings. For example, an extracranial hemodynamically significant ICA lesion can be accompanied by abnormal TCD findings. A battery of TCD parameters may be used to decide on the severity of ICA lesions, particularly when multiple lesions are found or the applicability of other tests is limited due to the presence of a distal ICA lesion [46–50].
Stay updated, free articles. Join our Telegram channel

Full access? Get Clinical Tree


