Tissue Doppler Imaging, Strain Imaging, and Dyssynchrony Assessment
Brian D. Powell
Raul E. Espinosa
Cheuk-Man Yu
Jae K. Oh
Tissue Doppler Imaging
Tissue Doppler imaging (TDI) is a novel use of ultrasound to image the motion of tissue with Doppler echocardiography. Doppler echocardiography records and displays the velocities of the moving targets. When Doppler echocardiography is used to measure blood flow velocity, erythrocytes are the targets. Their normal velocity ranges from 10 cm/s in the venous circulation to 150 cm/s in the arterial circulation. However, the velocities of myocardial tissue are much lower (1–20 cm/s), but their amplitudes are greater than those produced by blood. Therefore, Doppler ultrasound instrumentshigh frame rate. The two-dimensional (2D) gray scale and TDI are compared in Table 5-1. A special function key needs to be selected to activate TDI. After TDI has been selected, the subsequent operation is identical to that used to perform regular pulsed wave Doppler echocardiography, except that the TDI gain needs to be lowered from the regular gain setting used for blood flow Doppler recordings and the velocity scale needs to be adjusted to a lower aliasing velocity (about 20–30 cm/s or even lower) to optimize TDI signals (Fig. 5-1). Some ultrasound units adjust these variables automatically when the TDI function is selected. Also, TDI can be displayed in the color mode, just as in color imaging of blood flow. Tissue velocities are color-coded by autocorrelation: red for tissue moving toward the transducer and blue for tissue moving away from the transducer (Figs. 5-2 and 5-3). Movement and velocities of cardiac structures are regulated by the underlying systolic function and diastolic function of the heart. Isaaz and colleagues (1) were able to obtain a pulsed Doppler profile of the left ventricular (LV) posterior wall. This was expanded by McDicken and colleagues (2, who developed a prototype of color Doppler velocity display of myocardial wall dynamics. Currently, TDI is an integral part of an echocardiography examination in the areas discussed in the following sections.
Assessment of Myocardial Relaxation
Early diastolic velocity (Ea or E′) of the mitral anulus measured with TDI is a good indicator of LV myocardial relaxation (3). This is one of the most important components of myocardial diastolic function the mitral anulus can be appreciated visually from the parasternal long-axis and apical four-chamber views, but TDI records and demonstrates the velocity of the longitudinal motion in numerical value (Figs. 5-1, 5-2, 5-3). In the
normal heart with normal myocardial relaxation, E′ increases with an increasing transmitral gradient, increasing preload, exercise, and dobutamine infusion (4,5). However, when myocardial relaxation is impaired because of aging or a disease process, E′ is affected less or even unchanged by preload or transmitral gradient (3,4). Velocities of longitudinal mitral anulus motion are best obtained from apical views. Although various locations of the mitral anulus can be interrogated with TDI, the two most frequently used locations are the septal (or medial) and lateral mitral anulus. Usually, E′ from the lateral anulus is higher (normally >15 cm/s) than that from the medial anulus (normally >10 cm/s) (Fig. 5-1). In our laboratory, mitral anulus velocities are usually, but not always, obtained from the septal anulus. Regional myocardial dysfunction or valvular surgery involving the mitral anulus may affect mitral anulus velocities. A localized disease process, such as lateral myocardial infarction, can result in mitral anulus velocities being lower at the lateral anulus than at the septal anulus.
normal heart with normal myocardial relaxation, E′ increases with an increasing transmitral gradient, increasing preload, exercise, and dobutamine infusion (4,5). However, when myocardial relaxation is impaired because of aging or a disease process, E′ is affected less or even unchanged by preload or transmitral gradient (3,4). Velocities of longitudinal mitral anulus motion are best obtained from apical views. Although various locations of the mitral anulus can be interrogated with TDI, the two most frequently used locations are the septal (or medial) and lateral mitral anulus. Usually, E′ from the lateral anulus is higher (normally >15 cm/s) than that from the medial anulus (normally >10 cm/s) (Fig. 5-1). In our laboratory, mitral anulus velocities are usually, but not always, obtained from the septal anulus. Regional myocardial dysfunction or valvular surgery involving the mitral anulus may affect mitral anulus velocities. A localized disease process, such as lateral myocardial infarction, can result in mitral anulus velocities being lower at the lateral anulus than at the septal anulus.
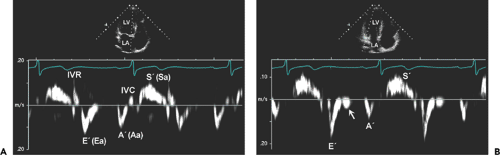 Figure 5-1 Tissue Doppler imaging of the septal (A) and lateral (B) mitral anulus in a normal subject. In tissue Doppler imaging of the anulus, there are three major velocities: systolic velocity (S′ or Sa), E′ (or Ea), and A′ (or Aa). S′ reflects the systolic function of the left ventricle (LV), and E′ and A′ are related to diastolic function of the LV. E′ reflects the status of myocardial relaxation, and the normal value from the medial mitral anulus is more than 10 cm/s and from the lateral anulus, more than 15 cm/s. Arrow, mid-diastolic velocity, which is seen in young normal subjects. IVC, isovolumic contraction; IVR, isovolumic relaxation; LA, left atrium. |
Table 5-1 Comparison of two-dimensional (2D) gray scale and tissue doppler imaging (TDI) | ||||||||||||||||||||||||||||||||||||
|---|---|---|---|---|---|---|---|---|---|---|---|---|---|---|---|---|---|---|---|---|---|---|---|---|---|---|---|---|---|---|---|---|---|---|---|---|
| ||||||||||||||||||||||||||||||||||||
Late diastolic velocity (Aa or A′) of the mitral anulus at the time of atrial contraction increases during early diastolic dysfunction, as is the case for the mitral inflow A wave, but decreases as atrial function deteriorates. A′ has been correlated with left atrial (LA) function (6).
Estimation of Left Ventricular Filling Pressure
LV diastolic filling pressures can be estimated reliably with 2D and Doppler echocardiography. The deceleration time
(DT) of mitral inflow early diastolic velocity (E) has a good inverse correlation with the pulmonary capillary wedge pressure (PCWP) of less than 130 milliseconds usually indicates a PCWP greater than 20 mm Hg. However, mitral inflow DT alone is not highly accurate in patients who have a relatively normal LVEF or atrial fibrillation. Because Ea is reduced in patients with impaired relaxation and is affected less by preload than mitral inflow E, the ratio (E/Ea) between mitral inflow early diastolic velocity and mitral anulus early diastolic velocity increases as PCWP increases (see Chapter 8). Investigations at Baylor College and in our laboratory have demonstrated that PCWP is higher than 20 mm Hg when E/Ea is more than 10 (using the lateral anulus Ea) or 15 (using the medial anulus Ea) (7,8). This ratio works well even in patients who have fused mitral inflow signals, preserved LVEF, and atrial fibrillation (9,10). The only exception is patients with constrictive pericarditis, in whom Ea, especially from the medial anulus, is increased (≥8 cm/s) and E/Ea is reduced with high filling pressures (see Chapter 17). Because PCWP can be estimated reliably with E/Ea, estimation of PCWP with exercise is feasible (5, which is helpful is assessing patients who have exertional dyspnea (see diastolic stress test in Chapter 8).
(DT) of mitral inflow early diastolic velocity (E) has a good inverse correlation with the pulmonary capillary wedge pressure (PCWP) of less than 130 milliseconds usually indicates a PCWP greater than 20 mm Hg. However, mitral inflow DT alone is not highly accurate in patients who have a relatively normal LVEF or atrial fibrillation. Because Ea is reduced in patients with impaired relaxation and is affected less by preload than mitral inflow E, the ratio (E/Ea) between mitral inflow early diastolic velocity and mitral anulus early diastolic velocity increases as PCWP increases (see Chapter 8). Investigations at Baylor College and in our laboratory have demonstrated that PCWP is higher than 20 mm Hg when E/Ea is more than 10 (using the lateral anulus Ea) or 15 (using the medial anulus Ea) (7,8). This ratio works well even in patients who have fused mitral inflow signals, preserved LVEF, and atrial fibrillation (9,10). The only exception is patients with constrictive pericarditis, in whom Ea, especially from the medial anulus, is increased (≥8 cm/s) and E/Ea is reduced with high filling pressures (see Chapter 17). Because PCWP can be estimated reliably with E/Ea, estimation of PCWP with exercise is feasible (5, which is helpful is assessing patients who have exertional dyspnea (see diastolic stress test in Chapter 8).
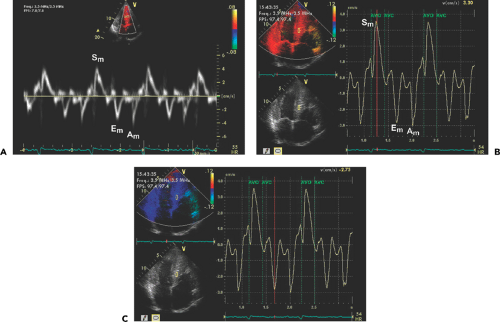 Figure 5-2 Tissue Doppler imaging can be color coded, with red indicating movement of myocardial tissue toward the transducer and blue indicating movement away from the transducer. A: The sample volume was placed in the mid septum, and myocardial tissue velocities of systolic (Sm), early diastolic (Em), and late diastolic (Am) velocities were recorded. Similar velocity patterns can be obtained automatically in a digitized form (B and C). Still image of color-coded tissue Doppler imaging was obtained from the cardiac cycle indicated by the vertical red line during systole (B) and early diastole (C). AVC, aortic valve closure; AVO, aortic valve opening. |
Evaluation of Regional and Global Systolic Function
The extent of systolic movement of the mitral anulus correlates with LV systolic function and stroke volume. Normally, the systolic velocity (Sa or S′) of the mitral anulus is more than 6 cm/s. Although TDI of the mitral anulus reflects the global systolic and diastolic function of the LV, segmental or regional function can be assessed by performing TDI of various LV segments by placing the sample volume (2–5 mm) in the region of interest. The size of the sample volume depends on the location and intensity of the signal and is usually between 2 and 5 mm. Further clinical experience with this variable will determine if Sa (or S′) can replace other more commonly used systolic variables.
Tissue Velocity Gradient
TDI can measure the difference in velocities of adjacent myocardial tissues (velocity gradient), and this can be
used to assess the viability and deformation (strain) of the myocardium (11). The velocity of the endocardium is normally higher than that of the epicardium, thus producing a tissue velocity gradient. In akinetic but viable or nontransmurally infarcted myocardium, the myocardial velocity gradient persists, but there is no velocity gradient in scarred or transmurally infarcted myocardium. Because days to weeks are needed for myocardial contractility to recover after successful reperfusion of an occluded coronary artery, measurement of the tissue velocity gradient can be useful in patients with an acute myocardial infarction. To record or display the myocardial velocity gradient, the direction of myocardial contractility needs to be aligned in parallel with the direction of the ultrasound beam. Therefore, imaging views are limited to the parasternal windows to image anterior or posterior walls.
used to assess the viability and deformation (strain) of the myocardium (11). The velocity of the endocardium is normally higher than that of the epicardium, thus producing a tissue velocity gradient. In akinetic but viable or nontransmurally infarcted myocardium, the myocardial velocity gradient persists, but there is no velocity gradient in scarred or transmurally infarcted myocardium. Because days to weeks are needed for myocardial contractility to recover after successful reperfusion of an occluded coronary artery, measurement of the tissue velocity gradient can be useful in patients with an acute myocardial infarction. To record or display the myocardial velocity gradient, the direction of myocardial contractility needs to be aligned in parallel with the direction of the ultrasound beam. Therefore, imaging views are limited to the parasternal windows to image anterior or posterior walls.
 Figure 5-3 Tissue Doppler imaging, strain rate, and strain imaging from a normal subject. A: The sample volume was placed at the basal portion of the inferior septum. Peak systolic velocity (Sm) was slightly more than 6 cm/s, early diastolic velocity (Em) was 10 cm/s, and late diastolic velocity (Am) was 6 cm/s. B: Recording of strain rate, which represents the rate of deformation; the peak negative strain rate (arrow) was -1.3/s. C: Strain recording, which is the integration of the strain rates; the negative peak strain (arrow) occurred slightly after aortic valve closure (AVC). The normal strain value is usually more than -15%. AVO, aortic valve opening. |
Cardiac Time Intervals
Cardiac time intervals are regulated precisely by the mechanics and functions of the myocytes; hence, these intervals are a good measure of cardiac function. TDI is well suited for determining the timing of myocardial events. The precise timing of these events is helpful in understanding the mechanism of myocardial relaxation and myocardial suction during early diastolic filling (12,13,14). In healthy hearts, in which efficient myocardial relaxation is used effectively to suck blood from the LA into the LV during early diastole, the time of onset of mitral inflow (E) coincides with that of myocardial early diastolic motion (relaxation) of the mitral anulus (Ea). However, in hearts with delayed myocardial relaxation and increased filling pressure, diastolic filling (onset of the E wave) depends more on the increased LA pressure and occurs earlier than the onset of the early diastolic motion of the mitral anulus (Ea). Therefore, the time interval between the onset of mitral E velocity and that of the mitral anulus diastolic motion (Ea) increases, and this increased interval has been proposed as a new variable to assess LV filling pressures (see Chapter 8).
A limitation of measuring cardiac time intervals by pulsed wave Doppler echocardiography is nonsimultaneity because different cardiac cycles are usually needed to measure various intervals which in turn are used together. One solution is to have the capability of obtaining multiple
pulsed wave Doppler recordings simultaneously. Another creative means to measure cardiac intervals from a single cardiac cycle is to use tissue Doppler anatomic color M-mode from the anterior mitral leaflet (15) (Fig. 5-4). From this technique, isovolumic contraction time, isovolumic relaxation time, and LV ejection time can be measured reliably from a single cardiac cycle.
pulsed wave Doppler recordings simultaneously. Another creative means to measure cardiac intervals from a single cardiac cycle is to use tissue Doppler anatomic color M-mode from the anterior mitral leaflet (15) (Fig. 5-4). From this technique, isovolumic contraction time, isovolumic relaxation time, and LV ejection time can be measured reliably from a single cardiac cycle.
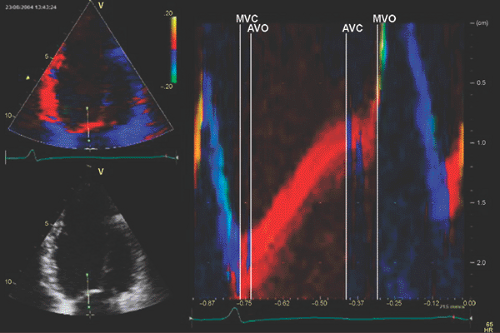 Figure 5-4 Tissue Doppler anatomic M-mode of the anterior mitral leaflet was obtained from color tissue Doppler imaging. Mitral motion recorded the timing of mitral valve closure (MVC), aortic valve opening (AVO), aortic valve closure (AVC), and mitral valve opening (MVO). |
Mechanical dyssynchrony is measured by time intervals between peak ejection systolic velocities or peak strain of multiple myocardial segments, as discussed below.
Evaluation of Thick Walls
The ventricular walls become thick for several reasons including LV hypertrophy, hypertrophic cardiomyopathy, infiltrative cardiomyopathy, restrictive cardiomyopathy, and the athletic heart. These entities can usually be differentiated on the basis of clinical and laboratory findings, but differentiating them can occasionally be difficult. The evaluation of myocardial relaxation with TDI is able to distinguish between a thick athletic normal heart and other disease conditions (16). Mitral anulus motion is well preserved in the athletic heart because myocardial relaxation is preserved, but it is reduced in all other conditions that have impaired myocardial relaxation.
Prognostication
Because E/Ea can estimate LV filling pressures and patients with increased filling pressures have higher rates of morbidity and mortality, it is expected that a high E/Ea predicts a poor outcome. E/Ea more than 15 was found to be associated with increased mortality of patients with acute myocardial infarction (17). By itself, Ea is also a good predictor for clinical outcome. In various clinical conditions, patients who have an Ea less than 5 cm/s are more likely to have a much higher mortality than those with an Ea more than 5 cm/s (18).
Strain and Strain Rate Imaging
Myocardial velocities measured with TDI may be overestimated or underestimated by translational motion or tethering of the myocardium, respectively. This limitation can be overcome by measuring the actual extent of myocardial deformation (stretching or contraction) by strain (ε) and strain rate imaging (Fig. 5-3). Strain rate is the rate of change in length calculated as the difference between two velocities normalized to the distance between them; it is expressed as seconds-1 (19,20,21,22) (Fig. 5-5). By convention, shortening is represented by negative values and lengthening by positive values for both strain and strain rate:
Strain rate = (Va – Vb)/d
where Va – Vb is the instantaneous velocity difference at points a and b, and d is the distance between the two points.
Strain (ε) is the percentage change in length during myocardial contraction and relaxation and is expressed as a percentage:
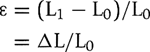
where L0 is the original length, L1 is the final length, and Δ L is the change in length.
Strain can be derived echocardiographically by the following:
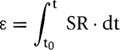
where strain (ε) is the sum of the instantaneous strain rate (SR) values from starting time (t0) to ending time (t).
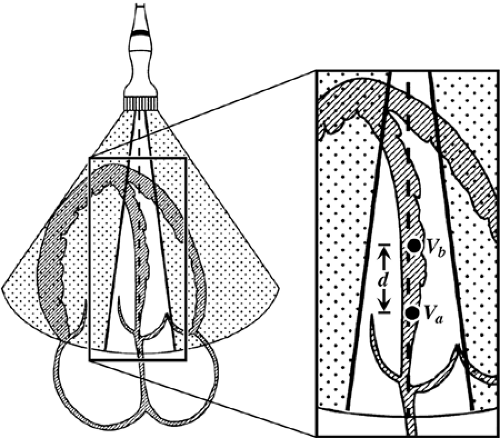 Figure 5-5 Diagram of the concept of strain imaging. A narrow sector width was used to attempt to align the direction of myocardial movement in parallel with the direction of the ultrasound beam. (See text for details about how to obtain strain and strain rate.) |
Tissue tracking, also known as displacement, is similar to strain, except it is the integral of the tissue velocity over a given time. It represents the distance a region of interest moves relative to its original location (Fig. 5-6).
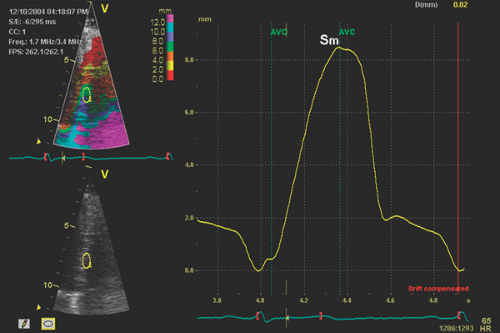 Figure 5-6 Tissue tracking imaging. The displacement of the tissue was color coded. The sample volume was placed at the mid portion of the septum, and tissue tracking demonstrated green and purple colors in the region of interest, corresponding to 6 to 8 mm of displacement since the starting time demarcated by the first red bracket on the ECG tracing. AVC, aortic valve closure; AVO, aortic valve opening; Sm, peak systolic velocity. |
In the normal heart, longitudinal strain rate values are similar from the base to the apex, unlike tissue velocity, which is higher at the base than at the apex (23). Every effort is made to ensure that the direction of tissue movement is less than 30 degrees from the direction of the beam (Fig. 5-7), but this is technically challenging in the apical segments as the angle becomes wider (21,22). The narrow-sector angle approach on an individual wall obviates some of the above problems, which precludes concurrent comparison of contralateral segments.
Strain imaging is similar to measuring the myocardial velocity gradient, which is limited to analyzing the myocardium that contracts in the direction that is parallel with the ultrasound beam. However, better spatial resolution and a higher frame rate (up to 200 frames/s) in strain rate imaging allow simultaneous calculation of the strain rate of the myocardium within a selected sector, which can be color coded (Fig. 5-3). A curved cursor can be placed along the entire circumference of the LV to analyze regional strain rate. However, accurate measurements of strain rate depend on properly aligning the ultrasound beam so it is parallel with the direction of myocardial motion.
Detection of Myocardial Ischemia
Regional strain and strain rate are disturbed during the early stage of myocardial ischemia. Some studies have suggested that strain imaging is more sensitive for detecting acute ischemia than regional wall motion analysis (23,24). It has been shown that the longitudinal peak regional strain and strain rate decrease as wall motin worsens in patients with an acute myocardial infarction. During balloon inflation, systolic strain imaging has been shown to be more sensitive for detecting myocardial ischemia than TDI. This better sensitivity of strain rate imaging has also been shown during dobutamine stress echocardiography (25). An interesting observation during ischemia is regional delay in the onset of myocardial motion, which is difficult to identify visually (24). In acute ischemia, the transition from regional systole to early diastolic lengthening is delayed. When a time delay of more than 20% was used, it identified ischemic myocardium during dobutamine stress echocardiography with a sensitivity of 92% and a specificity of 75% (26). However, its main limitations are additional time in analysis, gain dependency, and variability. Whether this quantitative assessment provides incremental diagnostic value is not certain, especially when the physician who is interpreting stress echocardiograms is experienced in regional wall motion analysis.
Assessment of Myocardial Viability
The myocardial velocity gradient can be used to differentiate viable from nonviable myocardium in patients with an acute myocardial infarction treated with acute reperfusion (11). It has been observed that myocardial contraction occurs even after closure of the aortic valve, called postsystolic shortening (27,28). This can be an indication of asynchronous motion during the isovolumic relaxation period. TDI and strain imaging are able to demonstrate this unusual cardiac motion (Fig. 5-8


Stay updated, free articles. Join our Telegram channel
Full access? Get Clinical Tree
