Increased plasma concentrations of C-reactive protein (CRP) independently predict future atherothrombotic events in healthy asymptomatic adults. CRP may promote atherothrombosis by altering fibrinolytic balance; however, the influence of increased plasma CRP concentrations on endothelial fibrinolysis in healthy adults is unclear. We tested the hypothesis that endothelial release of tissue-type plasminogen activator (t-PA) is impaired in adults with increased plasma CRP concentrations independent of other cardiometabolic risk factors. Fifty-four healthy adults were studied: 24 with CRP <1.0 mg/L (low CRP; 18 men and 6 women, 55 ± 2 years old), 18 with CRP 1.0 to 3.0 mg/L (moderate CRP; 8 men and 10 women, 58 ± 2 years old), and 12 with CRP >3.0 mg/L (high CRP; 7 men and 5 women, 56 ± 2 years old). Net endothelial release of t-PA was determined in vivo in response to intrabrachial infusions of bradykinin (125 to 500 ng/min) and sodium nitroprusside (2.0 to 8.0 μg/min). Capacity of the endothelium to release t-PA was significantly lower (∼30%) in the high (0.32 ± 0.5 to 38.9 ± 6.0 ng · 100 ml tissue −1 · min −1 ) and moderate (−0.05 ± 0.4 to 39.3 ± 5.2 ng · 100 ml tissue −1 · min −1 ) compared to the low (0.42 ± 0.9 to 61.8 ± 5.2 ng · 100 ml tissue −1 · min −1 ) CRP group. There was no significant difference in t-PA release between the high and moderate CRP groups. Plasma CRP concentrations were inversely related to t-PA release (r = −0.38, p <0.05). In conclusion, these results indicate that the capacity of the endothelium to release t-PA is decreased in adults with plasma CRP ≥1.0 mg/L. Endothelial fibrinolytic dysfunction may underlie the increased atherothrombotic risk associated with increases in plasma CRP concentrations in otherwise healthy adults.
We tested the hypothesis that the capacity of the endothelium to acutely release tissue-type plasminogen activator (t-PA) is impaired in adults with increased plasma C-reactive protein (CRP) concentrations independent of other cardiometabolic risk factors. To address this hypothesis we employed an isolated forearm model to assess endothelial t-PA release in vivo in adults with a range of plasma CRP concentrations.
Methods
Fifty-four sedentary adults (33 men and 21 women) were studied: 24 with CRP <1.0 mg/L (low CRP; 18 men and 6 women, 55 ± 2 years old), 18 with CRP 1.0 to 3.0 mg/L (moderate CRP; 8 men and 10 women, 58 ± 2 years old), and 12 with CRP >3.0 mg/L (high CRP; 7 men and 5 women, 56 ± 2 years old). CRP classification tertiles were based on published guidelines regarding plasma CRP concentrations and associated cardiovascular risk. All subjects were normotensive (arterial blood pressure ≤140/90 mm Hg) and free of overt cardiovascular and metabolic disease as assessed by medical history, physical examination, fasting blood chemistries, and electrocardiograms and blood pressure at rest and during incremental exercise performed to exhaustion. None of the subjects smoked, were taking medications (including vitamins), or had performed regular physical exercise for ≥1 year before the start of the study. Before participation all the subjects had the research study and its potential risks and benefits explained fully before providing written informed consent according to guidelines of the University of Colorado at Boulder. This study was approved by the institutional review board of the University of Colorado at Boulder and all experiments conformed with principles outlined in the Declaration of Helsinki.
Body mass was measured to the nearest 0.1 kg. Percent body fat was determined by dual-energy x-ray absorptiometry (Lunar Radiation Corporation, Madison, Wisconsin). Body mass index was calculated as weight (kilograms) divided by height (meters) squared. Minimal waist circumference was measured according to published guidelines. Fasting plasma lipid, lipoprotein, glucose, and insulin concentrations were determined using standard techniques by the clinical laboratory affiliated with the Clinical Translational Research Center at the University of Colorado at Boulder.
Blood samples for the determination of circulating levels of CRP were collected in chilled tubes containing ethylenediaminetetra-acetic acid using minimal venostasis after a 12-hour overnight fast. Plasma concentrations of high-sensitivity CRP were determined in duplicate by enzyme immunoassay (Alpco, Salem, New Hampshire). Intra- and interassay coefficients of variation were <7% and <8%, respectively.
All measurements of endothelial fibrinolytic function were performed in a temperature-controlled room from 7 to 10 a . m . after an overnight fast as previously described by our laboratory. Briefly, an intravenous catheter was placed in a deep antecubital vein of the nondominant arm. Thereafter a 5-cm 20-gauge catheter was introduced into the brachial artery of the same arm under local anesthesia (1% lidocaine). Forearm blood flow (FBF) was measured using strain-gauge venous occlusion plethysmography and presented as milliliters per 100 ml forearm volume per minute. After measurement of blood flow at rest for 5 minutes, bradykinin was infused intra-arterially at rates of 12.5, 25, and 50 ng · 100 ml tissue −1 · min −1 and sodium nitroprusside at 1.0, 2.0, and 4.0 μg · 100 ml tissue −1 · min −1 for 5 minutes at each dose. To avoid an order effect, the sequence of drug administration was randomized.
Net endothelial release of t-PA antigen and plasminogen activator inhibitor-1 (PAI-1) antigen in response to bradykinin and sodium nitroprusside was calculated according to the method of Jern et al using the equation: net release = (C v − C a ) × (FBF × [101 − hematocrit/100]), where C v and C a represent concentrations in the vein and artery, respectively. For t-PA and PAI-1 a positive difference indicated a net release and a negative difference indicated net uptake. Arterial and venous blood samples were collected simultaneously at baseline and the end of each drug dose. Enzyme immunoassay was used to determine t-PA and PAI-1 antigen concentrations. Hematocrit was measured in triplicate using the standard microhematocrit technique and corrected for trapped plasma volume within the erythrocytes. Total amount of t-PA antigen released across the forearm in response to bradykinin was calculated as the incremental area under each curve using a trapezoidal model. To avoid confounding effects from potential infection or acute inflammation on fibrinolytic function, all subjects were free of recent infection/inflammation (>2 weeks) as determined by questionnaire.
Differences in subject baseline characteristics and area under the curve data were determined by between-groups analysis of variance. Group differences in FBF and endothelial t-PA and PAI-1 antigen release in response to bradykinin and sodium nitroprusside were determined by repeated-measures analysis of variance. When indicated by a significant F value a post hoc test using the Newman–Keuls method was performed to identify differences between groups. Relations between variables of interest were assessed by Pearson correlation coefficient and linear regression analysis. There were no significant gender interactions in any primary outcome variable; therefore data were pooled and presented together. Because of the skewed distribution of plasma CRP concentrations, data were log-transformed to satisfy basic assumptions for parametric testing. However, in accord with joint American College of Cardiology and Centers for Disease Control recommendations, absolute values for CRP are presented to facilitate clinical interpretation. All data are expressed as mean ± SEM. Statistical significance was set a priori at a p value <0.05.
Results
Selected subject characteristics are presented in Table 1 . By design plasma CRP concentrations were significantly different between groups. Plasma CRP concentrations were ∼300% higher (p <0.05) in the moderate than the in low CRP group and ∼400% and ∼1,200% higher (p <0.05 for the 2 comparisons) in the high compared to the moderate and low CRP groups, respectively. There were no differences in any anthropometric, hemodynamic, or metabolic variables among groups.
| Variable | Low CRP (<1.0 mg/L) | Moderate CRP (1.0–3.0 mg/L) | High CRP (>3.0 mg/L) |
|---|---|---|---|
| (n = 24) | (n = 18) | (n = 12) | |
| Men/women | 18/6 | 8/10 | 7/5 |
| C-reactive protein (mg/L) | 0.53 ± 0.04 | 1.61 ± 0.13 ⁎ | 6.08 ± 0.58 ⁎ † |
| Age (years) | 55 ± 2 | 58 ± 2 | 56 ± 2 |
| Body mass (kg) | 81.8 ± 3.2 | 82.8 ± 3.1 | 86.0 ± 3.6 |
| Body mass index (kg/m 2 ) | 27.1 ± 0.8 | 28.2 ± 0.8 | 28.4 ± 0.8 |
| Body fat (%) | 30.2 ± 2.0 | 34.8 ± 1.6 | 34.2 ± 2.0 |
| Waist circumference (cm) | 96.0 ± 2.6 | 97.8 ± 2.3 | 97.0 ± 3.6 |
| Systolic blood pressure (mm Hg) | 123 ± 2 | 117 ± 2 | 117 ± 3 |
| Diastolic blood pressure (mm Hg) | 78 ± 2 | 76 ± 2 | 75 ± 2 |
| Total cholesterol | |||
| mmol/L | 4.9 ± 0.2 | 4.7 ± 0.2 | 4.8 ± 0.2 |
| mg/dl | 187.9 ± 6.9 | 182.7 ± 8.9 | 185.0 ± 8.3 |
| Low-density lipoprotein cholesterol | |||
| mmol/L | 3.1 ± 0.1 | 2.9 ± 0.2 | 2.9 ± 0.2 |
| mg/dl | 118.4 ± 5.7 | 112.3 ± 8.0 | 113.1 ± 7.4 |
| High-density lipoprotein cholesterol | |||
| mmol/L | 1.3 ± 0.1 | 1.3 ± 0.1 | 1.2 ± 0.1 |
| mg/dl | 49.4 ± 2.6 | 51.7 ± 2.8 | 45.3 ± 3.6 |
| Triglycerides | |||
| mmol/L | 1.2 ± 0.1 | 1.1 ± 0.1 | 1.5 ± 0.2 |
| mg/dl | 101.0 ± 10.9 | 93.4 ± 7.6 | 133.1 ± 17.8 |
| Glucose (mmol/L) | 5.1 ± 0.1 | 5.2 ± 0.1 | 5.4 ± 0.2 |
| Insulin (pmol/L) | 35.4 ± 3.1 | 41.2 ± 4.0 | 44.0 ± 5.7 |
⁎ p <0.05 versus low C-reactive protein.
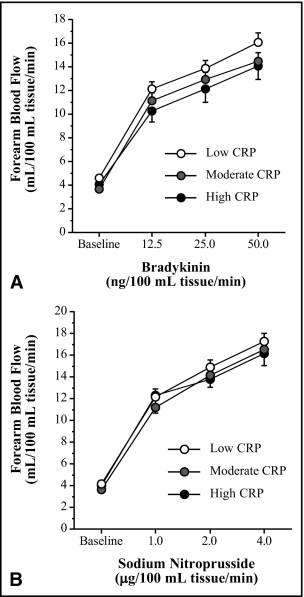
FBF responses to bradykinin were not different among the low (4.7 ± 0.3 to 16.1 ± 0.8 ml · 100 ml tissue −1 · min −1 ), moderate (3.7 ± 0.2 to 14.5 ± 0.8 ml · 100 ml tissue −1 · min −1 ), and high (4.1 ± 0.3 to 14.1 ± 1.1 ml · 100 ml tissue −1 · min −1 ) CRP groups ( Figure 1 ) . Similarly, there were no group differences in the FBF responses to sodium nitroprusside ( Figure 1 ). FBF in the noninfused arm remained constant throughout the infusion protocols and did not differ significantly among groups.
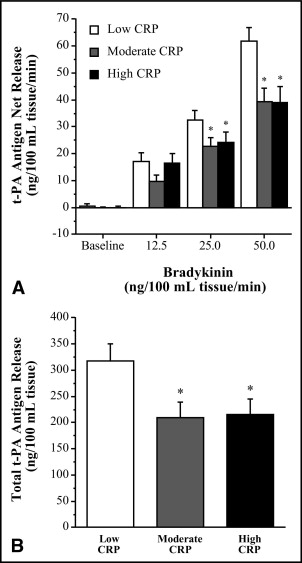
Basal endothelial t-PA antigen release was not significantly different among groups. However, compared to the low CRP group, the capacity of the endothelium to release t-PA in response to bradykinin was significantly blunted in the moderate and high CRP groups. Net release of t-PA antigen was ∼35% lower (p <0.05) in the moderate (from −0.1 ± 0.4 to 39.3 ± 5.1 ng · 100 ml tissue −1 · min −1 ) and high (from 0.1 ± 0.5 to 38.9 ± 6.0 ng · 100 ml tissue −1 · min −1 ) compared to the low (from 0.4 ± 0.9 to 61.8 ± 5.2 ng · 100 ml tissue −1 · min −1 ) CRP group ( Figure 2 ) . As a result the total amount of t-PA antigen released (area under the bradykinin curve) was markedly lower (∼30%, p <0.05) in the moderate (209 ± 30 ng/100 ml tissue) and high (216 ± 30 ng/100 ml tissue) compared to the low (318 ± 33 ng/100 ml tissue) CRP group ( Figure 2 ). There was a significant inverse relation between CRP and peak t-PA release to bradykinin (r = −0.38) in the overall study population ( Figure 3 ) . Sodium nitroprusside did not stimulate significant changes in t-PA release in the low (from −0.2 ± 0.4 to 1.2 ± 2.2 ng · 100 ml tissue −1 · min −1 ), moderate (from 1.8 ± 1.4 to 3.9 ± 2.0 ng · 100 ml tissue −1 · min −1 ) or high (from −0.4 ± 1.0 to 4.0 ± 3.5 ng · 100 ml tissue −1 · min −1 ) CRP groups. Neither bradykinin nor sodium nitroprusside elicited significant changes in PAI-1 antigen release in any group (data not shown).