The Right Heart


The Right Heart


The right heart tends to be a relatively neglected part of the standard transthoracic echo study, because:


  • much of the right heart lies behind the sternum, making it difficult to image using ultrasound


  • the anatomy and orientation of the right heart is relatively complex, compared with the left


  • the right ventricle (RV) is trabeculated, which makes accurate measurements difficult.

Nonetheless, an assessment of right heart dimensions and function is an essential part of the standard echo study, not only to detect primary right heart disorders but also because right heart size and function can reveal a great deal about disorders affecting other parts of the heart (e.g. mitral valve disease, atrial septal defect (ASD)).


RIGHT ATRIUM

The right atrium (RA) receives venous blood returning from the upper body (via the superior vena cava, SVC), the lower body (via the inferior vena cava, IVC) and also from the myocardium (via the coronary sinus). It can best be seen in:


When studying the RA, assess and describe:


  • RA size


  • RA pressure


  • normal variants (Eustachian valve/Chiari network)


  • presence or absence of masses (tumour/thrombus)


  • presence or absence of a pacing wire or venous catheter.


Right atrial size

Assessment of 
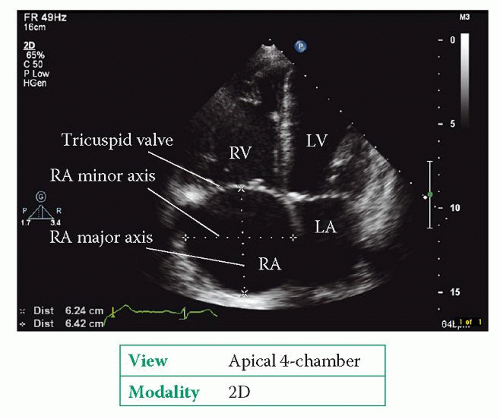
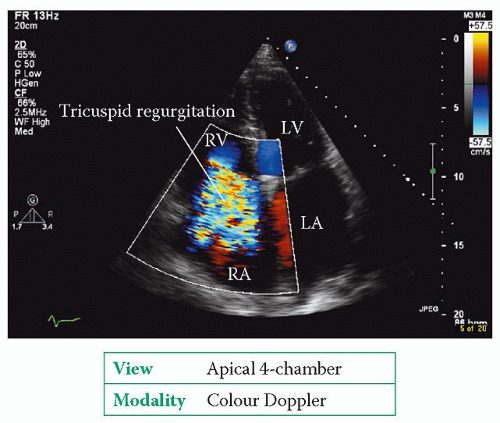
RA size can be challenging in view of the difficulty in imaging it clearly. In an apical 4-chamber view you can simply ‘eyeball’ the relative sizes of the left and right atria. The RA is normally no larger than the left – if it is larger, it is dilated.

To quantify RA size, in the modified apical 4-chamber view at end-diastole measure the RA minor axis from the lateral wall of the RA to the interatrial septum (perpendicular to the RA major axis, Fig. 21.1). A RA minor axis >4.4 cm or a RA major axis >5.3 cm is indicative of RA dilatation. Alternatively, perform planimetry
of the RA in the modified apical 4-chamber view – a dilated RA is indicated by an area >18 cm2. Calculation of RV volume is not recommended as there are few data on normal ranges.


Figure 21.1 Measurement of right atrial dimensions (LA = left atrium; LV = left ventricle; RA = right atrium; RV = right ventricle)

RA dilatation can result from RA pressure overload (e.g. pulmonary hypertension, restrictive cardiomyopathy, tricuspid stenosis), RA volume overload (e.g. tricuspid regurgitation, ASD) and chronic atrial fibrillation (AF).


Right atrial pressure

There are a number of ways of assessing RA pressure (RAP):

1. The RAP can be gauged by examining the patient’s neck to assess their jugular venous pressure (JVP) – with the patient reclining supine at 45°, the height of the JVP above the sternal angle (in cm) is the same as RAP (in mmHg). However, the height of the JVP can be tricky to assess, particularly if the JVP is not clearly visible or if it is very high or low.

2. A ‘constant’ value of 10 mmHg can be ‘assumed’ as the RAP. However, RAP does vary, and so using a ‘constant’ value is rather a blunt instrument and can be potentially misleading.
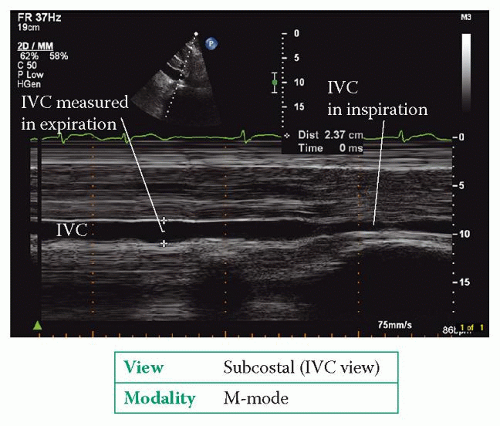
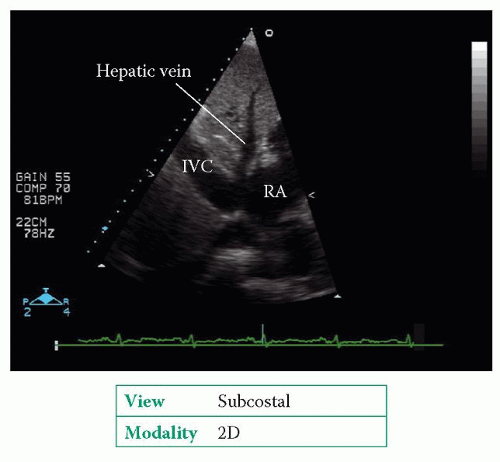
3. The RAP can be estimated measuring the IVC diameter in both expiration and inspiration, using the subcostal window (Fig. 21.2). Normally the IVC measures 1.5-2.5 cm in diameter and decreases by >50 per cent in inspiration. The data in Table 21.1 will allow you to place an approximate value on RAP. For example, if the IVC measures 2.8 cm in expiration and 1.8 cm in inspiration, a reduction of 36 per cent, the RAP would be estimated at 15-20 mmHg.

4. The American Society of Echocardiography recommends using absolute values for RAP rather than ranges, thus:


a. an IVC measuring ≤2.1 cm which collapses by >50 per cent on inspiration indicates an RA pressure of 3 mmHg

b. an IVC measuring >2.1 cm that collapses by <50 per cent on inspiration indicates an RA pressure of 15 mmHg

c. an intermediate RA pressure of 8 mmHg may be used in situations outside these parameters (or other indicators of RA pressure can be used).


Figure 21.2 Measurement of inferior vena cava (IVC) diameter


Table 21.1 Assessment of right atrial pressure (RAP)


IVC size (cm)


IVC change with inspiration


Estimated RAP (mmHg)


Small (<1.5 cm)


Collapse


0-5


Normal (1.5-2.5 cm)


Decreased by >50%


5-10


Normal (1.5-2.5 cm)


Decreased by <50%


10-15


Dilated (>2.5 cm)


Decreased by <50%


15-20


Dilated (>2.5 cm)


No change


>20


IVC, inferior vena cava.


Reference ranges reproduced with permission of the British Society of Echocardiography and British Heart Foundation.


One further indicator of RAP is RA size, which is usually normal when RAP is ≤10 mmHg, but becomes dilated at pressures above this (and, in general, the higher the RAP, the greater the dilatation). Similarly, the hepatic veins become increasingly dilated as RAP rises above 15 mmHg.


Eustachian valve and Chiari network

Where the IVC enters the RA there is often an embryological remnant, the Eustachian valve, which in fetal life directs oxygenated blood away from the tricuspid valve and towards the foramen ovale. The Eustachian valve can remain prominent in adult life and is a normal finding, but can be mistaken for a mass, thrombus or vegetation.

Similarly, a Chiari network is a fetal remnant and appears as a web-like structure extending into the RA with an attachment near the RA-IVC junction. It is present in around 2 per cent of the population as a normal variant but can be mistaken for a more sinister lesion.

Usually neither a prominent Eustachian valve nor a Chiari network is of any clinical significance, although there is some evidence that either remnant in combination with a patent foramen ovale may increase the risk of paradoxical (right-to-left) embolism.


Right atrial masses

Cardiac tumours and thrombi are described in Chapter 27. Renal cell carcinoma can extend from the kidney all the way up the IVC and into the RA.


TRICUSPID VALVE

The tricuspid valve can best be seen in:


Tricuspid stenosis

Tricuspid stenosis is most commonly a consequence of previous rheumatic fever, and usually occurs together with mitral stenosis (indeed it is important not to ‘miss’ coexistent tricuspid stenosis in patients undergoing surgery for mitral stenosis). Rheumatic thickening of the tricuspid leaflets tends to be subtler than that of the mitral leaflets and so is harder to spot. Rarer causes of tricuspid stenosis include:


  • carcinoid syndrome


  • Ebstein’s anomaly (see Chapter 28)


  • ‘functional’ tricuspid stenosis as a result of obstruction of the valve by a large RA tumour, thrombus or vegetation.

Patients may present with fatigue, peripheral oedema or symptoms relating to an underlying cause (e.g. flushing in carcinoid syndrome) or coexistent condition (e.g. mitral stenosis). Physical signs include a prominent ‘a’ wave in the JVP, a tricuspid opening snap and a diastolic murmur at the left sternal edge.


Figure 21.3 Normal tricuspid valve (LA = left atrium; RA = right atrium; AV = aortic valve; RVOT = right ventricular outflow tract)


Echo assessment of tricuspid stenosis


2D and M-mode

Use 2D and M-mode echo to assess the structure of the valve:


  • Is the tricuspid valve normal, rheumatic or myxomatous?


  • Is there evidence of Ebstein’s anomaly (p. 289)?


  • Are the valve leaflets (anterior, posterior, septal) normal? Is there thickening, and does this affect the tips or the body of the leaflet(s)?


  • Is there leaflet calcification, and is this focal (anterior, posterior, septal) or diffuse?


  • Is leaflet mobility normal or reduced? How much is it reduced?


  • Is there any doming or prolapse of the leaflets?


  • Is there any evidence of papillary muscle rupture?


  • Are there any tricuspid valve vegetations or abscesses?


  • Is the tricuspid annulus normal, dilated or calcified?

The normal tricuspid annulus in adults has a diameter of 28±5 mm in the modified apical 4-chamber view. Significant dilatation is defined by a diastolic annular diameter >35 mm (or, when indexed for body surface area, >21 mm/m2).


Colour Doppler

Use colour Doppler to look for any coexistent tricuspid regurgitation. The colour jet can also help in obtaining correct alignment of the probe for continuous wave (CW) and pulsed-wave (PW) Doppler recordings.


CW and PW Doppler

Use Doppler to record forward flow through the tricuspid valve from a modified apical 4-chamber view. Ignore traces obtained from ectopic beats (and the beat following an ectopic), and if the patient is in AF, average the measurements taken from several beats. From the trace, measure the mean tricuspid valve gradient (trace the velocity time integral (VTI) of the tricuspid inflow).


Severity of tricuspid stenosis

Severity of tricuspid stenosis can be quantified by:


  • mean tricuspid gradient


  • tricuspid valve area.

The calculation of tricuspid valve area is somewhat controversial – estimation of valve area from pressure half-time (as for mitral stenosis) is not as well validated for tricuspid stenosis and many authors advise against using it for the tricuspid valve. If you do wish to use it, it can be calculated from:


Table 21.2 summarizes the echo indicators of tricuspid stenosis severity.


Tricuspid regurgitation

Tricuspid regurgitation is the flow of blood from the RV back through the tricuspid valve during systole. Tricuspid regurgitation can result from dysfunction of the
tricuspid valve leaflets or their supporting structure. A trace amount of tricuspid regurgitation, in the absence of any structural heart disease, is a common finding in around 70 per cent of normal individuals. More significant tricuspid regurgitation can be the result of:


Table 21.2 Indicators of tricuspid stenosis severity


Normal


Severe


Tricuspid mean gradient (mmHg)


≥5


Tricuspid valve area (cm2)


>7.0


<1.0


Reference ranges reproduced with permission of the British Society of Echocardiography and British Heart Foundation.


  • rheumatic valve disease


  • carcinoid syndrome


  • infective endocarditis


  • tricuspid valve prolapse


  • Ebstein’s anomaly (Chapter 28)


  • tricuspid annular dilatation (‘functional’ tricuspid regurgitation, secondary to RV dilatation).

The presence of a pacing wire which passes through the tricuspid valve can also lead to a degree of regurgitation, by preventing full closure of the valve leaflets.

Significant tricuspid regurgitation can cause symptoms and signs of right-sided heart failure, with a prominent V wave in the jugular venous pressure, peripheral oedema, ascites and a distended pulsatile liver.


Echo assessment of tricuspid regurgitation


2D and M-mode

Use 2D and M-mode echo to assess the structure of the valve as described for tricuspid stenosis (above). Remember to look at the whole valve apparatus (tricuspid annulus, papillary muscles and chordae), not just the leaflets.


Colour Doppler

Use colour Doppler to examine the jet of tricuspid regurgitation in the parasternal and apical (Fig. 21.4) views. Describe:


  • the extent of the regurgitant jet within the RA (trace the area of the jet in the modified apical 4-chamber view)


  • the position of the jet in relation to the tricuspid leaflets (e.g. central jet, or evidence of regurgitation through a leaflet perforation)


    Figure 21.4 Severe tricuspid regurgitation (LA = left atrium; RA = right atrium; LV = left ventricle; RV = right ventricle)


  • the direction of travel of the regurgitant jet within the atrium (central or directed towards the interatrial septum or the RA free wall).

Measure the width of the vena contracta (VC) – the narrowest region of colour flow at the level of the tricuspid valve – in the modified apical 4-chamber view and with the Nyquist limit set at 50-60 cm/s.


CW and PW Doppler

Record the CW Doppler trace with the probe carefully aligned with the direction of the regurgitant jet (Fig. 21.5). The CW Doppler trace is soft in mild tricuspid regurgitation and denser in moderate or severe regurgitation. Look at the contour of the regurgitant jet – in mild tricuspid regurgitation the shape of the waveform is parabolic, but in severe regurgitation the shape becomes more triangular with an early peak.

The peak velocity of the tricuspid regurgitant jet reflects RV systolic pressure and can be used to calculate pulmonary artery systolic pressure (see below).

Use PW Doppler to assess hepatic vein flow, ideally in the central hepatic vein, in the subcostal window (Fig. 21.6). Hepatic vein flow is normally directed towards the RA throughout the cardiac cycle, with the systolic component being predominant. Systolic hepatic vein flow becomes blunted in moderate tricuspid regurgitation and reversed in severe regurgitation.


PISA assessment

The proximal isovelocity surface area (PISA) principle can be used for tricuspid regurgitation as for mitral regurgitation (Chapter 20):

1. Using colour Doppler in the modified apical 4-chamber view, narrow down the sector width and minimize the depth before zooming in on the location of the regurgitant jet through the tricuspid valve. Adjust the aliasing velocity by adjusting the zero point on the colour flow scale until you see a clear hemisphere of converging blood flow on the ventricular side of the valve, usually at a setting of 20-40 cm/s. There should be a clear interface between red- and blue-coloured flow, and the velocity of blood flow at this point equals the aliasing velocity (in cm/s).


Figure 21.5 Moderate tricuspid regurgitation (TR), showing measurement of peak velocity (TR Vmax) (PG = pressure gradient)


Figure 21.6 Hepatic veins (IVC = inferior vena cava; RA = right atrium)

2. Measure the radius (r) of this hemisphere by taking a measurement from the edge of the hemisphere (i.e. the red-blue interface) to the centre of the valve orifice. Use this to calculate PISA, the surface area of this hemisphere, in cm2:

PISA = 2πr2

3. The regurgitant flow rate, in mL/s, can be calculated from:

Regurgitant flow rate = PISA × Aliasing velocity

For the purposes of estimating severity, it is sufficient just to measure the PISA radius. A radius >0.9 cm indicates severe regurgitation. Do not use the PISA technique if a clear symmetrical hemisphere cannot be obtained or if the jet of tricuspid regurgitation is eccentric.


Associated features

If tricuspid regurgitation is present:


  • assess any coexistent tricuspid stenosis


  • assess any coexistent disease affecting the other valves (as patients undergoing tricuspid valve surgery may also require any other valvular abnormalities to be corrected at the same time)


  • assess the size of the RA, RV and IVC – these chambers are usually dilated if tricuspid regurgitation is severe


  • assess RV dimensions and function


  • calculate pulmonary artery systolic pressure (see below) to assess if there is pulmonary hypertension.


Severity of tricuspid regurgitation

Severity of tricuspid regurgitation can be assessed by:


  • jet area


  • VC width


  • PISA radius


  • CW Doppler jet density/contour


  • RA/RV/IVC size


  • hepatic vein flow.

Table 21.3 summarizes the echo indicators of tricuspid regurgitation severity.


Table 21.3 Indicators of tricuspid regurgitation severity


Mild


Moderate


Severe


2D


RA/RV/IVC size


Normal


Normal/dilated


Usually dilated


Colour Doppler


Jet area (cm2)


<5


5-10


>10


Vena contracta width (cm)


Not defined


<0.7


≥0.7


PISA radius (cm)


≤0.5


0.6-0.9


>0.9


CW Doppler


CW jet density


Soft


Dense


Dense


CW jet contour


Parabolic


Variable


Triangular early peaking


PW Doppler


Hepatic vein flow


Systolic dominance


Systolic blunting


Systolic reversal


CW, continuous wave; IVC, inferior vena cava; PISA, proximal isovelocity surface area; RA, right atrium; RV, right ventricle.


Reference ranges reproduced with permission of the British Society of Echocardiography and British Heart Foundation.


Management of tricuspid regurgitation

Treatment with diuretics will provide symptomatic relief for patients with symptoms of fluid overload secondary to tricuspid regurgitation. Surgical repair/replacement may be necessary for severe tricuspid regurgitation (particularly in combination with surgery for coexistent mitral valve disease), or if the valve is abnormal because of infective endocarditis or Ebstein’s anomaly.


RIGHT VENTRICLE

The RV can be challenging to assess by echo because of its shape and extensive trabeculation.

The RV can best be seen in:


To obtain an optimal view of the right ventricle, the ‘standard’ apical 4-chamber view can be adjusted slightly to centre the right heart on the screen and to ensure that there is no foreshortening. This is known as the ‘modified’ apical 4-chamber view.

An RV assessment includes:


  • RV dimensions


    • cavity size


    • wall thickness


  • global systolic function


  • regional systolic function


  • RV masses or thrombus (see Chapter 27).

Only gold members can continue reading. Log In or Register to continue

Stay updated, free articles. Join our Telegram channel

Jun 5, 2016 | Posted by in CARDIOLOGY | Comments Off on The Right Heart

Full access? Get Clinical Tree

Get Clinical Tree app for offline access