OBJECTIVES
The student understands the basic principles of cardiovascular transport and its role in maintaining homeostasis:
![]() Identifies the factors that determine transport of substances within the vascular system and those that determine diffusion across the capillary wall.
Identifies the factors that determine transport of substances within the vascular system and those that determine diffusion across the capillary wall.
![]() Describes how capillary wall permeability to a solute is related to the size and lipid solubility of the solute.
Describes how capillary wall permeability to a solute is related to the size and lipid solubility of the solute.
![]() Lists the factors that influence transcapillary fluid movement and, given data, predicts the direction of transcapillary fluid movement.
Lists the factors that influence transcapillary fluid movement and, given data, predicts the direction of transcapillary fluid movement.
![]() Describes the lymphatic vessel system and its role in preventing fluid accumulation in the interstitial space (ie, edema).
Describes the lymphatic vessel system and its role in preventing fluid accumulation in the interstitial space (ie, edema).
The student understands the physical factors that regulate blood flow through and blood volume in the various components of the vasculature:
![]() Given data, calculates the vascular resistances of networks of vessels arranged in parallel and in series.
Given data, calculates the vascular resistances of networks of vessels arranged in parallel and in series.
![]() Describes differences in the blood flow velocity in the various vascular segments and how these differences are related to their total cross-sectional area.
Describes differences in the blood flow velocity in the various vascular segments and how these differences are related to their total cross-sectional area.
![]() Describes laminar and turbulent flow patterns and the origin of flow sounds in the cardiovascular system.
Describes laminar and turbulent flow patterns and the origin of flow sounds in the cardiovascular system.
![]() Identifies the approximate percentage of the total blood volume that is contained in the various vascular segments in the systemic circulation.
Identifies the approximate percentage of the total blood volume that is contained in the various vascular segments in the systemic circulation.
![]() Defines peripheral venous pool and central venous pool.
Defines peripheral venous pool and central venous pool.
![]() Describes the pressure changes that occur as blood flows through a vascular bed and relates them to the vascular resistance of the various vascular segments.
Describes the pressure changes that occur as blood flows through a vascular bed and relates them to the vascular resistance of the various vascular segments.
![]() States how the resistance of each consecutive vascular segment contributes to an organ’s overall vascular resistance and, given data, calculates the overall resistance.
States how the resistance of each consecutive vascular segment contributes to an organ’s overall vascular resistance and, given data, calculates the overall resistance.
![]() Defines total peripheral resistance (systemic vascular resistance) and states the relationship between it and the vascular resistance of each systemic organ.
Defines total peripheral resistance (systemic vascular resistance) and states the relationship between it and the vascular resistance of each systemic organ.
![]() Defines vascular compliance and states how the volume-pressure curves for arteries and veins differ.
Defines vascular compliance and states how the volume-pressure curves for arteries and veins differ.
![]() Predicts what will happen to venous volume when venous smooth muscle contracts or when venous transmural pressure increases.
Predicts what will happen to venous volume when venous smooth muscle contracts or when venous transmural pressure increases.
![]() Describes the role of arterial compliance in storing energy for blood circulation.
Describes the role of arterial compliance in storing energy for blood circulation.
![]() Describes the auscultation technique for determining arterial systolic and diastolic pressures.
Describes the auscultation technique for determining arterial systolic and diastolic pressures.
![]() Identifies the physical bases of the Korotkoff sounds.
Identifies the physical bases of the Korotkoff sounds.
![]() Indicates the relationship between arterial pressure, cardiac output, and total peripheral resistance and predicts how arterial pressure will be altered when cardiac output and/or total peripheral resistance changes.
Indicates the relationship between arterial pressure, cardiac output, and total peripheral resistance and predicts how arterial pressure will be altered when cardiac output and/or total peripheral resistance changes.
![]() Given arterial systolic and diastolic pressures, estimates mean arterial pressure.
Given arterial systolic and diastolic pressures, estimates mean arterial pressure.
![]() Indicates the relationship between pulse pressure, stroke volume, and arterial compliance and predicts how pulse pressure will be changed by changes in stroke volume, or arterial compliance.
Indicates the relationship between pulse pressure, stroke volume, and arterial compliance and predicts how pulse pressure will be changed by changes in stroke volume, or arterial compliance.
![]() Describes how arterial compliance changes with age and how this affects arterial pulse pressure.
Describes how arterial compliance changes with age and how this affects arterial pulse pressure.
Recall from Chapter 1 that the primary job of the cardiovascular system is to maintain “homeostasis” within a body that contains billions of closely spaced individual cells. Homeostasis implies that each and every cell in the body is continually bathed in a local environment of constant composition that is optimal for cell function. In essence, the peripheral vascular system is a sophisticated irrigation system. Blood flow is continually delivering nutrients to and removing waste products from the local interstitial environment throughout the body each and every minute, as required.
The heart supplies the pumping power required to create flow through the system. Because of the left ventricle’s action, pressure at the inlet (the aorta) of the systemic vascular network is higher than that at its outlets (the vena cavae). Everywhere within the vascular system, blood always flows passively “downhill” from higher pressure to lower pressure according to well-known physical rules. Like water flowing downhill, blood seeks to travel along the path of least resistance. Consequently, the peripheral vascular system changes the resistance of its various pathways to direct blood flow to where it is needed.
![]() Also recall from Chapter 1 that the Fick principle governs how substances are transported by blood flow between the capillary bed in one organ to that in another. In this chapter, we consider first how solutes and fluid are transported between the plasma and the interstitial fluid across the capillary walls within an organ. Next, the basic equation for flow through a single vessel (
Also recall from Chapter 1 that the Fick principle governs how substances are transported by blood flow between the capillary bed in one organ to that in another. In this chapter, we consider first how solutes and fluid are transported between the plasma and the interstitial fluid across the capillary walls within an organ. Next, the basic equation for flow through a single vessel (![]() = ΔP/R presented in Chapter 1) is applied to the complex network of branching vessels that actually exist in the cardiovascular system. Then, the consequences of the elastic (balloon-like) properties of the large-diameter arteries and veins on overall cardiovascular system operation are considered. Finally, the principles behind the routine clinical measurement of arterial blood pressure are presented along with the conclusions about overall cardiovascular function that can be made from such pressure measurements.
= ΔP/R presented in Chapter 1) is applied to the complex network of branching vessels that actually exist in the cardiovascular system. Then, the consequences of the elastic (balloon-like) properties of the large-diameter arteries and veins on overall cardiovascular system operation are considered. Finally, the principles behind the routine clinical measurement of arterial blood pressure are presented along with the conclusions about overall cardiovascular function that can be made from such pressure measurements.
TRANSCAPILLARY TRANSPORT
Transcapillary Solute Diffusion
![]() Capillaries act as efficient exchange sites where most substances cross the capillary walls simply by passively diffusing from regions of high concentration to regions of low concentration. As in any diffusion situation, there are four factors that determine the diffusion rate of a substance between the blood and the interstitial fluid: (1) the concentration difference, (2) the surface area for exchange, (3) the diffusion distance, and (4) the permeability of the capillary wall to the diffusing substance.1
Capillaries act as efficient exchange sites where most substances cross the capillary walls simply by passively diffusing from regions of high concentration to regions of low concentration. As in any diffusion situation, there are four factors that determine the diffusion rate of a substance between the blood and the interstitial fluid: (1) the concentration difference, (2) the surface area for exchange, (3) the diffusion distance, and (4) the permeability of the capillary wall to the diffusing substance.1
Capillary beds allow huge amounts of materials to enter and leave blood because they maximize the area across which exchange can occur while minimizing the distance over which the diffusing substances must travel. Capillaries are extremely fine vessels with a lumen (inside) diameter of approximately 5 μm, a wall thickness of approximately 1 μm, and an average length of perhaps 0.5 mm. (For comparison, a human hair is roughly 100 μm in diameter.) Capillaries are distributed in incredible numbers in organs and communicate intimately with all regions of the interstitial space. It is estimated that there are approximately 1010 capillaries in the systemic organs with a collective surface area of approximately 100 m2. That is roughly the area of one player’s side of a single tennis court. Recall from Chapter 1 that no cell is more than approximately 10 μm (less than 1/10th the thickness of paper) from a capillary. Diffusion is a tremendously powerful mechanism for material exchange when operating over such a short distance and through such a large area. We are far from being able to duplicate—in an artificial lung or kidney, for example—the favorable geometry for diffusional exchange that exists in our own tissues.
As illustrated in Figure 6–1, the capillary wall itself consists of only a single thickness of endothelial cells joined to form a tube. The ease with which a particular solute crosses the capillary wall is expressed in a parameter called its capillary permeability. Permeability takes into account all the factors (diffusion coefficient, diffusion distance, and surface area)—except concentration difference—that affect the rate at which a solute crosses the capillary wall.
Careful experimental studies on how rapidly different substances cross capillary walls indicate that two fundamentally distinct pathways exist for transcapillary exchange. Lipid-soluble substances, such as the gases oxygen and carbon dioxide, cross the capillary wall easily. Because the lipid endothelial cell plasma membranes are not a significant diffusion barrier for lipid-soluble substances, transcapillary movement of these substances can occur through the entire capillary surface area.
The capillary permeability to small polar particles such as sodium and potassium ions is approximately 10,000-fold less than that for oxygen. Nevertheless, the capillary permeability to small ions is several orders of magnitude higher than the permeability that would be expected if the ions were forced to move through the lipid plasma membranes. It is therefore postulated that capillaries are somehow perforated at intervals with water-filled channels or pores.2 Calculations from diffusion data indicate that the collective cross-sectional area of the pores relative to the total capillary surface area varies greatly between capillaries in different organs. Brain capillaries appear to be very tight (have few pores), whereas capillaries in the kidney and fluid-producing glands are much more leaky. On an average, however, pores constitute only a very small fraction of total capillary surface area—perhaps 0.01%. This area is, nevertheless, sufficient to allow very rapid equilibration of small water-soluble substances between the plasma and interstitial fluids of most organs. Thus, the concentrations of inorganic ions measured in a plasma sample can be taken to indicate their concentrations throughout the entire extracellular space.
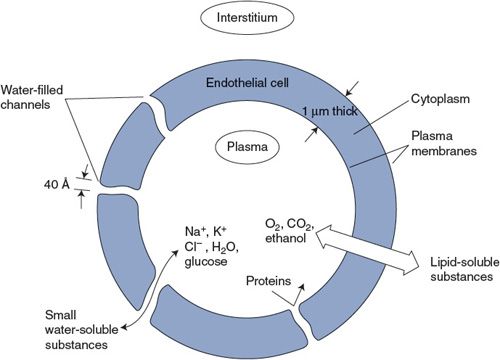
Figure 6–1. Pathways for transcapillary solute diffusion.
An effective maximum diameter of approximately 40 Å has been assigned to individual pores because substances with molecular diameters larger than this essentially do not cross capillary walls.3 Thus, albumin and other proteins in the plasma are normally confined to the plasma space.
ENDOTHELIAL CELLS
In addition to forming capillaries, a layer of endothelial cells lines the entire cardiovascular system—including the heart chambers and valves. Because of their ubiquitous and intimate contact with blood, endothelial cells have evolved to serve many functions other than acting as a barrier to transcapillary solute and water exchange. For example, endothelial cell membranes contain specific enzymes that convert some circulating hormones from inactive to active forms. Endothelial cells are also intimately involved in producing substances that lead to blood clot formation and the stemming of bleeding in the event of tissue injury. Moreover, and as discussed in the next chapter, the endothelial cells lining muscular vessels such as arterioles can produce vasoactive substances that act on the smooth muscle cells that surround them to influence arteriolar diameter.
Transcapillary Fluid Movement
![]() In addition to providing a diffusion pathway for small charged molecules, the water-filled channels that traverse capillary walls permit fluid flow through the capillary wall.4 Net shifts of fluid between the blood and the interstitial compartments are important for a host of physiological functions, including the maintenance of circulating blood volume, intestinal fluid absorption, tissue edema formation, and saliva, sweat, and urine production. Net fluid movement out of capillaries is referred to as filtration, and fluid movement into capillaries is called reabsorption.
In addition to providing a diffusion pathway for small charged molecules, the water-filled channels that traverse capillary walls permit fluid flow through the capillary wall.4 Net shifts of fluid between the blood and the interstitial compartments are important for a host of physiological functions, including the maintenance of circulating blood volume, intestinal fluid absorption, tissue edema formation, and saliva, sweat, and urine production. Net fluid movement out of capillaries is referred to as filtration, and fluid movement into capillaries is called reabsorption.
Fluid flows through transcapillary channels in response to pressure differences between the interstitial and intracapillary fluids according to the basic flow equation. However, both hydrostatic and osmotic pressures influence transcapillary fluid movement. The fact that intravascular hydrostatic pressure provides the driving force for causing blood flow along vessels has been discussed previously. For example, the hydrostatic pressure inside capillaries, Pc, is approximately 25 mm Hg and is the driving force that causes blood to return to the right side of the heart from the capillaries of systemic organs. In addition, however, the 25-mm Hg hydrostatic intracapillary pressure tends to cause fluid to flow through the transcapillary pores into the interstitium where the hydrostatic pressure (Pi) is near or below 0 mm Hg. Thus, there is normally a large hydrostatic pressure difference favoring fluid filtration across the capillary wall. Our entire plasma volume would soon be in the interstitium if there were not some counteracting force tending to draw fluid into the capillaries. The balancing force is an osmotic pressure that arises from the fact that plasma has a higher protein concentration than does interstitial fluid.
Recall that water always tends to move from regions of low to regions of high total solute concentration in establishing osmotic equilibrium. Also, recall that osmotic forces are quantitatively expressed in terms of osmotic pressure. The osmotic pressure of a given solution is defined as the hydrostatic pressure necessary to prevent osmotic water movement into the test solution when it is exposed to pure water across a membrane permeable only to water. The total osmotic pressure of a solution is proportional to the total concentration of individual solute particles in the solution.5 Plasma, for example, has a total osmotic pressure of approximately 5000 mm Hg—nearly all of which is attributable to dissolved mineral salts such as NaCl and KCl. As discussed, the capillary permeability to small ions is very high. Their concentrations in plasma and interstitial fluid are very nearly equal and, consequently, they do not affect transcapillary fluid movement.
![]() There is however a small but important difference in the osmotic pressures of plasma and interstitial fluid that is due to the presence of albumin and other large proteins in the plasma, which are normally absent from the interstitial fluid. A special term, oncotic pressure (or colloid osmotic pressure), is used to denote the portion of a solution’s total osmotic pressure that is due to particles that do not move freely across capillaries. Because of the plasma proteins, the oncotic pressure of plasma (πc) is approximately 25 mm Hg. Because of the absence of proteins, the oncotic pressure of the interstitial fluid (πi) is near 0 mm Hg. Thus, there is normally a large osmotic force for fluid reabsorption into capillaries that counteracts the tendency for intracapillary hydrostatic pressure to drive fluid out of capillaries. The forces that influence transcapillary fluid movement are summarized on the left side of Figure 6–2.6
There is however a small but important difference in the osmotic pressures of plasma and interstitial fluid that is due to the presence of albumin and other large proteins in the plasma, which are normally absent from the interstitial fluid. A special term, oncotic pressure (or colloid osmotic pressure), is used to denote the portion of a solution’s total osmotic pressure that is due to particles that do not move freely across capillaries. Because of the plasma proteins, the oncotic pressure of plasma (πc) is approximately 25 mm Hg. Because of the absence of proteins, the oncotic pressure of the interstitial fluid (πi) is near 0 mm Hg. Thus, there is normally a large osmotic force for fluid reabsorption into capillaries that counteracts the tendency for intracapillary hydrostatic pressure to drive fluid out of capillaries. The forces that influence transcapillary fluid movement are summarized on the left side of Figure 6–2.6
The relationship among the factors that influence transcapillary fluid movement, known as the Starling hypothesis,7 can be expressed by the equation:
![]()
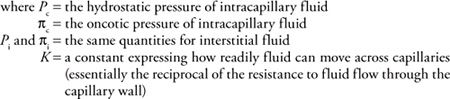
Fluid balance within a tissue (the absence of net transcapillary water movement) occurs when the bracketed term in this equation is zero. This equilibrium may be upset by alterations in any of the four pressure terms. The pressure imbalances that cause capillary filtration and reabsorption are indicated on the right side of Figure 6–2.
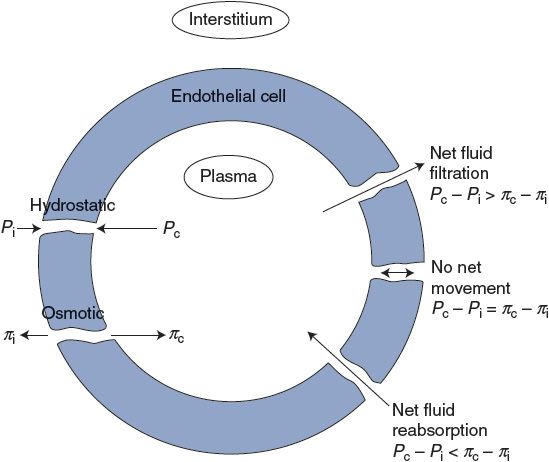
Figure 6–2. Factors influencing transcapillary fluid movement.
In most tissues, rapid net filtration of fluid is abnormal and causes tissue swelling as a result of excess fluid in the interstitial space (edema). For example, a substance called histamine is often released in damaged tissue. One of the actions of histamine is to increase capillary permeability to the extent that proteins leak into the interstitium. Net filtration and edema accompany histamine release, in part, because the oncotic pressure difference (πc – πi) is reduced below normal.
Transcapillary fluid filtration is not always detrimental. Indeed, fluid-producing organs such as salivary glands and kidneys utilize high intracapillary hydrostatic pressure to produce continual net filtration. Moreover, in certain abnormal situations, such as severe loss of blood volume through hemorrhage, the net fluid reabsorption accompanying diminished intracapillary hydrostatic pressure helps restore the volume of circulating fluid.
The Lymphatic System
![]() Despite the extremely low capillary permeability to proteins, these molecules as well as other large particles such as long-chain fatty acids and bacteria do slowly find their way into the interstitial space. If such particles are allowed to accumulate in the interstitial space, filtration forces will ultimately exceed reabsorption forces and edema would result. The lymphatic vessel network represents a flow pathway that normally operates to guard against such edema. It does so in two synergistic ways. First, it is a pathway for returning excess interstitial fluid to the plasma space. Second, it automatically removes colloid particles from the interstitium. The latter effect lowers interstitial colloid osmotic pressure and thus reduces the tendency for fluid filtration from blood plasma to the interstitium.
Despite the extremely low capillary permeability to proteins, these molecules as well as other large particles such as long-chain fatty acids and bacteria do slowly find their way into the interstitial space. If such particles are allowed to accumulate in the interstitial space, filtration forces will ultimately exceed reabsorption forces and edema would result. The lymphatic vessel network represents a flow pathway that normally operates to guard against such edema. It does so in two synergistic ways. First, it is a pathway for returning excess interstitial fluid to the plasma space. Second, it automatically removes colloid particles from the interstitium. The latter effect lowers interstitial colloid osmotic pressure and thus reduces the tendency for fluid filtration from blood plasma to the interstitium.
The lymphatic system begins in the tissues with blind-ended lymphatic capillaries that are roughly equivalent in size to, but much less numerous than, regular capillaries. These capillaries are very porous and easily collect large particles accompanied by interstitial fluid. This fluid, called lymph, moves through the converging lymphatic vessels, is filtered through lymph nodes where bacteria and particulate matter are removed, and ultimately reenters the circulatory system near the point where the peripheral venous blood enters the right heart.
Flow of lymph from the tissues toward the entry point into the circulatory system is promoted by two factors: (1) increases in tissue interstitial pressure (due to fluid accumulation or due to movement of surrounding tissue) and (2) contractions of the lymphatic vessels themselves. Valves located in these vessels also prevent backward flow.
Roughly 2.5 L of lymphatic fluid enters the cardiovascular system each day. In the steady state, this indicates a total body net transcapillary fluid filtration rate of 2.5 L/day. When compared with the total amount of blood that circulates each day (approximately 7000 L), this may seem like an insignificant amount of net capillary fluid leakage. However, lymphatic blockage is a very serious problem and is accompanied by severe tissue swelling. Thus, the lymphatics play a critical role in keeping the interstitial protein concentration low and in removing excess capillary filtrate from the tissues.
RESISTANCE AND FLOW IN NETWORKS OF VESSELS
![]() In Chapter 1, it was asserted that the basic flow equation (
In Chapter 1, it was asserted that the basic flow equation (![]() = ΔP/R) may be applied to networks of tubes as well as to individual tubes. The reason is that any network of resistances, however complex, can always be reduced to a single “equivalent” resistor that relates the total flow through the network to the pressure difference across the network. Of course, one way of finding the overall resistance of a network is to perform an experiment to see how much flow goes through it for a given pressure difference between its inlet and outlet. Another approach to finding the overall resistance of a network is to calculate it from knowledge of the resistances of the individual elements in the network and how they are connected. When one looks at the overall design of the body’s vascular system as illustrated in Figure 1–8, one sees two patterns: (1) the arterial, arteriolar, capillary, and venous segments are connected in series (one after the other); and (2) within each segment, there are many vessels arranged in parallel (beside each other). So, to even begin comprehending what happens within such a complex network, one must first understand the basic physics involved in series and parallel combinations of resistance elements.
= ΔP/R) may be applied to networks of tubes as well as to individual tubes. The reason is that any network of resistances, however complex, can always be reduced to a single “equivalent” resistor that relates the total flow through the network to the pressure difference across the network. Of course, one way of finding the overall resistance of a network is to perform an experiment to see how much flow goes through it for a given pressure difference between its inlet and outlet. Another approach to finding the overall resistance of a network is to calculate it from knowledge of the resistances of the individual elements in the network and how they are connected. When one looks at the overall design of the body’s vascular system as illustrated in Figure 1–8, one sees two patterns: (1) the arterial, arteriolar, capillary, and venous segments are connected in series (one after the other); and (2) within each segment, there are many vessels arranged in parallel (beside each other). So, to even begin comprehending what happens within such a complex network, one must first understand the basic physics involved in series and parallel combinations of resistance elements.
Vessels in Series
When vessels with individual resistances R1, R2, …, Rn are connected in series, the overall resistance of the network is simply the sum of the individual resistances, as indicated by the following formula:
![]()
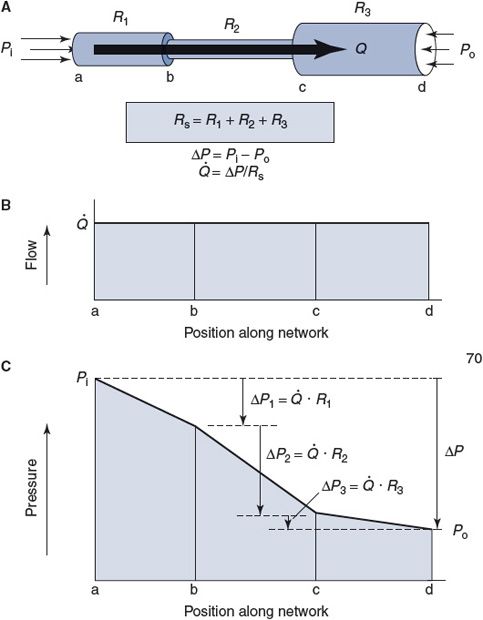
Figure 6–3. Series resistance network.
Figure 6–3A shows an example of three vessels connected in series between some region where the pressure is Pi and another region with a lower pressure Po, so that the total pressure difference across the network, ΔP, is equal to Pi – Po. By the series resistance equation, the total resistance across this network (Rs) is equal to R1 + R2 + R3. By the basic flow equation, the flow through the network (![]() ) is equal to ΔP/Rs. It should be intuitively obvious that
) is equal to ΔP/Rs. It should be intuitively obvious that ![]() is also the flow (volume/time) through each of the elements in the series, as indicated in Figure 6–3B. (Fluid particles may move with different velocities (distance/time) in different elements of a series network, but the volume that passes through each element in a minute must be identical.)
is also the flow (volume/time) through each of the elements in the series, as indicated in Figure 6–3B. (Fluid particles may move with different velocities (distance/time) in different elements of a series network, but the volume that passes through each element in a minute must be identical.)
As shown in Figure 6–3C, a portion of the total pressure drop across the network occurs within each element of the series. The pressure drop across any element in the series can be calculated by applying the basic flow equation to that element, for example, ΔP1 = ![]() R1. Note that the largest portion of the overall pressure drop will occur across the element in the series with the largest resistance to flow (R2 in Figure 6–3).
R1. Note that the largest portion of the overall pressure drop will occur across the element in the series with the largest resistance to flow (R2 in Figure 6–3).
One implication of the series resistance equation is that elements with the highest relative resistance to flow contribute more to the network’s overall resistance than do elements with relatively low resistance. Therefore, high-resistance elements are inherently in an advantageous position to be able control the overall resistance of the network and therefore the flow through it. As we shall see shortly, the arteriolar network normally presents the largest portion of the overall resistance to blood flow though organs. Thus, it is not surprising that changes in arteriolar diameter are the primary mechanism that the body uses to regulate organ blood flow.
Vessels in Parallel
As indicated in Figure 6–4, when several tubes with individual resistances R1, R2, …, Rn are brought together to form a parallel network of vessels, one can calculate a single overall resistance for the parallel network Rp according to the following formula:
![]()
The total flow through a parallel network is determined by ΔP/Rp. As the preceding equation implies, the overall effective resistance of any parallel network will always be less than that of any of the elements in the network. (In the special case where the individual elements that form the network have identical resistances Rx, the overall resistance of the network is equal to the resistance of an individual element divided by the number (n) of parallel elements in the network: Rp = Rx/n.) In general, the more parallel elements that occur in the network, the lower the overall resistance of the network. Thus, for example, a capillary bed that consists of many individual capillary vessels in parallel can have a very low overall resistance to flow even though the resistance of a single capillary is relatively high.
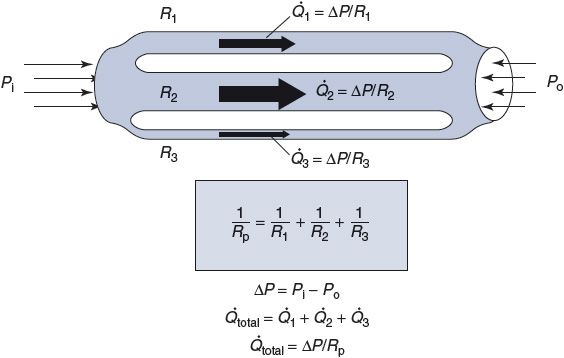
Figure 6–4. Parallel resistance network.
The series and parallel resistance equations may be used alternately to analyze resistance networks of great complexity. For example, any or all the series resistances shown in Figure 6–3 could actually represent the calculated overall resistance of many vessels arranged in parallel.
NORMAL CONDITIONS IN THE PERIPHERAL VASCULATURE
From uncountable anatomical and physiological studies, a fairly clear picture has developed about what conditions normally exist within the peripheral vasculature. The major points are illustrated in traces of Figure 6–5. Each is discussed separately below.
Peripheral Blood Flow Velocities
![]() The top trace in Figure 6–5 shows the differences in blood flow velocity (distance/time) that normally exist within various segments of the peripheral vasculature. But how can these differences exist when the flow (volume/time) through all the consecutive segments must be equal? (For example, when cardiac output is 5 L/min, 5 L/min must also be passing through the aorta, arterioles, capillaries, and veins.) The answer is that the total cross-sectional area through which the cardiac output is flowing varies greatly between different segments of the peripheral vasculature (see Figure 1–8). Therefore, for the same through-flow, blood must travel with greater velocity through regions with smaller cross-sectional area.
The top trace in Figure 6–5 shows the differences in blood flow velocity (distance/time) that normally exist within various segments of the peripheral vasculature. But how can these differences exist when the flow (volume/time) through all the consecutive segments must be equal? (For example, when cardiac output is 5 L/min, 5 L/min must also be passing through the aorta, arterioles, capillaries, and veins.) The answer is that the total cross-sectional area through which the cardiac output is flowing varies greatly between different segments of the peripheral vasculature (see Figure 1–8). Therefore, for the same through-flow, blood must travel with greater velocity through regions with smaller cross-sectional area.
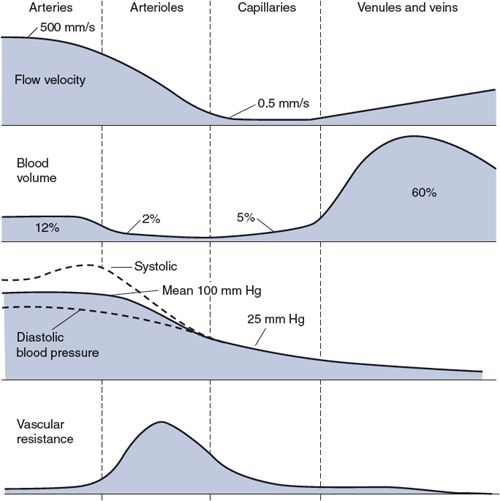
Figure 6–5. Flow velocities, blood volumes, blood pressures, and vascular resistances in the peripheral vasculature from aorta to right atrium.
Blood normally flows through all vessels in the cardiovascular system in an orderly streamlined manner called laminar flow. With laminar flow, there is a parabolic velocity profile across the tube, as shown on the left side of Figure 6–6. Velocity is fastest along the central axis of the tube and falls to zero at the wall. The concentric layers of fluid with different velocities slip smoothly over one another. Little mixing occurs between fluid layers so that individual particles move in straight streamlines parallel to the axis of the flow. Laminar flow is very efficient because little energy is wasted on anything but producing forward fluid motion.
Because blood is a viscous fluid, its movement through a vessel exerts a shear stress on the walls of the vessel. This is a force that wants to drag the inside surface (the endothelial cell layer) of the vessel along with the flow. With laminar flow, the shear stress on the wall of a vessel is proportional to the rate of flow through it. The endothelial cells that line a vessel are able to sense (and respond to) changes in the rate of blood flow through the vessel by detecting changes in the shear stress on them. Shear stress may also be an important factor in certain pathological situations. For example, atherosclerotic plaques tend to form preferentially near branches off large arteries where, for complex hemodynamic reasons beyond the scope of this text, high shear stresses exist.
![]() When blood is forced to move with too high a velocity through a narrow opening, the normal laminar flow pattern may break down into the turbulent flow pattern shown in the center of Figure 6–6. With turbulent flow, there is much internal mixing and friction. When the flow within a vessel is turbulent, the vessel’s resistance to flow is significantly higher than that predicted from the Poiseuille equation given in Chapter 1. Turbulent flow also generates sound, which can be heard with the aid of a stethoscope. Cardiac murmurs, for example, are manifestations of turbulent flow patterns generated by cardiac valves that do not open fully when they are supposed to be open or leak backward when they are supposed to be closed. Detection of sounds from peripheral arteries (bruits) is also abnormal. They telegraph significant pathological reduction of a large vessel’s cross-sectional area. Commonly, this is due to an atherosclerotic plaque encroaching on the vessel’s lumen. As shown in Figure 6–5, the flow velocities in arterioles, capillaries, and veins are relatively low. Turbulent flow never occurs normally in these vessels. Thus, the presence of a bruit always indicates something amiss in a large artery.
When blood is forced to move with too high a velocity through a narrow opening, the normal laminar flow pattern may break down into the turbulent flow pattern shown in the center of Figure 6–6. With turbulent flow, there is much internal mixing and friction. When the flow within a vessel is turbulent, the vessel’s resistance to flow is significantly higher than that predicted from the Poiseuille equation given in Chapter 1. Turbulent flow also generates sound, which can be heard with the aid of a stethoscope. Cardiac murmurs, for example, are manifestations of turbulent flow patterns generated by cardiac valves that do not open fully when they are supposed to be open or leak backward when they are supposed to be closed. Detection of sounds from peripheral arteries (bruits) is also abnormal. They telegraph significant pathological reduction of a large vessel’s cross-sectional area. Commonly, this is due to an atherosclerotic plaque encroaching on the vessel’s lumen. As shown in Figure 6–5, the flow velocities in arterioles, capillaries, and veins are relatively low. Turbulent flow never occurs normally in these vessels. Thus, the presence of a bruit always indicates something amiss in a large artery.
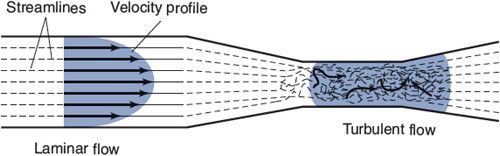
Figure 6–6. Laminar and turbulent flow patterns.
Peripheral Blood Volumes
The second trace in Figure 6–5 shows the approximate percentage of the total circulating blood volume that is contained in the different vascular regions of the systemic organs at any instant of time. (Approximately 20% of the total volume is contained in the pulmonary system and the heart chambers and is not accounted for in this figure.)
![]() Note that most of the circulating blood is contained within the veins of the systemic organs. This diffuse but large blood reservoir is often referred to as the peripheral venous pool. A second but smaller reservoir of venous blood (not explicitly indicated in Figure 6–5) is called the central venous pool and is contained in the great veins of the thorax and the right atrium. When peripheral veins constrict, blood is displaced from the peripheral venous pool and enters the central pool. An increase in the central venous volume, and thus central venous pressure, enhances cardiac filling. That in turn augments stroke volume according to the Frank–Starling law of the heart. The important message is that peripheral veins can act to influence cardiac output. This is an extremely important mechanism of cardiovascular regulation and will be discussed in much greater detail in Chapter 8.
Note that most of the circulating blood is contained within the veins of the systemic organs. This diffuse but large blood reservoir is often referred to as the peripheral venous pool. A second but smaller reservoir of venous blood (not explicitly indicated in Figure 6–5) is called the central venous pool and is contained in the great veins of the thorax and the right atrium. When peripheral veins constrict, blood is displaced from the peripheral venous pool and enters the central pool. An increase in the central venous volume, and thus central venous pressure, enhances cardiac filling. That in turn augments stroke volume according to the Frank–Starling law of the heart. The important message is that peripheral veins can act to influence cardiac output. This is an extremely important mechanism of cardiovascular regulation and will be discussed in much greater detail in Chapter 8.
Peripheral Blood Pressures
Blood pressure decreases in the consecutive vascular segments with the pattern shown in the third trace in Figure 6–5. Recall from Figure 3–1 that aortic pressure fluctuates between a systolic value and a diastolic value with each heartbeat, and the same is true throughout the arterial system. (For complex hemodynamic reasons, the difference between systolic and diastolic pressures actually increases with distance from the heart in the large arteries.8) The average pressure in the arch of the aorta, however, is approximately 100 mm Hg, and this mean arterial pressure falls by only a small amount within the arterial system.
A large pressure drop occurs in the arterioles, where the pulsatile nature of the pressure also nearly disappears. The average capillary pressure is approximately 25 mm Hg. Pressure continues to decrease in the venules and veins as blood returns to the right heart. The central venous pressure (which is the filling pressure for the right side of the heart) is normally very close to 0 mm Hg.
Peripheral Vascular Resistances
The bottom trace in Figure 6–5 indicates the relative resistance to flow that exists in each of the consecutive vascular regions. Recall from Chapter 1 that resistance, pressure difference, and flow are related by the basic flow equation ![]() = P/R. Because the flow (
= P/R. Because the flow (![]() ) must be the same through each of the consecutive regions indicated in Figure 6–5, the pressure drop that occurs across each of these regions is a direct reflection of the resistance to flow within that region (see Figure 6–3). Thus, the large pressure drop occurring as blood moves through arterioles indicates that arterioles present a large resistance to flow. The mean pressure drops very little in arteries because they have very little resistance to flow. Similarly, the modest pressure drop that exists across capillaries is a reflection of the fact that the capillary bed has a modest resistance to flow when compared with that of the arteriolar bed. (Recall from Figure 6–4 that the capillary bed can have a low resistance to flow because it is a parallel network of a very large number of individual capillaries.)
) must be the same through each of the consecutive regions indicated in Figure 6–5, the pressure drop that occurs across each of these regions is a direct reflection of the resistance to flow within that region (see Figure 6–3). Thus, the large pressure drop occurring as blood moves through arterioles indicates that arterioles present a large resistance to flow. The mean pressure drops very little in arteries because they have very little resistance to flow. Similarly, the modest pressure drop that exists across capillaries is a reflection of the fact that the capillary bed has a modest resistance to flow when compared with that of the arteriolar bed. (Recall from Figure 6–4 that the capillary bed can have a low resistance to flow because it is a parallel network of a very large number of individual capillaries.)
Blood flow through many individual organs can vary over a 10-fold or greater range. Because mean arterial pressure is a relatively stable cardiovascular variable, large changes in an organ’s blood flow are achieved by changes in its overall vascular resistance to blood flow. The consecutive vascular segments are arranged in series within an organ, and the overall vascular resistance of the organ must equal the sum of the resistances of its consecutive vascular segments:
![]()
![]() Because arterioles have such a large vascular resistance in comparison to the other vascular segments, the overall vascular resistance of any organ is determined to a very large extent by the resistance of its arterioles. Arteriolar resistance is, of course, strongly influenced by arteriolar diameter. Thus, the blood flow through an organ is primarily regulated by adjustments in the internal diameter of arterioles caused by contraction or relaxation of their muscular arteriolar walls.
Because arterioles have such a large vascular resistance in comparison to the other vascular segments, the overall vascular resistance of any organ is determined to a very large extent by the resistance of its arterioles. Arteriolar resistance is, of course, strongly influenced by arteriolar diameter. Thus, the blood flow through an organ is primarily regulated by adjustments in the internal diameter of arterioles caused by contraction or relaxation of their muscular arteriolar walls.
![]() When the arterioles of an organ change diameter, not only does the flow to the organ change but the manner in which the pressures drop within the organ is also modified. The effects of arteriolar dilation and constriction on the pressure profile within a vascular bed are illustrated in Figure 6–7. Arteriolar constriction causes a greater pressure drop across the arterioles, and this tends to increase the arterial pressure while it decreases the pressure in capillaries and veins. (The arterioles function somewhat like a dam; closing a dam’s gates decreases the flow while increasing the level of the reservoir behind it and decreasing the level of its outflow stream.) Conversely, increased organ blood flow caused by arteriolar dilation is accompanied by decreased arterial pressure and increased capillary pressure. Because of the changes in capillary hydrostatic pressure, arteriolar constriction tends to cause transcapillary fluid reabsorption, whereas arteriolar dilation tends to promote transcapillary fluid filtration.
When the arterioles of an organ change diameter, not only does the flow to the organ change but the manner in which the pressures drop within the organ is also modified. The effects of arteriolar dilation and constriction on the pressure profile within a vascular bed are illustrated in Figure 6–7. Arteriolar constriction causes a greater pressure drop across the arterioles, and this tends to increase the arterial pressure while it decreases the pressure in capillaries and veins. (The arterioles function somewhat like a dam; closing a dam’s gates decreases the flow while increasing the level of the reservoir behind it and decreasing the level of its outflow stream.) Conversely, increased organ blood flow caused by arteriolar dilation is accompanied by decreased arterial pressure and increased capillary pressure. Because of the changes in capillary hydrostatic pressure, arteriolar constriction tends to cause transcapillary fluid reabsorption, whereas arteriolar dilation tends to promote transcapillary fluid filtration.
Total Peripheral Resistance
The overall resistance to flow through the entire systemic circulation is called the total peripheral resistance. Because the systemic organs are generally arranged in parallel (Figure 1–2), the vascular resistance of each organ contributes to the total peripheral resistance according to the following parallel resistance equation:
![]()
As discussed later in this chapter, the total peripheral resistance is an important determinant of arterial blood pressure.
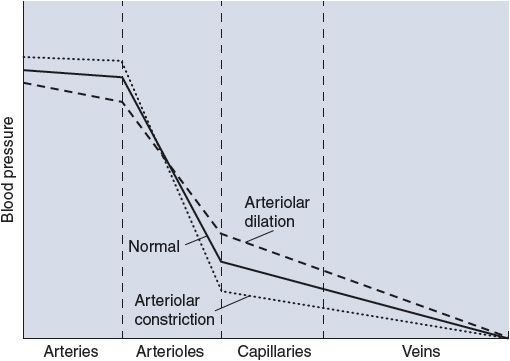
Figure 6–7. Effect of changes in arteriolar resistance on vascular pressures.
Elastic Properties of Arteries and Veins
As indicated earlier, arteries and veins contribute only a small portion to the overall resistance to flow through a vascular bed. Therefore, changes in their diameters have no significant effect on the blood flow through systemic organs. The elastic behavior of arteries and veins is however very important to overall cardiovascular function because they can act as reservoirs and substantial amounts of blood can be stored in them. Arteries or veins behave more like balloons with one pressure throughout rather than as resistive pipes with a flow-related pressure difference from end to end. Thus, we often think of an “arterial compartment” and a “venous compartment,” each with an internal pressure that is related to the volume of blood within it at any instant and how elastic (stretchy) its walls are.
The elastic nature of a vascular region is characterized by a parameter called compliance (C) that describes how much its volume changes (ΔV) in response to a given change in distending pressure (ΔP): C = ΔV/ΔP. Distending pressure is the difference between the internal and external pressures on the vascular walls.
The volume–pressure curves for the systemic arterial and venous compartments are shown in Figure 6–8. It is immediately apparent from the disparate slopes of the curves in this figure that the elastic properties of arteries and veins are very different. For the arterial compartment, the ΔV/ΔP measured near a normal operating pressure of 100 mm Hg indicates a compliance of approximately 2 mL/mm Hg. By contrast, the venous pool has a compliance of more than 100 mL/mm Hg near its normal operating pressure of 5 to 10 mm Hg.
![]() Because veins are so compliant, even small changes in peripheral venous pressure can cause a significant amount of the circulating blood volume to shift into or out of the peripheral venous pool. Standing upright, for example, increases venous pressure in the lower extremities, distends the compliant veins, and promotes blood accumulation (pooling) in these vessels, as might be represented by a shift from point A to point B in Figure 6–8. Fortunately, this process can be counteracted by active venous constriction. The dashed line in Figure 6–8 shows the venous volume–pressure relationship that exists when veins are constricted by activation of venous smooth muscle. In constricted veins, volume may be normal (point C) or even below normal (point D) despite higher-than-normal venous pressure. Peripheral venous constriction tends to increase peripheral venous pressure and shift blood out of the peripheral venous compartment.
Because veins are so compliant, even small changes in peripheral venous pressure can cause a significant amount of the circulating blood volume to shift into or out of the peripheral venous pool. Standing upright, for example, increases venous pressure in the lower extremities, distends the compliant veins, and promotes blood accumulation (pooling) in these vessels, as might be represented by a shift from point A to point B in Figure 6–8. Fortunately, this process can be counteracted by active venous constriction. The dashed line in Figure 6–8 shows the venous volume–pressure relationship that exists when veins are constricted by activation of venous smooth muscle. In constricted veins, volume may be normal (point C) or even below normal (point D) despite higher-than-normal venous pressure. Peripheral venous constriction tends to increase peripheral venous pressure and shift blood out of the peripheral venous compartment.
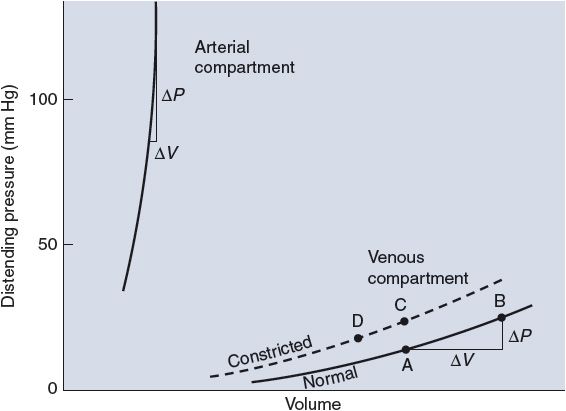
Figure 6–8. Volume–pressure curves of arterial and venous compartments.
![]() The elasticity of arteries allows them to act as a blood reservoir on a beat-to-beat basis. Arteries play an important role in converting the pulsatile flow output of the heart into a steady flow of blood through the vascular beds of systemic organs. During the early rapid phase of cardiac ejection, the arterial volume increases because blood is entering the aorta more rapidly than it is passing into systemic arterioles. Thus, part of the work the heart does in ejecting blood goes to stretching the elastic walls of arteries. Toward the end of systole and throughout diastole, arterial volume decreases because the flow out of arteries exceeds flow into the aorta. Previously stretched arterial walls recoil to shorter lengths and in the process give up their stored potential energy. This reconverted energy is what actually does the work of propelling blood through the peripheral vascular beds during diastole. If the arteries were rigid tubes that could not store energy by expanding elastically, arterial pressure would immediately fall to zero with the termination of each cardiac ejection.
The elasticity of arteries allows them to act as a blood reservoir on a beat-to-beat basis. Arteries play an important role in converting the pulsatile flow output of the heart into a steady flow of blood through the vascular beds of systemic organs. During the early rapid phase of cardiac ejection, the arterial volume increases because blood is entering the aorta more rapidly than it is passing into systemic arterioles. Thus, part of the work the heart does in ejecting blood goes to stretching the elastic walls of arteries. Toward the end of systole and throughout diastole, arterial volume decreases because the flow out of arteries exceeds flow into the aorta. Previously stretched arterial walls recoil to shorter lengths and in the process give up their stored potential energy. This reconverted energy is what actually does the work of propelling blood through the peripheral vascular beds during diastole. If the arteries were rigid tubes that could not store energy by expanding elastically, arterial pressure would immediately fall to zero with the termination of each cardiac ejection.
MEASUREMENT OF ARTERIAL PRESSURE
Recall that the systemic arterial pressure fluctuates with each heart cycle between a diastolic value (PD) and a higher systolic value (PS). Obtaining estimates of an individual’s systolic and diastolic pressures is one of the most routine diagnostic techniques available to the physician. The basic principles of the auscultation technique used to measure blood pressure are described here with the aid of Figure 6–9.
An inflatable cuff is wrapped around the upper arm, and a device, such as a mercury manometer, is attached to monitor the pressure within the cuff. The cuff is initially inflated with air to a pressure (![]() 175-200 mm Hg) that is well above normal systolic values. This pressure is transmitted from the flexible cuff into the upper arm tissues, where it causes all blood vessels to collapse. No blood flows into (or out of) the forearm as long as the cuff pressure is higher than the systolic arterial pressure. After the initial inflation, air is allowed to gradually “bleed” from the cuff so that the pressure within it falls slowly and steadily through the range of arterial pressure fluctuations. The moment the cuff pressure falls below the peak systolic arterial pressure, some blood is able to pass through the arteries beneath the cuff during the systolic phase of the cycle. This flow is intermittent and occurs only over a brief period of each heart cycle. Moreover, because it occurs through partially collapsed vessels beneath the cuff, the flow is turbulent rather than laminar. The intermittent periods of flow beneath the cuff produce tapping sounds, which can be detected with a stethoscope placed over the radial artery at the elbow. As indicated in Figure 6–9, sounds of varying character, known collectively as Korotkoff sounds, are heard whenever the cuff pressure is between the systolic and diastolic aortic pressures.
175-200 mm Hg) that is well above normal systolic values. This pressure is transmitted from the flexible cuff into the upper arm tissues, where it causes all blood vessels to collapse. No blood flows into (or out of) the forearm as long as the cuff pressure is higher than the systolic arterial pressure. After the initial inflation, air is allowed to gradually “bleed” from the cuff so that the pressure within it falls slowly and steadily through the range of arterial pressure fluctuations. The moment the cuff pressure falls below the peak systolic arterial pressure, some blood is able to pass through the arteries beneath the cuff during the systolic phase of the cycle. This flow is intermittent and occurs only over a brief period of each heart cycle. Moreover, because it occurs through partially collapsed vessels beneath the cuff, the flow is turbulent rather than laminar. The intermittent periods of flow beneath the cuff produce tapping sounds, which can be detected with a stethoscope placed over the radial artery at the elbow. As indicated in Figure 6–9, sounds of varying character, known collectively as Korotkoff sounds, are heard whenever the cuff pressure is between the systolic and diastolic aortic pressures.
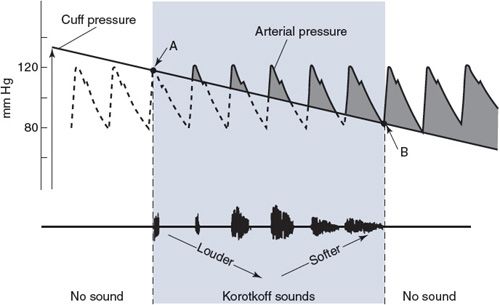
Figure 6–9. Blood pressure measurement by auscultation. Point A indicates systolic pressure and point B indicates diastolic pressure.
Because there is no blood flow and thus no sound when cuff pressure is higher than systolic arterial pressure, the highest cuff pressure at which tapping sounds are heard is taken as the systolic arterial pressure. When the cuff pressure falls below the diastolic pressure, blood flows through the vessels beneath the cuff without periodic interruption and again no sound is detected over the radial artery. The cuff pressure at which the sounds become muffled or disappear is taken as the diastolic arterial pressure. The Korotkoff sounds are more distinct when the cuff pressure is near the systolic arterial pressure than when it is near the diastolic pressure. Thus, consistency in determining diastolic pressure by auscultation requires concentration and experience.
DETERMINANTS OF ARTERIAL PRESSURE
Mean Arterial Pressure
![]() Mean arterial pressure is a critically important cardiovascular variable because it is the average effective pressure that drives blood through the systemic organs. One of the most fundamental equations of cardiovascular physiology is that which indicates how mean arterial pressure (
Mean arterial pressure is a critically important cardiovascular variable because it is the average effective pressure that drives blood through the systemic organs. One of the most fundamental equations of cardiovascular physiology is that which indicates how mean arterial pressure (![]() )2 is related to cardiac output (CO) and total peripheral resistance (TPR):
)2 is related to cardiac output (CO) and total peripheral resistance (TPR):
![]()
This equation is simply a rearrangement of the basic flow equation (![]() = ΔP/R) applied to the entire systemic circulation with the single assumption that central venous pressure is approximately zero so that ΔP =
= ΔP/R) applied to the entire systemic circulation with the single assumption that central venous pressure is approximately zero so that ΔP = ![]() A. Note that mean arterial pressure is influenced both by the heart (via cardiac output) and by the peripheral vasculature (via total peripheral resistance). All changes in mean arterial pressure result from changes in either cardiac output or total peripheral resistance.
A. Note that mean arterial pressure is influenced both by the heart (via cardiac output) and by the peripheral vasculature (via total peripheral resistance). All changes in mean arterial pressure result from changes in either cardiac output or total peripheral resistance.
Calculating the true value of mean arterial pressure requires mathematically averaging the arterial pressure waveform over one or more complete heart cycles. Most often, however, we know from auscultation only the systolic and diastolic pressures, yet wish to make some estimate of the mean arterial pressure. Mean arterial pressure necessarily falls between the systolic and diastolic pressures. A useful rule of thumb is that mean arterial pressure (![]() A) is approximately equal to diastolic pressure (PD) plus one-third of the difference between systolic and diastolic pressures (PS – PD):
A) is approximately equal to diastolic pressure (PD) plus one-third of the difference between systolic and diastolic pressures (PS – PD):
![]()
Arterial Pulse Pressure
The arterial pulse pressure (Pp) is defined simply as systolic pressure minus diastolic pressure:
![]()
To be able to use pulse pressure to deduce something about how the cardiovascular system is operating, one must do more than just define it. It is important to understand what determines pulse pressure; that is, what causes it to be what it is and what can cause it to change. In a previous section of this chapter, there was a brief discussion about how, as a consequence of the compliance of the arterial vessels, arterial pressure increases as arterial blood volume is expanded during cardiac ejection. The magnitude of the pressure increase (ΔP) caused by an increase in arterial volume depends on how large the volume change (ΔV) is and on how compliant (CA) the arterial compartment is: ΔP = ΔV/CA. If, for the moment, the fact that some blood leaves the arterial compartment during cardiac ejection is neglected, then the increase in arterial volume during each heartbeat is equal to the stroke volume (SV).
![]() Thus, pulse pressure is, to a first approximation, equal to stroke volume divided by arterial compliance:
Thus, pulse pressure is, to a first approximation, equal to stroke volume divided by arterial compliance:
![]()
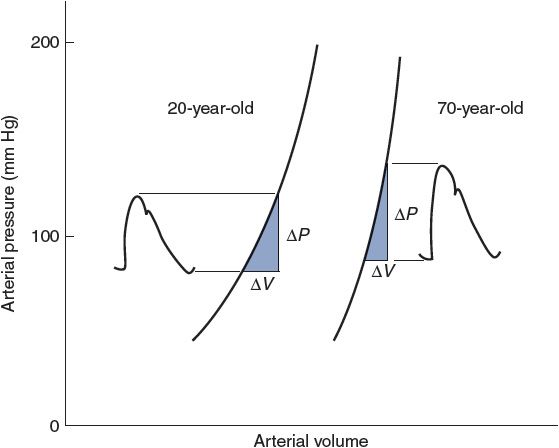
Figure 6–10. Observed effects of aging on the pressure–volume relationship of arteries. Also indicated are normal age-related changes in stroke volume (ΔV) and arterial pressures.
Arterial pulse pressure is approximately 40 mm Hg in a normal resting young adult because stroke volume is approximately 80 mL and arterial compliance is approximately 2 mL/mm Hg. Pulse pressure tends to increase with age in adults because of a decrease in arterial compliance (“hardening of the arteries”). Arterial volume–pressure curves for a 20-year-old and a 70-year-old are shown in Figure 6–10. The decrease in arterial compliance with age is indicated by the steeper curve for the 70-year-old (more ΔP for a given ΔV) than for the 20-year-old. Thus, a 70-year-old will necessarily have a larger pulse pressure for a given stroke volume than a 20-year-old. As indicated in Figure 6–10, the decrease in arterial compliance is sufficient to cause increased pulse pressure even though stroke volume tends to decrease with age.
Figure 6–10 also illustrates the fact that arterial blood volume and mean arterial pressure tend to increase with age. The increase in mean arterial pressure is not caused by the decreased arterial compliance because compliance changes do not directly influence either cardiac output or total peripheral resistance, which are the sole determinants of ![]() A. Mean arterial pressure tends to increase with age because of an age-dependent increase in total peripheral resistance, which is controlled primarily by arterioles, not arteries.
A. Mean arterial pressure tends to increase with age because of an age-dependent increase in total peripheral resistance, which is controlled primarily by arterioles, not arteries.
Arterial compliance also decreases with increasing mean arterial pressure, as evidenced by the curvature of the volume–pressure relationships shown in Figure 6–10. Otherwise, arterial compliance is a relatively stable parameter. Thus, most acute changes in arterial pulse pressure are the result of changes in stroke volume.
The preceding equation for pulse pressure is a much-simplified description of some very complex hemodynamic processes. It correctly identifies stroke volume and arterial compliance as the major determinants of arterial pulse pressure but is based on the assumption that no blood leaves the aorta during systolic ejection. Obviously, this is not strictly correct. Furthermore, close examination of Figure 3–1 will reveal that peak systolic pressure is reached even before cardiac ejection is complete. It is therefore not surprising that several factors other than arterial compliance and stroke volume have minor influences on pulse pressure. For example, because the arteries have viscous properties as well as elastic characteristics, faster cardiac ejection caused by increased myocardial contractility tends to increase pulse pressure somewhat even if stroke volume remains constant. Changes in total peripheral resistance, however, have little or no effect on pulse pressure, because a change in total peripheral resistance causes parallel changes in both systolic and diastolic pressures.
A common misconception in cardiovascular physiology is that the systolic pressure alone or the diastolic pressure alone indicates the status of a specific cardiovascular variable. For example, high diastolic pressure is often taken to indicate high total peripheral resistance. This is not necessarily so because high diastolic pressure can exist with normal (or even reduced) total peripheral resistance if the heart rate and cardiac output are high. Systolic and diastolic pressures are both influenced by the heart rate, stroke volume, total peripheral resistance, and CA. The student should not attempt to interpret systolic and diastolic pressure values independently. Interpretation is much more straightforward when the focus is on mean arterial pressure (![]() A = CO × TPR) and arterial pulse pressure (P =
A = CO × TPR) and arterial pulse pressure (P = ![]() SV/C). (See study questions 6–13 and 6–14.)
SV/C). (See study questions 6–13 and 6–14.)
PERSPECTIVES
Proper operation of the vasculature is equally important to proper operation of the heart for normal CV function. Severe compromise of the material transport system occurs when the compliance characteristics of the large vessels are altered, control of arteriolar resistance is inappropriate, or density of the microcirculation is inadequate. Once again we would like to draw attention to Appendix C in which many of the most important relationships for both vascular and cardiac function are summarized.
Stay updated, free articles. Join our Telegram channel

Full access? Get Clinical Tree


