The Pericardium
ECHO APPEARANCES OF THE NORMAL PERICARDIUM
The pericardium is visible in each of the standard imaging planes of the heart and should therefore be examined in each view. As the normal pericardium is thin (1-2 mm) it is not prominent on echo, but may appear as a thin bright line around the heart. The trace of pericardial fluid that is normally present may be visible as a thin black line separating the two layers of the serous pericardium (Fig. 25.1).
Use 2D echo to inspect the pericardium in as many views as possible and describe its appearance:
Does the pericardium appear normal or abnormal?
Is there thickening of the pericardium?
Is there pericardial calcification?
Is there a pericardial effusion? Describe its appearance. How big is it, where is it located and what are its haemodynamic effects?
Is there evidence of pericardial constriction? What are the haemodynamic effects?
Are there any pericardial masses?
PERICARDIAL EFFUSION
Any process that causes inflammation or injury to the pericardium can result in a pericardial effusion (Table 25.1).
Echo assessment of pericardial effusion
Pericardial or pleural?
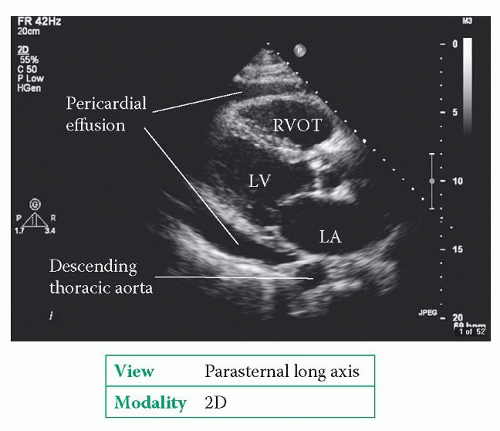
First of all, be sure what you are assessing. At first glance, pericardial and pleural effusions can appear similar on echo, but there are important distinguishing features. Use 2D echo in the parasternal long axis view to assess where the effusion lies in relation to the descending aorta. A pericardial effusion will extend just up to the gap in between the left atrium (LA) and the front of the descending aorta (Fig. 25.2). In contrast, a pleural effusion extends behind the aorta and around the LA (Fig. 25.3). However, bear in mind that some patients will have coexistent pericardial and pleural effusions.
2D and M-mode
Use 2D echo to assess the extent of the effusion – is it circumferential, filling the entire pericardium, or localized? If localized, record where the effusion lies in relation to the atria and/or ventricles. Very localized effusions can sometimes be difficult to spot – for instance, if they lie within the oblique sinus – and may only be evident through the compression of adjacent structures (e.g. atria or pulmonary veins). Bear in mind
that the patient’s position may affect the distribution of the pericardial effusion – for instance, the effusion may localize posteriorly in a supine patient.
that the patient’s position may affect the distribution of the pericardial effusion – for instance, the effusion may localize posteriorly in a supine patient.
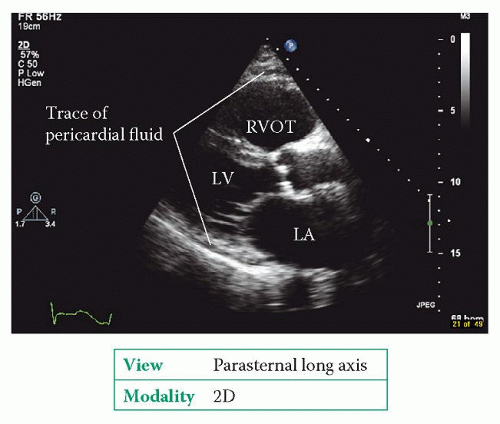 |
Table 25.1 Causes of pericardial effusion | ||||||||||
|---|---|---|---|---|---|---|---|---|---|---|
|
 |
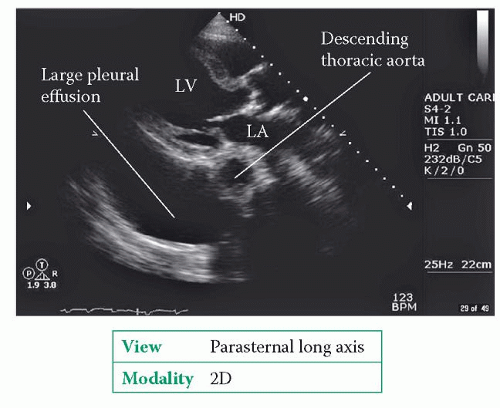 |
Table 25.2 Pericardial effusion size | |||||||||||||||
|---|---|---|---|---|---|---|---|---|---|---|---|---|---|---|---|
|
Assess the size of the effusion from several different views using 2D and/or M-mode echo. Record both the depth of the effusion (in cm) and the location where each measurement was taken. The size of an effusion can be gauged by its depth (Table 25.2). It is important to note that effusion size is not the same as clinical severity – small effusions that accumulate quickly can have a greater haemodynamic effect than large effusions that accumulate slowly.
Pericardial effusions can contain a fluid transudate or exudate, blood or pus. It can be difficult to distinguish between these on echo, and the pericardial fluid will usually look echolucent regardless of its nature. However, there may be strands of fibrin visible within the fluid, and these commonly adhere to the outside of the heart. Sometimes masses may be visible within the pericardium (Fig. 25.4). Describe the appearance of any strands or masses, including their size and location.
Once you have assessed the appearances of the pericardial effusion, move on to assess its haemodynamic effects to look for evidence that would support a clinical diagnosis of cardiac tamponade (see below).
ESTIMATING THE VOLUME OF A PERICARDIAL EFFUSION
It’s not usually necessary to estimate the volume of a pericardial effusion, but if you wish to, you can. In the apical 4-chamber view, you can trace the outline of the pericardium and use the echo machine software to calculate the volume of the entire heart and pericardial effusion together. Next, trace the outline of the heart itself and calculate the heart’s volume. By subtracting the latter measurement from the former, you are left with the approximate volume of the pericardial effusion.
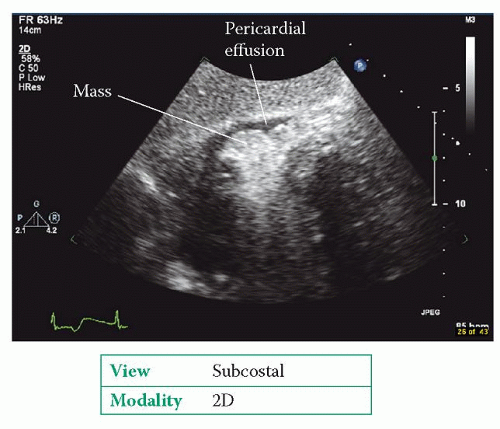 Figure. 25.4 Mass within a pericardial effusion |
Management of pericardial effusion
Investigate patients with pericardial effusion as appropriate to determine the underlying cause. Pericardiocentesis is indicated for:
cardiac tamponade (see below)
suspected purulent or tuberculous effusions
effusions measuring >2.0 cm (in diastole).
Pericardiocentesis can be performed for diagnostic purposes for effusions <2.0 cm, but this should only be done by skilled hands in an experienced centre.
CARDIAC TAMPONADE
Cardiac tamponade refers to the haemodynamic decompensation that occurs when the pressure within a pericardial effusion compresses the heart. It is a clinical diagnosis indicated by the presence of:
breathlessness (with clear lungs)
tachycardia (>100 beats/min)
hypotension (systolic blood pressure <100 mmHg)
pulsus paradoxus (>10 mmHg fall in systolic blood pressure during inspiration)
elevated jugular venous pressure
quiet heart sounds.
Echo assessment of cardiac tamponade
2D and M-mode
Use 2D and M-mode echo to confirm the presence of a pericardial effusion and to assess its extent as described above. Look carefully for signs of chamber collapse during diastole. As pressure within the pericardium rises, the right-sided chambers collapse (at least in part) during diastole (Fig. 25.5). The first chamber to be affected is the
right atrium (RA), which is seen to collapse during atrial systole, followed by the right ventricle (beginning with the right ventricular outflow tract, RVOT). Rarely, LA


right atrium (RA), which is seen to collapse during atrial systole, followed by the right ventricle (beginning with the right ventricular outflow tract, RVOT). Rarely, LA
Stay updated, free articles. Join our Telegram channel
Full access? Get Clinical Tree
