Chapter 14 The Noninvasive Vascular Laboratory
Instrumentation
Doppler Velocity Measurement Techniques
 [1]
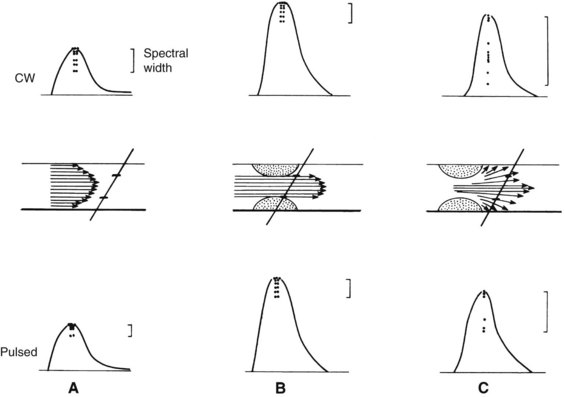
[1]The shifted frequency obtained from a vessel is within the audible range, so the data can be presented to the examiner as an audio signal. Although qualitative interpretation is helpful in some patient examinations, quantitative measurements provide objective testing. Spectral analyzers are used to determine the main frequency components obtained from a given vessel. This information is usually displayed on a sonogram, which shows the frequency content in time (Figure 14-1).
Duplex Scan
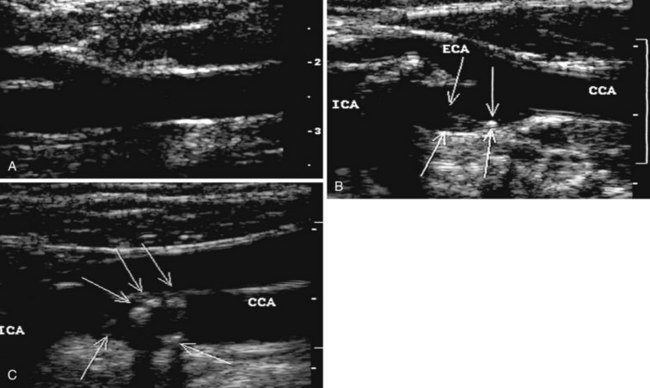
During the 1960s, B-mode ultrasound imaging was used for visualization of soft tissue structures. Although early devices had only crude resolution, equipment has improved to the point that clear, detailed images of vessels can be produced in real time (Figure 14-2). In general, experience shows that when high-quality imaging is obtained, the diagnostic accuracy is very high; however, in patients with advanced atherosclerosis, it is difficult to obtain optimal studies, and diagnostic accuracy is lower. A common problem is incomplete imaging of the vessel wall as a result of calcification, which is present in varying degrees in up to half of patients studied. The extent of interference may be limited, but in some vessels there is no visualization of substantial portions of the artery. Although calcified plaques stand out sharply in the ultrasound image, some atheromas are visualized poorly or not at all. A major source of error is that recent thrombus may have the same echo density as flowing blood, so that an occluded vessel may look normal on the ultrasound image.
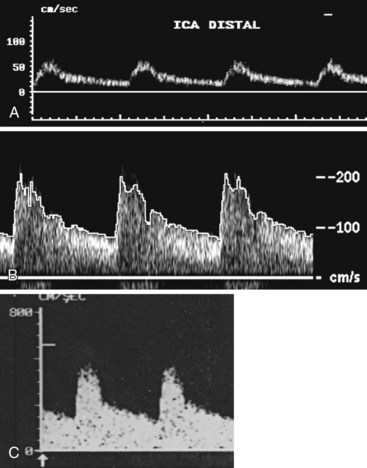
To overcome the limitations of ultrasound imaging, the research team at the University of Washington developed the duplex scanner, combining a real-time B-mode ultrasound image system with a pulsed Doppler detector.1 The ultrasound image shows not only the vessel under study but also the location of the sample volume of the Doppler beam so that the examiner can position it to study velocity patterns at specific locations in the vessel. The device can study calcified vessels by analyzing the Doppler velocity signal distal to the areas of calcification. The evaluation of the Doppler signal from the common carotid artery and its branches is performed using spectral analysis (Figure 14-3). Based on the peak systolic velocity, end-diastolic velocity, velocity ratios, and degree of spectral broadening, a category of stenosis is assigned to the vessel segment.
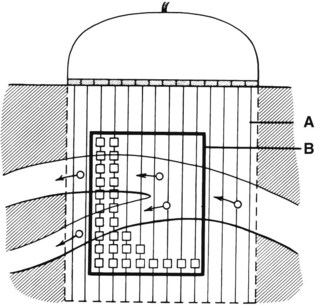
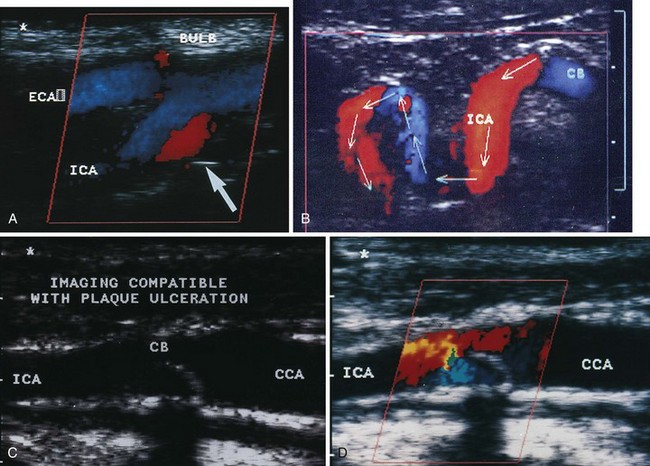
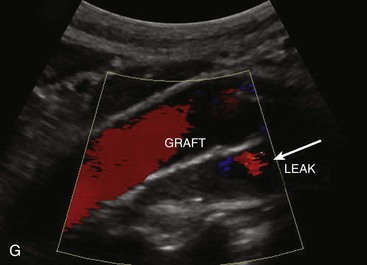
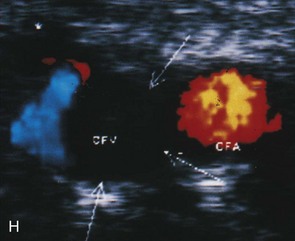
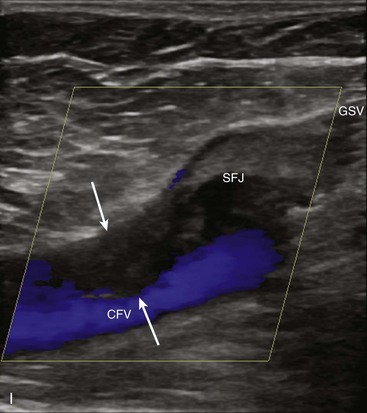
An important subsequent development is the color-coded Doppler system. A linear array transducer composed of many separate elements is used to produce a grid of sample volumes encompassing the area covered by the B-mode image (Figure 14-4). A portion of the grid is selected for color coding of velocity information. Each of the sample volumes within the area is examined. If the returning ultrasound signal has no change in phase or frequency, the amplitude information is used to create the gray-scale image at that point in the matrix. If there is a change in phase or frequency, the information is analyzed in terms of velocity. A color is assigned to represent an approximate mean velocity occurring at that point in the field. Red and blue show flow toward and away from the transducer, respectively. The magnitude of the velocity is represented by the hue of the color: a dark shade indicates slow flow, and a lighter shade or white indicates high flow. The aggregate of the color representation from the sample volumes detecting motion produces a real-time representation of the flow patterns within the vessels superimposed on the gray-scale image of the stationary tissue. Figure 14-5 (see color plate) illustrates examples of the advantages of color duplex scans. A more recent development is color coding of the Doppler power (as opposed to velocity) detected. Power is proportional to the square of the velocity; therefore this measurement provides more sensitive detection of very slow flow or flow in small vessels. A good example of the benefit of power imaging is the detection of an internal carotid string sign. Squaring the velocity eliminates the positive or negative value, so that power values have no directional representation. Power is represented in a single color, usually orange.
Carotid Artery Studies
Duplex Scan
The routine examination covers as much of the common carotid artery (CCA) and its branches as can be visualized with the configuration of the transducer used. In some patients, the origins of the CCAs can be visualized. Figures 14-2A and 14-5A (see color plate) show normal carotid bifurcations. The color image demonstrates the reverse velocity detected in the carotid bulb as a result of the complex flow pattern at the bifurcation. Many older patients have tortuosity that precludes the CCA, the bulb, and the branches from being visualized in a single plane; in such cases, careful scanning is required to obtain satisfactory imaging. Figure 14-5B (see color plate) shows an example of tortuosity in an elderly patient. Although such arteries can be studied with a conventional scanner, the color-coded unit simplifies the examination. The scan usually identifies the pathologic regions, but with advanced atherosclerosis, it is often difficult to get an adequate image to accurately estimate the degree of stenosis. Much of the classification of stenosis is based on interpretation of the Doppler signal. The two branches are distinguished by the image and the velocity signals. The ICA has a low peripheral resistance at all times, resulting in forward flow throughout diastole, whereas the high resistance in the external carotid artery results in a diastolic flow of zero. Stenoses produce an increased velocity at the site of the lesion and turbulence beyond it (see Figure 14-1). The turbulence is identified as spectral broadening on the sonogram (see Figure 14-3). Mild stenoses may not produce a significant increase in peak systolic velocity, but are identified by a moderate degree of spectral broadening.
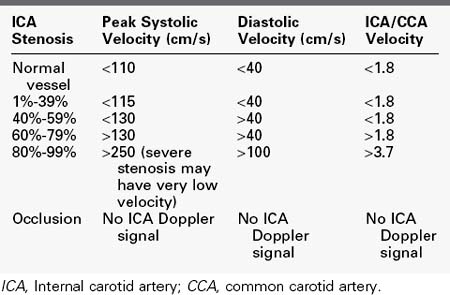
Based on the peak systolic velocity and the degree of spectral broadening, the ICA is placed into one of six diagnostic categories. There are two sets of criteria that have been used for many years, and although some laboratories have made modifications or adjustments, the basic principles continue to be applied. The criteria developed at the University of Washington use primarily ICA velocity parameters (Table 14-1).2 Further improvements in accuracy can be obtained using ratios of ICA velocities to CCA velocities in normal portions of the artery (Table 14-2).3 The diagnosis of ICA occlusion must be based on image and Doppler information, because the low flow found with some “string signs” is below the velocity detection threshold of many scanners. Newer color duplex devices have improved our ability to find small residual flow channels, especially using power flow mapping. Both the stippled appearance of chronic thrombus and a small diameter of the ICA indicate occlusion. Overall, low-grade plaques are best assessed with the image, whereas advanced lesions are best evaluated with the Doppler information.
TABLE 14-1 Categories of Internal Carotid Artery Stenosis:
University of Washington Criteria
| ICA Stenosis | ICA Velocity | Spectrum |
|---|---|---|
| Normal vessel | Peak systolic velocity <125 cm/s | No broadening |
| 1%-15% | Peak systolic velocity <125 cm/s | Limited broadening in late systole |
| 16%-49% | Peak systolic velocity <125 cm/s | Broadening throughout systole |
| 50%-79% | Peak systolic velocity >140 cm/s; end-diastolic velocity <140 cm/s | Broadening throughout systole |
| 80%-99% | End-diastolic velocity >140 cm/s (severe stenosis may have very low velocity) | Broadening throughout systole |
| Occlusion | No ICA Doppler signal; flow to zero in common carotid artery |
ICA, Internal carotid artery.
There has been a rapid growth in the use of duplex scanning for carotid diagnosis. Different investigators have demonstrated that the technique can be highly accurate. Studies have shown rates of 92% to 96% accuracy in the identification of severe stenosis.4–6 When these studies are analyzed in terms of correct category of stenosis, exact agreement is found in 77% to 87%, with poor agreement in only 1% to 2%. Of particular importance is the fact that experienced laboratories make few errors in separating severe stenosis from occlusion. Mansour and coauthors7 reported a 98% positive predictive value and 99% negative predictive value in the correct determination of ICA occlusion.
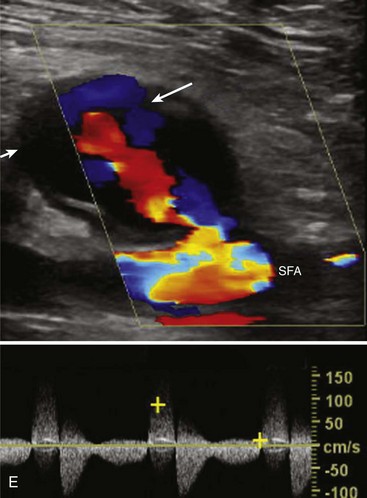
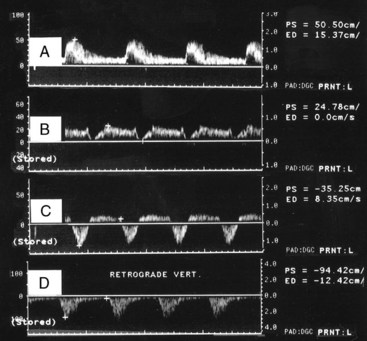
Although the majority of attention has been focused on the carotid circulation, laboratories routinely investigate the status of the vertebral arteries as well. The examination seeks two types of problems: stenosis in the vertebral artery itself and the abnormal flow produced by subclavian steal. In the majority of cases of significant vertebral stenosis, the lesion is located at the origin of the vessel. In some cases of severe occlusive disease, there is sufficient asymmetry in the waveforms of the two vertebral arteries to point to the problem side. However, a more complete assessment is obtained by examining the origins. Because of its deeper location, the left vertebral artery is more difficult to study than the right. Ackerstaff and associates8 found that the status of the ostium could be studied satisfactorily in about 80% of patients. When adequate evaluation of the prevertebral portion was possible, a sensitivity of 80% and a specificity of 97% were achieved in the detection of reductions greater than 50% in diameter. Most clinical cases of subclavian steal are demonstrated by a reverse flow in the vertebral artery on the affected side. Von Reutern and Pourcelot9 demonstrated that in some cases of subclavian stenosis there is distortion of the waveform rather than complete reversal of flow. The abnormal waveforms may have attenuation of the systolic component or an alternating pattern with reverse flow in systole and forward flow in diastole (Figure 14-6). Such cases can be assessed more fully by recording the Doppler signal after arm exercise or the induction of reactive hyperemia. In the presence of advanced subclavian stenosis, this stress test produces full reversal of flow.
Applications
Asymptomatic Carotid Stenosis
Increasing numbers of asymptomatic patients are being referred to vascular laboratories for the evaluation of cervical bruits. Although some of these patients have bruits radiating from the heart or the great vessels, in a considerable number the sound originates from the carotid bifurcation. Duplex scanning can provide accurate separation according to category of stenosis (see Tables 14-1 and 14-2). Patients with severe stenosis are considered at increased risk of stroke and are evaluated for prophylactic carotid endarterectomy. Lesions that fall in the moderate category should have follow-up testing to detect those that progress into the high-risk group. Most people with normal vessels or early disease do not require routine follow-up.
Intraoperative Assessment
Over the years, there has been increasing use of completion studies to evaluate the status of the operated artery before closing the neck. Contrast angiography is the most common technique used, usually with a single injection into the CCA below the level of the endarterectomy. Another approach is to examine the repair using a simple continuous-wave Doppler unit with subjective evaluation of the signals. This method detects severe residual stenoses but is not sensitive to other problems. Increasingly, completion duplex scanning is now being used to detect residual defects requiring correction, and studies have shown satisfactory results.10–12 Bandyk and colleagues13 used a peak systolic velocity greater than 180 cm/s or a velocity ratio greater than 2.4 as the criterion to perform a confirmatory angiogram or to proceed directly to reopening the artery.13
Postoperative Follow-Up
Recurrent stenosis after carotid endarterectomy remains a clinical problem. Early studies reported as much as 5% symptomatic restenosis and 8% asymptomatic restenosis (as identified by noninvasive testing).14,15 More recent studies applying life-table analysis have found restenosis rates of 20% to 32% with greater than 50% diameter reduction.16,17 It has been shown that a substantial proportion of restenoses occurs early in the postoperative period. A common practice is to obtain an early postoperative study that can be used as a baseline. Follow-up evaluations are done 6 and 12 months after surgery. If the study remains normal, noninvasive studies are repeated yearly. More recent studies show that in the presence of a normal completion angiogram or duplex scan, follow-up need not be performed until 1 year after operation.18,19
Lower Extremity Arterial Studies
Segmental Extremity Pressure Measurement
Indirect measurement of extremity pressures has been performed since the beginning of the 20th century using a sphygmomanometer and auscultation of the Korotkoff sounds with a stethoscope. Although this technique is universally used to measure pressures in the brachial artery, its application in the lower extremity is less practical because of the difficulty of listening for Korotkoff sounds in the popliteal space. The technique is certainly not applicable in the distal portions of the extremity because of the small size of the vessels involved. Investigators overcame this limitation by using a variety of plethysmographic devices. In 1959, Winsor20 first described the clinical measurement of arterial gradients using a plethysmograph. Systolic pressures in the lower extremity are normally higher than those in the upper extremity. He described the blood pressure index (blood pressure of arm/blood pressure of leg), which in normal persons is less than 1.0. A value greater than 1.0 indicates clinically significant occlusive disease proximal to the point of measurement. (Note that the ratio winsor described is the inverse of the currently used ankle-brachial index.) Likewise, a gradient between two sampling sites localizes the occlusive disease in the intervening segment. The main limitation of this method is that it detects only occlusive lesions that are sufficiently advanced to reduce the systolic pressure, so that it is not possible to detect early disease. Introduction of the Doppler velocity detector greatly simplified the indirect measurement of extremity pressures. For this application, the Doppler device is used merely to detect the presence or absence of the movement of blood in the artery. Measurements made by this method are reproducible, but do not provide diastolic pressure. Plethysmographic techniques are cumbersome and are not used routinely.
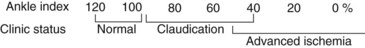
In clinical practice, simple screening can be performed by measuring the pressure at the brachial arteries and at the dorsal pedal and posterior tibial arteries on each side. The ankle-brachial index (ABI) is determined by dividing the ankle pressure on each side by the higher of the two brachial pressures. The resulting value reflects the severity of the occlusive disease for the entire extremity. Normally, the ABI should be greater than 1.0, and values less than 0.95 are abnormal. Figure 14-7 summarizes the general relation between ABI values and clinical status. It must be emphasized that this is only a rough correlation and that patients with similar values may have substantial differences in exercise tolerance. Likewise, the index at which rest pain appears varies considerably from patient to patient, ranging from 0.30 to 0.50.
An important limitation of the use of the wide cuff for thigh measurement is that it is possible to make only a single thigh measurement. As a result, it is not possible to distinguish occlusive disease above the ligament from that in the proximal portion of the superficial femoral artery, because both conditions can result in the same thigh pressure measurement. To overcome this problem, some investigators have recommended using 12-cm–wide cuffs to obtain two separate thigh measurements. When this is done, it is necessary to take into account the 20- to 30-mm Hg artifact in the results. In a study comparing the wide cuff with the two narrow-cuff techniques in the same group of patients, Heintz and coworkers21 reported an increased accuracy in the localization of disease using the two-cuff technique. Both methods of thigh pressure measurement are still being used, so it is important to know which method is being reported when reviewing the results of patient studies. Although segmental pressures have been used extensively to detect proximal disease, diagnostic errors may occur in 25% of patients. Other techniques should be used when an accurate determination of the segmental localization is needed.
Stay updated, free articles. Join our Telegram channel

Full access? Get Clinical Tree


