The Mitral Valve
ECHO VIEWS OF THE MITRAL VALVE
The mitral valve is usually assessed in the:
left parasternal window
parasternal long axis view
parasternal short axis view (mitral valve and papillary muscle levels)
apical window
apical 4-chamber view
apical 2-chamber view
apical 3-chamber (long axis) view.
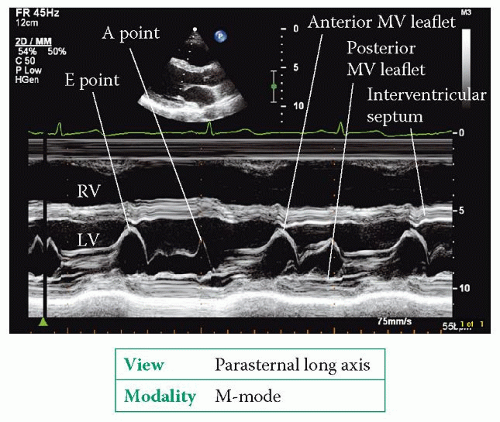
The parasternal long axis view (Fig. 6.2, p. 45) bisects the mitral valve, showing the anterior and posterior leaflets in the plane of the A2 and P2 scallops. 2D imaging shows the structure of the mitral valve and allows an assessment of leaflet mobility. An M-mode study of the valve, at the level of the leaflet tips, shows the tips open widely in early diastole as blood flows from the left atrium (LA) into the left ventricle (LV), and the point at which the anterior leaflet tip reaches its most anterior position is called the E point (Fig. 20.1).
The leaflets then move back together in mid-diastole before separating once again towards the end of diastole, as a result of the extra surge of blood through the valve that accompanies atrial systole. The maximum excursion of the anterior leaflet during this phase is called the A point. The anterior leaflet then follows a straight downward line to its closure point at the onset of systole. Once you have completed the M-mode recording, use colour Doppler to assess valvular flow.
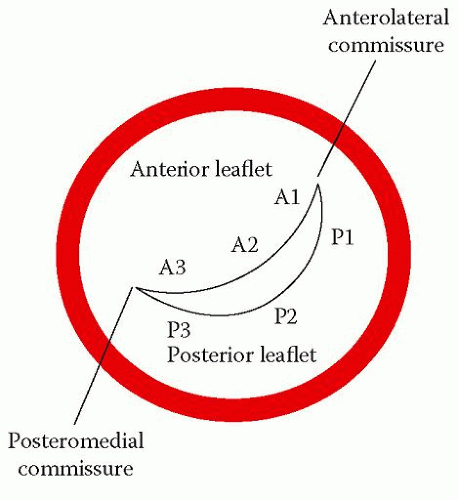
The parasternal short axis view (mitral valve level) shows the valve ‘face on’ and all three scallops of both leaflets can be seen together with both mitral commissures (Figs. 6.6 (p. 49) and 20.2). The area of the valve orifice can be measured with planimetry in this view – a normal mitral valve has an orifice area of 4.0-6.0 cm2. Colour Doppler shows the location and extent of any valvular regurgitation. Angling the probe down to the papillary muscle level (Fig. 6.7, p. 50) shows both papillary muscles. Sometimes there can be three papillary muscles if one of them happens to be bifid.
The apical 4-chamber view (Fig. 6.8, p. 51) shows the anterior mitral leaflet (A2 and A3 scallops) adjacent to the interventricular septum and the posterior leaflet (P1) adjacent to the lateral wall, together with the anterolateral papillary muscle and its chordae. The apical 2-chamber view (Fig. 6.10, p. 54) shows the anterior mitral leaflet in a ‘bicommisural view’, with the P1 and P3 scallops of the posterior leaflet on either side and the A2 scallop of the anterior leaflet in the middle. The apical 3-chamber view (Fig. 6.11, p. 55) is similar to the parasternal long axis view, showing the A2 and P2 scallops.
In each of the apical views inspect the valve structure with 2D echo and assess flow with colour Doppler. The apical views permit a good alignment of continuous wave (CW) and pulsed-wave (PW) Doppler with the valve to assess forward (and any regurgitant) flow. Forward flow across a normal mitral valve has a pressure half-time of 40-70 ms. Additional information can also be obtained from the:
subcostal window
subcostal long axis view
subcostal short axis view.
The subcostal long axis view provides an additional view from which the mitral valve can be examined. The subcostal short axis view is seldom used to examine the mitral valve, but with appropriate angulation of the probe it can be visualized.
MITRAL STENOSIS
Mitral stenosis is the obstruction of diastolic blood flow from the LA to the LV due to a narrowing of the mitral valve. This is almost always due to rheumatic mitral valve disease, as a consequence of rheumatic fever earlier in life.
Causes of mitral stenosis
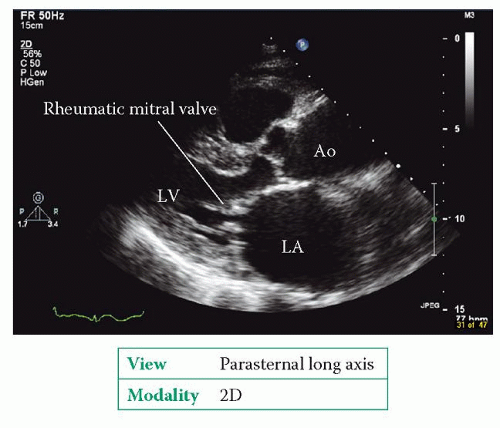
Rheumatic valve disease can affect any of the heart valves (or several in combination), but most commonly affects the mitral valve. The characteristic feature is fusion of the mitral leaflets along their edges, starting from the mitral commissures, restricting their ability to open. The leaflet edges become thickened, although there can be thickening and/or calcification elsewhere too. As the main body of each leaflet usually remains relatively pliable, the leaflets are seen to ‘dome’ during diastole, with the rising LA pressure causing the leaflet body to bow forwards towards the ventricle. This gives the leaflets what is described as a ‘hockey stick’ appearance. Rheumatic mitral stenosis also affects the chordae, causing fibrosis, shortening and calcification of the subvalvular apparatus.
Other causes of mitral stenosis are rare. These include congenital mitral stenosis, mitral annular calcification, systemic lupus erythematosus, rheumatoid arthritis, carcinoid syndrome and infective endocarditis. Beware of conditions that can cause obstruction of the mitral valve orifice and mimic mitral stenosis, such as left atrial myxoma, infective endocarditis with a large vegetation, ball thrombus or cor triatriatum.
MITRAL ANNULAR CALCIFICATION
Mitral annular calcification is relatively common in older patients (but can also be seen in younger patients with renal failure) and most commonly occurs in the posterior part of the mitral annulus, at the attachment point of the posterior leaflet, although rarely it can extend right round the annulus in severe cases. It is thought to be an indicator of cardiovascular risk and a marker of coronary artery disease. If annular calcification is massive, it can extend into the mitral leaflets and cause mitral stenosis. Unlike rheumatic mitral stenosis, mitral annular calcification does not affect the leaflet tips or cause fusion of the commissures.
Clinical features of mitral stenosis
The clinical features of mitral stenosis are summarized in Table 20.1. Most patients are female, and most will have other coexistent valve disease. Rheumatic mitral stenosis usually presents 20-40 years after an episode of rheumatic fever and is now relatively uncommon in developed countries. The onset of mitral stenosis tends to be gradual and so the symptoms can build up insidiously over a long period, but a new event (such as pregnancy or the onset of atrial fibrillation (AF)) can suddenly
cause the symptoms to deteriorate. Patients usually remain asymptomatic until the mitral valve orifice area falls below 2.0 cm2, at which point LA pressure starts to increase. As LA pressure rises, the LA starts to dilate. Pulmonary artery pressure also begins to rise and pulmonary hypertension develops. Once a patient becomes symptomatic, if left untreated the 10-year survival is around 50-60 per cent.
cause the symptoms to deteriorate. Patients usually remain asymptomatic until the mitral valve orifice area falls below 2.0 cm2, at which point LA pressure starts to increase. As LA pressure rises, the LA starts to dilate. Pulmonary artery pressure also begins to rise and pulmonary hypertension develops. Once a patient becomes symptomatic, if left untreated the 10-year survival is around 50-60 per cent.
Table 20.1 Clinical features of mitral stenosis | ||||||||||||||||||
|---|---|---|---|---|---|---|---|---|---|---|---|---|---|---|---|---|---|---|
|
Echo assessment of mitral stenosis
2D and M-mode
Use 2D and M-mode echo to assess the structure of the valve and the subvalvular apparatus. Be sure to describe the appearance of the mitral leaflets, mitral annulus, chordae tendineae and papillary muscles:
Do the mitral valve leaflets appear normal? Is there evidence of rheumatic valve disease (Fig. 20.3)?
Does the mitral annulus appear normal? Is there annular calcification, and is this mild, moderate or severe?
Is there any thickening of the leaflets? Is this mild, moderate or severe? Are both leaflets affected, and does this affect the tip or body of each leaflet?
Is there any calcification of the leaflets? Is this focal or diffuse? Does the calcification affect either or both of the commissures?
Is there fusion of one or both of the commissures?
Are the chordae tendineae normal? Is there any chordal thickening, shortening or calcification? Does this affect the chordae to the anterior or posterior leaflet?
Are the papillary muscles normal? Is there any calcification or fibrosis?
Is mitral leaflet mobility normal or reduced? How much is it reduced (mild, moderate or severe)? Is there any doming during diastole?
In the parasternal short axis view (mitral valve level), if the image quality is good enough, perform planimetry to measure the mitral orifice area. Remember that a stenosed mitral valve, when open, is funnel shaped, so be careful to ensure that you are measuring the ‘funnel’ at its narrowest point, i.e. the level of the leaflet tips. If you angle the probe too far upwards (towards the LA) you will overestimate the orifice area.
Once you’ve recorded a loop at the level of the tips, scroll the images back and forth until you find the one that shows the orifice at its widest point in mid-diastole. Take your measurement from this image, tracing around the inner edge of the leaflets – the echo machine will calculate the orifice area for you. Be careful of high gain settings, which can lead to underestimation of the mitral orifice area.
Once you’ve recorded a loop at the level of the tips, scroll the images back and forth until you find the one that shows the orifice at its widest point in mid-diastole. Take your measurement from this image, tracing around the inner edge of the leaflets – the echo machine will calculate the orifice area for you. Be careful of high gain settings, which can lead to underestimation of the mitral orifice area.
Using M-mode in mitral stenosis, assess:
Are the leaflet tips thickened?
Is there reduced excursion of the mitral leaflets during diastole?
Is there evidence of commissural fusion (shown by the posterior leaflet moving upwards, in the same direction as the anterior leaflet, as it opens during diastole, rather than downwards as a mirror image of the anterior leaflet)?
A stenotic mitral valve can be assigned a score (Wilkins score, see p. 227) which is assessed on the basis of leaflet mobility, valvular thickening, subvalvular thickening and valvular calcification. The Wilkins score can be used to judge the valve’s suitability for percutaneous balloon mitral valvuloplasty. An alternative to the Wilkins score is the commissural calcification score, in which each mitral commissure (anterolateral and posteromedial) is scored according to the degree of calcification seen on the short axis view, with a score of 0 being given for no calcification, 1 for calcium across half a commissure, and 2 for calcium across the whole commissure. The score for the two commissures is added together to give a total score of 0-4, with a score of ≥2 indicating less than a 50 per cent probability of achieving a good haemodynamic outcome following percutaneous balloon mitral valvuloplasty.
Colour Doppler
CW and PW Doppler
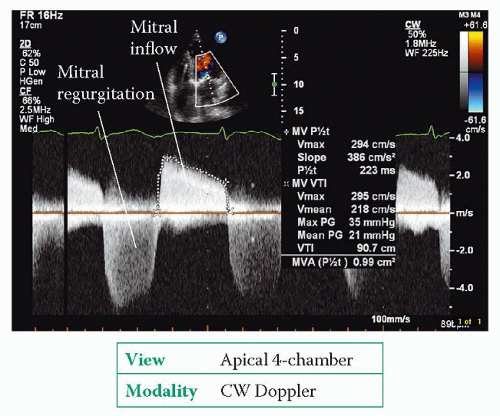
Use CW Doppler to obtain a trace of forward flow through the mitral valve (Fig. 20.4) from an apical 4-chamber view. Ignore traces obtained from ectopic beats (and the beat following an ectopic), and if the patient is in AF (as is often the case) take an average measurement from several beats.
From the trace, measure the pressure half-time of the mitral valve inflow by measuring the downward slope of the E wave (delineated by the ‘+’ markers in Fig. 20.4, giving a pressure half-time of 223 ms). Pressure half-time is a measure of the rate of fall in pressure across the valve – specifically, the time taken for the transmitral pressure gradient to fall to half of its initial peak value. The narrower the valve, the longer it takes for the pressure gradient to fall and hence the longer the pressure half-time. An echo Doppler trace displays flow velocity rather than pressure, and the mathematical relationship between pressure and flow velocity means that a fall in pressure gradient to 0.5 of its original value equates to a fall in flow velocity to 0.7 of its original value.
Studies have shown that a mitral valve area of 1 cm2 has a pressure half-time of approximately 220 ms, and that the relationship between pressure half-time and valve area is linear. It is therefore possible to estimate mitral valve area from pressure half-time using the equation:

where mitral valve area is measured in cm and pressure half-time in ms. In Fig. 20.4, the pressure half-time of 223 ms gives a valve area of:
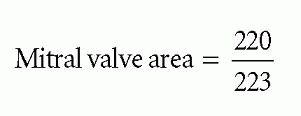
Mitral valve area = 0.99 cm2
This calculated valve area can be compared with the measured area you obtained from planimetry. Although pressure half-time is not affected by the presence of mitral regurgitation, it is influenced by conditions that alter compliance in the LA or LV, such as an atrial septal defect (ASD) or significant aortic regurgitation, which will shorten pressure half-time (and thus overestimate mitral valve area). Pressure half-time is also influenced by the acute haemodynamic changes that occur following mitral valvuloplasty (see p. 227).
Next, measure the mean mitral pressure drop by tracing the VTI of the mitral inflow (delineated by the ‘X’ markers in Fig. 20.4, giving a mean pressure gradient of 21 mmHg). Unlike pressure half-time, the mean pressure gradient is dependent not only on stenosis severity but also upon flow across the valve – conditions that increase transmitral flow (such as exercise or, as in the example in Figure 20.4, coexistent mitral regurgitation) will also increase the gradient.
Continuity equation
Mitral valve area can also be calculated using the continuity equation. This calculation relies on the volume of blood entering the LV via the mitral valve orifice during diastole (transmitral stroke volume) being equal to the volume of blood leaving the LV via the LV outflow tract (LVOT) during systole. This calculation cannot therefore be used in the presence of significant mitral or aortic regurgitation.
1. In the parasternal long axis view, measure the diameter of the LVOT in cm, and then use this to calculate the cross-sectional area (CSA) of the LVOT in cm2:
2. In the apical 5-chamber view, measure the velocity time integral (VTI) of LVOT outflow (using PW Doppler) to give VTILVOT, in cm.

