Fig. 9.1
(a) An ECG of a patient with old inferolateral infarction. There are abnormal Q waves in the inferior leads (II, III and aVF) and tall R wave (a mirror image of a Q wave) in lead V2. (b) An ECG of a patient with ischemic cardiomyopathy. An electronic atrial pacing. There are criteria for left ventricular hypertrophy. There are QS waves in the inferior leads and V3-V6, indicative of old inferior and anterior infarction
In general, persistent ST segment deviation in patients that do not have acute symptoms and without dynamic ECG changes does not indicate acute ischemia, but may be indicative of other conditions. For example, ST elevation (especially in leads with pathological Q waves) may indicate recent infarction or aneurysm; ST elevation in leads V1-V3 in patients with ECG criteria for left ventricular hypertrophy may indicate secondary repolarization changes; ST depression in the anterolateral leads with ST elevation in lead aVR may indicate cardiomyopathy with adverse left ventricular remodeling, etc.
Isolated T wave inversion in leads with isoelectric ST segment in clinically stable patients usually does not indicate a specific diagnosis. Automated, computerized interpretations erroneously state that T wave inversion is a sign of acute ischemia. T wave inversion with an isoelectric ST segment or slight ST elevation usually appears after reperfusion. Therefore, it may be a sign of recent ischemia. A typical “post-ischemic” ECG change is the Wellens’ sign (deep T wave inversion in the precordial leads with symmetrical descending and ascending limbs) after resolution of symptoms as a sign of a tight left anterior descending (LAD) lesion [3]. However, T wave inversion in leads V1-V3 is often seen in children and young women and should not be confused with the Wellens’ sign. Thus, in the absence of specific morphologic criteria or clinical history, the interpretation of T wave abnormality is fraught with hazard, thus the often mentioned, “non-specific T wave abnormality” should probably be used.
The ECG in Patients with Symptoms Compatible with Acute Coronary Syndromes
In patients with new onset symptoms compatible with myocardial ischemia, symptoms at rest or a change in the pattern of symptoms, the ECG remains the major noninvasive imaging tool for rapid assessment, diagnosis and triage. The accuracy of the ECG interpretation increases when it is done as part of the clinical assessment of the patient rather than off line without considering demographic data, risk factors and presentation. Comparisons to previous ECG recordings improve the detection of subtle changes, especially in patients with abnormal baseline ECG. Repeat ECG recordings when changes (worsening or improvement) in symptoms are noted increases the sensitivity of detecting minor changes that otherwise could be missed.
The Fibrinolytic Therapy Trialists’ Collaborative Group analyzed data from nine large fibrinolytic trials and concluded that fibrinolytic therapy reduced mortality in patients with ST segment elevation or bundle branch block [4]. In animal models and during intracoronary balloon occlusion in patients, acute occlusion of an epicardial artery usually results in ST segment elevation. Therefore, a paradigm has emerged that ST elevation signifies transmural myocardial ischemia due to an acute occlusion of an epicardial coronary artery, whereas patients presenting without ST elevation (normal ECGs, ST depression or isolated T wave inversion) do not have ongoing transmural ischemia and therefore, may not benefit from urgent reperfusion therapy. However, many patients have nonischemic sources of ST segment elevation at baseline or show dynamic ST changes that are not caused by acute ischemia [5]. For example, ST elevation due to early repolarization that tends to diminish at higher heart rates, may be falsely interpreted as transmural ischemia. The European Society of Cardiology/ American College of Cardiology Foundation/ American Heart Federation Task Force for the Universal Definition of Myocardial Infarction sets a threshold of ST elevation in ≥2 adjacent leads measured at the J point (for patients without ECG criteria for LVH or LBBB): in leads V2-V3 ≥ 0.2 mV in men, ≥0.15 mV in women, and for all other leads ≥0.1 mV [6, 7]. Patients with compatible symptoms within the preceding 12 h, who meet these criteria are triaged for acute reperfusion therapy. In cases, where the ECG does not meet the criteria, conservative medical therapy is recommended initially. However, these thresholds should be considered as a statistical tool that help to reduce the incidence of false activation of the acute reperfusion protocols and not as strict rules. Many patients may have an acute occlusion of an epicardial artery- true STEMI (ST-elevation myocardial infarction) with ST segment elevation less than the abovementioned thresholds. On the other hand, there are many patients with compatible symptoms and ST segment elevation who meet the above criteria, yet they do not have STEMI, even if they have positive cardiac biomarkers (so called “pseudo STEMI”) [5, 8]. Recognition of specific patterns of ST elevation that are caused by nonischemic etiologies (i.e., early repolarization, normal variant, repolarization changes secondary to left ventricular hypertrophy or conduction delay, Brugada syndrome, acute pericarditis, old infarction/ aneurysm) (Fig. 9.2) is crucial. Comparison to previous ECG tracings may assist in the accurate diagnosis. However, it should be emphasized that some patterns of nonischemic ST elevation may show dynamic changes (ST elevation due to early repolarization tends to diminish with faster heart rate, whereas ST segment elevation due to old aneurysm tends to increase, etc.). In the majority of cases; however, when the ECG interpretation is done in the conjunction of the clinical examination, accurate diagnosis of STEMI can be made. Yet, there are numerous borderline cases and especially when the ECG is interpreted alone without examining the patient, false positive and false negative interpretation may occur [9].
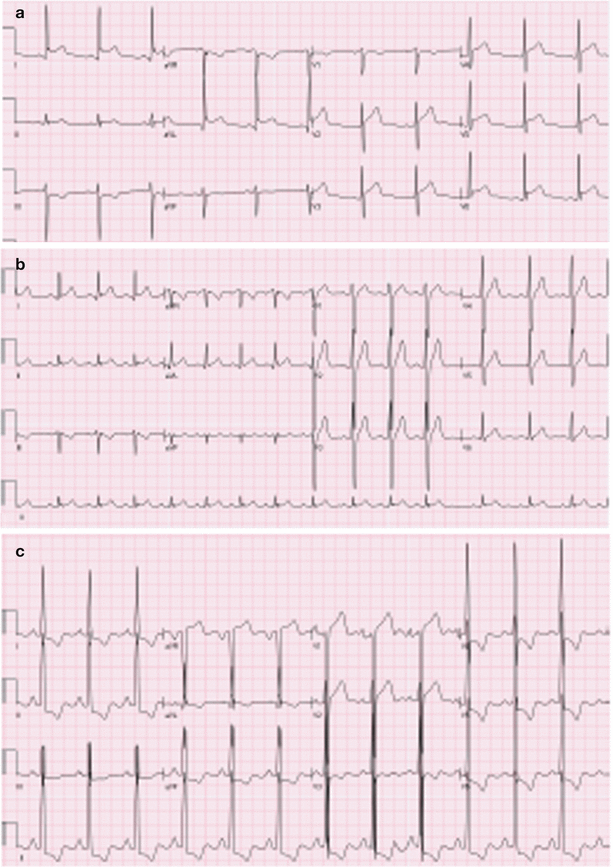
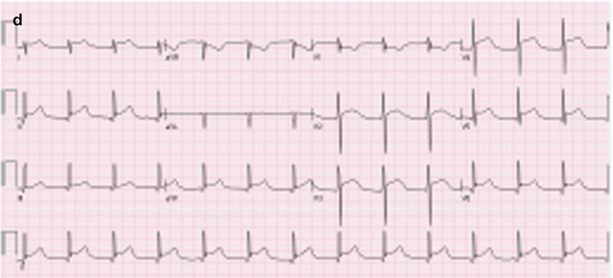
Fig. 9.2
Samples of common patterns of nonischemic ST elevation. (a) Sinus rhythm with left ventricular hypertrophy. There is ST elevation with characteristic notched J point in leads I, II, aVL, V5-V6, compatible with early repolarization. There is also mild ST elevation with concave pattern in leads V2-V3 compatible with normal variant of ST elevation. (b) Sinus rhythm. There is mild concave ST elevation in leads V2-V5, characteristic of normal variant of ST elevation seen in young persons (mainly males). (c) Sinus rhythm. Criteria for biatrial enlargement. There are criteria for left ventricular hypertrophy with repolarization changes: ST depression with T wave inversion in leads I, II, III, aVL, avF, V3-V6. In addition, there is marked ST elevation in leads V1-V2 and aVR. (d) P waves are not seen, suggestive of junctional rhythm. There is diffuse ST elevation in leads I, II, III, aVF, V2-V6 with reciprocal ST depression in leads aVR and V1, typical for acute pericarditis. The notched J point in the inferolateral leads may also be compatible with early repolarization
ECG Interpretation in STEMI
The ECG recorded during the acute phase of ischemia reveals crucial information concerning the site of occlusion of the coronary artery, the estimated size of the ischemic area at risk and the “severity” of ischemia [8].
After an acute epicardial coronary artery occlusion T waves become tall and peaked (Fig. 9.3). Then, ST elevation develops, representing “transmural” ischemia. Without successful reperfusion, ST elevation may persist for weeks. Q waves usually develop after 4 h evolving during the ensuing 2 weeks. At 4–24 h, the terminal portion of the T wave in the leads with ST elevation becomes negative and gradually the magnitude of ST elevation diminishes in conjunction with evolution of the Q wave. The exception to this rule is the development of left ventricular aneurysm. With left ventricular aneurysm formation, Q waves develop and T waves may begin their inversion without complete resolution of ST segment elevation. ST segment abnormalities often persist for the life of the patient or until transplantation. However, with prompt reperfusion therapy (either thrombolytic therapy or primary percutaneous coronary intervention) rapid evolution is seen. In most cases with successful reperfusion, the magnitude of ST elevation diminishes rapidly and the T waves become inverted, usually with the development of Q waves. In cases with a short episode of vessel occlusion and prompt reperfusion, complete normalization of the ECG may be seen. Pathological Q waves have traditionally been considered as a sign of irreversible necrosis. However, gradual disappearance of Q waves may be seen over time, especially in patients with inferior STEMI, suggesting that following reperfusion Q waves do not always represent transmural scar [8, 10, 11].
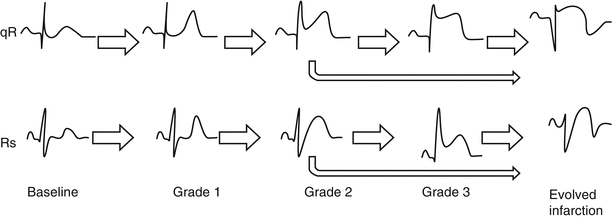
Fig. 9.3
Baseline ECG showing either a qR configuration (initial small and narrow Q wave followed by an R wave) or Rs configuration (initial R wave followed by an S wave, typical for leads V1-V3). The ST is isoelectric and the T wave is positive. The initial change of ischemia (Grade 1) is that the T wave become tall and symmetrical. In most patients, if the artery remains occluded, the ECG will proceed to grade 2: ST elevation without apparent changes in the QRS complex. In some patients additional changes in the QRS may be seen: The R wave becomes tall and the S wave amplitude decreases. Grade 3 of ischemia is defined as ST elevation at the J point more than 50 % of the R wave amplitude in leads with qR configuration and disappearance of the S waves in leads with original Rs configuration [8]. Without prompt reperfusion, further evolution occurs over days: R wave amplitude decreases, wide and deep Q waves appear, the magnitude of ST elevation decreases and the T waves become negative. Prompt reperfusion results in faster evolution with a decrease in the amplitude of the ST, inversion of the terminal portion of the T waves, reappearance of the S waves in leads with Rs configuration and a decrease in R wave amplitude, with or without appearance of abnormal Q waves
The ECG recorded during the initial presentation predicts the size and location of the ischemic area at risk; and thus, may assist in identification of the exact size of the occlusion of the coronary artery [8].
ST Elevation in Leads V1-V4
Acute occlusion of the LAD usually causes ST elevation in the precordial leads (V1-V4), with the ST elevation in leads V2-V3 greater than in lead V1 (Fig. 9.4). Occasionally, ST elevation may be seen also in leads V5-V6 (“extensive anterior STEMI”). Traditionally, it was thought that ST elevation limited to leads V1-V3 (“anteroseptal STEMI”) represents an infarct that is limited to the anteroseptal region and thus is smaller than “extensive anterior STEMI”. However, it has become clear that most of the “anteroseptal STEMIs” actually affect the anteroapical region and are not limited to the septum. Indeed, in many cases, there is an occlusion of a short LAD with preserved perfusion to the distal segments via large diagonal, obtuse marginal branches, or from a large right coronary artery (RCA). However, in some cases of proximal occlusion of a long wrapping LAD, ST elevation is limited to leads V1-V3 [12, 13]. As leads V1 and V6 are opposing each other, the injury vector of the basal segments and that of the lateral apical segments may cancel each other and no ST segment elevation is seen in leads V5-V6.
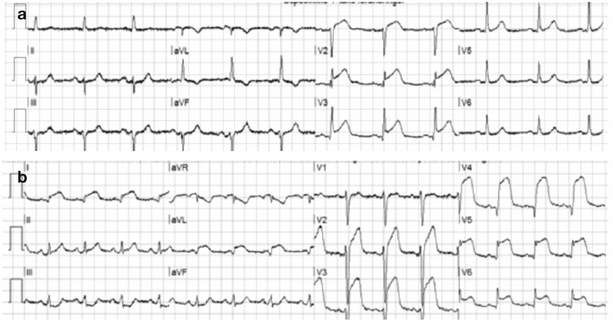
Fig. 9.4
(a) Acute “anteroseptal” STEMI. Sinus rhythm with left axis deviation. There is ST segment elevation in leads V1-V3. Some investigators suggest that ST elevation in lead V1 is an indicator of LAD occlusion proximal to the first septal perforator. However, there is no ST elevation in aVL or ST depression in the inferior leads to suggest occlusion proximal to the first diagonal branch. (b) Sinus rhythm. There is marked ST elevation in leads I, aVL, V2-V6. The changes in the terminal portion of the QRS in leads I, aVL V4-V5 are indicative of grade 3 of ischemia (see text). There is reciprocal ST depression in lead III. The pattern of ST deviation suggests occlusion of the LAD proximal to the first diagonal branch (ST elevation in I and aVL with ST depression in lead III). The LAD is not wrapping the apex, as involvement of the inferior wall would have attenuated ST elevation in I and aVL
Some investigators reported that ST elevation in lead V1 (and aVR) is a manifestation of ischemia of the basal septum and predicts proximal occlusion of the LAD before the first septal perforating branch.
However, proximal occlusion of the RCA may occasionally present with ST elevation in V1-V4 due to right ventricular involvement [8]. In these cases, ST elevation in lead V1 is usually greater than in lead V2; whereas in LAD occlusion, ST in lead V1 is smaller than in lead V2. Although some degree of right ventricular involvement is common in infarctions due to proximal RCA occlusion, usually involvement of the inferolateral segments (see below) induces ST depression in leads V1-V4 and therefore, attenuates ST elevation in these leads that are caused by right ventricular involvement. In cases where the inferolateral ischemia is less extensive (nondominant RCA, alternative blood supply by left posterior descending artery or wrapping LAD), ST elevation can be seen.
ST Elevation in Leads V5-V6
Leads V5-V6 are facing the distal lateral segments and the apex of the left ventricle. Involvement of the apex; and hence, ST elevation in leads V5-V6 may occur with infarction caused by LAD, left circumflex (LCX) and RCA occlusion. Thus, ST elevation in these leads may accompany ST elevation in the anterior or inferior leads. Isolated ST elevation in V4-V6, without ST elevation in V1-V3 or the inferior leads is usually caused by LCX or distal diagonal branch occlusion [8].
ST Elevation in Leads I and aVL
Leads I and aVL are facing the basal and mid lateral aspect of the left ventricle. This region receives blood flow from the first diagonal branch of the LAD, the first obtuse marginal branch of the LCX or occasionally from the ramus intermedius artery [8]. ST elevation in leads I and aVL (Fig. 9.4b), when accompanied by ST elevation in leads V1-V4, predicts a proximal occlusion of the LAD before the first diagonal branch. In these cases there will also be reciprocal ST depression in the inferior leads. This sign has high positive predictive value, but low sensitivity. In proximal occlusion of a long wrapping LAD, the resultant inferior ischemia attenuates the magnitude of ST elevation in leads aVL and I (as the inferior leads and leads I and aVL are facing opposite myocardial segments) [8].
Stay updated, free articles. Join our Telegram channel

Full access? Get Clinical Tree


