Fig. 13.1
Conduction system of the heart. Normal excitation originates in the sinoatrial node and then propagates through both atria (internodal tracts shown as dashed lines). The atrial depolarization spreads to the atrioventricular node and passes through the bundle of His (not labeled) and then to the Purkinje fibers which make up the left and right bundle branches; subsequently all ventricular muscle becomes activated. AV atrioventricular, SA sinoatrial
One of the most conspicuous features of sinoatrial nodal cells is that they possess poorly developed contractile apparati (a common feature to all myocytes specialized for conduction), comprising only about 50 % of the intracellular volume [34]. In general, although it cannot be seen grossly, the location of the sinoatrial node is on the “roof” of the right atrium at the approximate junction of the superior vena cava, the right atrial appendage, and the sulcus terminalis. In the adult human, the node is approximately 1 mm below the epicardium, 10–20 mm long and up to 5 mm thick [35]. For more details on cardiac anatomy, refer to Chaps. 5 and 6.
After initial sinoatrial nodal excitation, depolarization spreads throughout the atria. The exact mechanisms involved in the spread of impulses (excitation) from the sinoatrial node across the atria are somewhat controversial [36]. However, it is generally accepted that: (1) the spread of depolarizations from nodal cells can go directly to adjacent myocardial cells and (2) preferentially ordered myofibril pathways allow this excitation to rapidly transverse the right atrium to both the left atrium and the atrioventricular node. It is believed that there are three preferential anatomic conduction pathways from the sinoatrial node to the atrioventricular node (known as the node of Tawara) [37]. In general, these can be considered as the shortest electrical routes between the nodes. They are microscopically identifiable structures, appearing to be preferentially oriented fibers that provide a direct node-to-node pathway. In some hearts, pale staining Purkinje-like fibers have also been reported in these regions (tracts are shown as dashed lines in Fig. 13.1; also see Fig. 13.1 in the online supplemental material). More specifically, the anterior tract is described as extending from the anterior part of the sinoatrial node, bifurcating into the so-called Bachmann’s bundle (delivering impulses to the left atrium) and a second tract that descends along the interatrial septum which connects to the anterior part of the atrioventricular node. The middle (or Wenckebach’s pathway) extends from the superior part of the sinoatrial node, runs posteriorly to the superior vena cava, then descends within the atrial septum, and may join the anterior bundle as it enters the atrioventricular node. The third pathway is described as being posterior (Thorel’s) which, in general, is considered to extend from the inferior part of the sinoatrial node, passing through the crista terminalis and the Eustachian valve past the coronary sinus to enter the posterior portion of the atrioventricular node. In addition to excitation along these preferential conduction pathways, general excitation spreads from cell to cell throughout the entire atrial myocardium via the specialized connections between cells, the gap junctions , which exist between all myocardial cell types (see below).
Toward the end of atrial depolarization, the excitatory signal reaches the atrioventricular node. This excitation reaches these cells via the aforementioned atrial routes, with the final excitation of the atrioventricular node generally described as occurring via the slow or fast pathways. The slow and fast pathways are functionally, and usually anatomically, distinct routes to the atrioventricular node. The slow pathway generally crosses the isthmus between the coronary sinus and the tricuspid annulus and has a longer conduction time but a shorter effective refractory period than the fast pathway. The fast pathway is commonly a superior route, emanating from the interatrial septum, and has a faster conduction rate but, in turn, a longer effective refractory period. Normal conduction during sinus rhythm occurs along the fast pathway, but higher heart rates and/or premature beats are often conducted through the slow pathway, since the fast pathway may be refractory at these rates.
Recent advances in the optical mapping of the human atrioventricular junction further elucidate the dual pathway electrophysiology [38]. More specifically, the dual characteristics of this function have been revealed using an S1–S2 pacing protocol; in this procedure, a stimulus (S1) of constant duration and amplitude is applied followed by a second stimulus (S2) of varying duration and amplitude. The S1–S2 interval is iteratively reduced until conduction block in the fast pathway occurs due to the long refractory period [38].
Though the primary function of the atrioventricular node may seem simple, that is, to relay conduction between the atria and ventricles, its structure is very complex. As a means to describe these complexities, mathematical arrays and finite element analysis models have been constructed to elucidate the underlying structure–function relationship of the node [39]. Figure 13.2 shows a 3D reconstruction of the region using a model of the heart stained with the voltage sensitive dye di-4-ANEPPS. The reconstruction includes histological and immunolabeling of marker proteins to identify various tissue types. Figure 13.3 shows the nodal reconstruction of a normal human heart as well as one from a patient who had an implanted left ventricular assist device. For examples of these reconstructions, see Videos 13.1, 13.2, and 13.3 in the online supplemental material.
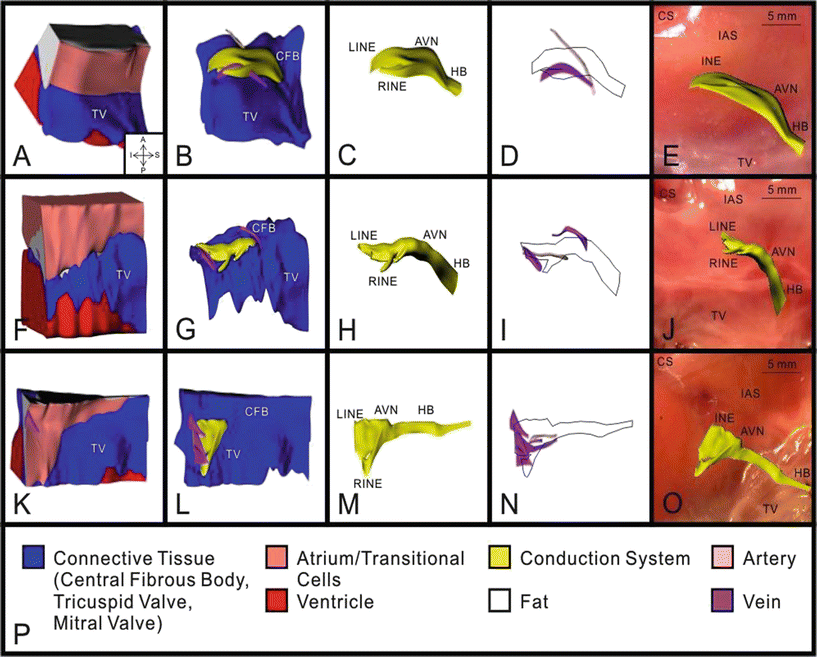
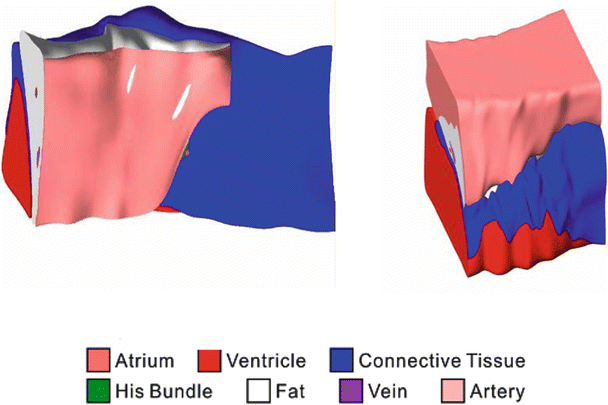

Fig. 13.2
3D reconstruction of atrioventricular (AV) junction from three human hearts: heart #1 (A–E), heart #2 (F–J), and heart #3 (K–O). A, F, and K: complete 3D reconstruction with all types of tissue visible. B, G, and L: 3D reconstruction with areas of atrium, ventricle, and fat removed. C, H, and M: 3D reconstruction of conduction system. D, I, and N: 3D reconstruction of major veins and arteries with conduction system outlined. E, J, and O: 3D reconstruction of conduction system superimposed on a photograph of the tissue used for its creation. P: key to the colors in A–O. AVN atrioventricular node, CFB central fibrous body, HB His bundle, LINE leftward inferior nodal extension, RINE rightward inferior nodal extension, TV tricuspid valve

Fig. 13.3
Atrioventricular reconstruction with normal and pathologic human hearts. The normal human heart (left) and the heart of a left ventricular assist device patient (right) show different proportions of tissue type in the nodal region
In general, the atrioventricular node is located in the so-called floor of the right atrium, over the muscular part of the interventricular septum and inferior to the membranous septum. Following atrioventricular nodal excitation, impulses are conducted to the His bundle (note that the bundle of His has also been referred to as the common bundle or His bundle ). If conduction follows the slow pathway, a longer interval is present between atrial and His activation. As mentioned above, the anatomical region in which the His bundle and the atrioventricular node both reside has been termed the triangle of Koch. The triangle is bordered by the coronary sinus, the tricuspid valve annulus along the septal leaflet, and the tendon of Todaro.
After leaving the bundle of His, the normal wave of cardiac depolarization spreads to both the left and right bundle branches; these pathways carry depolarization to the left and right ventricles, respectively. Finally, the signal broadly travels through the remainder of the Purkinje fibers and ventricular myocardial depolarization spreads (see Video 13.4 in the online supplemental material).
In addition to the normal path of ventricular excitation, direct connections to the ventricular myocardium from the atrioventricular node and the penetrating portion of the bundle of His have been described in humans [40]. The function and prevalence of these connections, termed Mahaim fibers , is poorly understood. An additional aberrant pathway existing between the atria and ventricles has been termed the bundle of Kent (the clinical manifestation of ventricular tachycardia due to the presence of this pathway is termed Wolff–Parkinson–White syndrome ); this pathway is commonly ablated.
Alternate representations of the cardiac conduction system are shown in Figs. 13.4 and 13.5. Details of the ventricular portion of the conduction system are shown in Fig. 13.6. More specifically, the left bundle branch splits into fascicles as it travels down the left side of the ventricular septum just below the endocardium (these can be visualized with proper staining). Its fascicles extend for a distance of 5–15 mm, fanning out over the left ventricle. Importantly, typically about midway to the apex of the left ventricle, the left bundle separates into two major divisions, the anterior and posterior branches (or fascicles). These divisions extend to the base of the two papillary muscles and the adjacent myocardium. In contrast, the right bundle branch continues inferiorly, as if it were a continuation of the bundle of His, traveling along the right side of the muscular interventricular septum. This bundle branch runs proximally just deep to the endocardium, and its course runs slightly inferior to the septal papillary muscle of the tricuspid valve before dividing into fibers that spread throughout the right ventricle. The complex network of conducting fibers that extends from either the right or left bundle branches is composed of the rapid conduction cells known as Purkinje fibers. The Purkinje fibers in both the right and left ventricles act as preferential conduction pathways to provide rapid activation and coordinate the excitation pattern within the various regions of the ventricular myocardium. As described by Tawara, these fibers travel within the trabeculations of the right and left ventricles, as well as within the myocardium. Due to the tremendous variability in the degree and morphology of trabeculations existing within and between species, it is likely that variations in the left ventricular conduction patterns also exist. It should be noted that one of the most easily recognized conduction pathways found in mammalian hearts is the moderator band, which contains Purkinje fibers from the right bundle branch (see also Chap. 6).
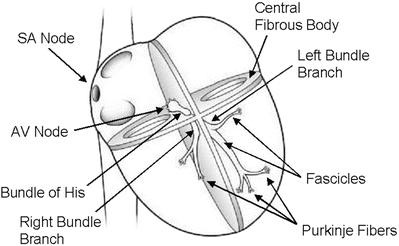
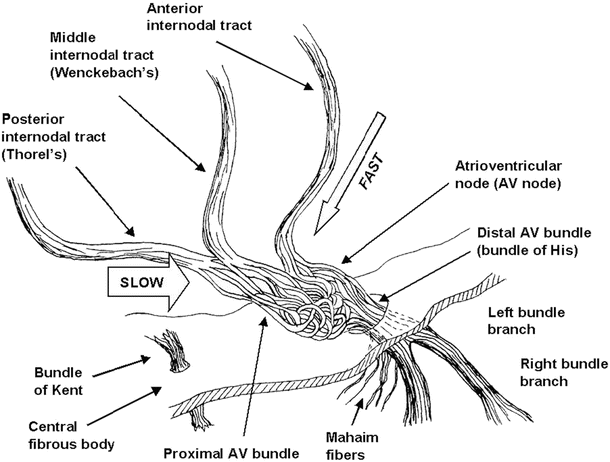
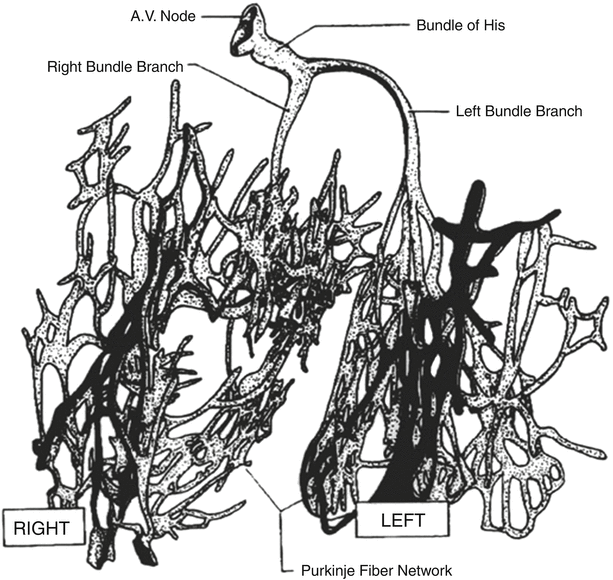

Fig. 13.4
Conduction system of the heart. Normal excitation originates in the sinoatrial node then propagates through both atria. The atrial depolarization spreads to the atrioventricular node and passes through the bundle of His to the bundle branches/Purkinje fibers. AV atrioventricular, SA sinoatrial

Fig. 13.5
Details of the atrioventricular nodal region. The so-called slow and fast conduction pathways are indicated by the arrows. To improve clarity in the visualization of the conduction anatomy, the fascicles of the atrioventricular node are not drawn to scale (their size was increased to allow the reader to visualize the tortuosity of the conduction pathway) and the central fibrous body has been thinned. AV atrioventricular

Fig. 13.6
Ventricular conduction system. The Purkinje network has a high interspecies and intraspecies variation, which likely results in variability in excitation and contractile patterns within the ventricles. This variability is evident in the dramatic differences seen in the degree and morphology of the cardiac trabeculations (which typically contain these fibers). Modified from DeHann DL, Circulation 1961; 24:458)
Three criteria for considering a myocardial cell as a specialized conduction cell were first proposed by Aschoff [41] and Monckeburg [42] in 1910, which include: (1) cells with the ability to histologically identify discrete features; (2) cells with the ability to track cells from section to section; and (3) these cells are insulated by fibrous sheaths from the nonspecialized contractile myocardium. It is noteworthy that only the cells within the bundle of His, the left and right bundle branches, and the Purkinje fibers satisfy all three criteria. No structure within the atria meets all three criteria, including Bachmann’s bundle, the sinoatrial node, and the atrioventricular node (which are all uninsulated tissues).
13.3 Cardiac Rate Control
Under normal physiologic conditions, the dominant pacemaker of the heart is the sinoatrial node which, in adults, fires at rates between 60 and 100 beats per minute, faster than any other cardiac region. In an individual at rest, modulation by the parasympathetic nervous system dominates which slows the sinoatrial nodal rate to about 75 action potentials per minute (or beats per minute when contractions are elicited).
In addition to the cells of the sinoatrial node, other specialized conduction system cells are capable of developing spontaneous diastolic depolarization, specifically those found in the specialized fibers in the atrioventricular junction and His–Purkinje system. Rhythms generated by impulse formation within these cells range from 25 to 55 beats per minute in the human heart (Fig. 13.7). These lower-rate rhythms are commonly referred to as ventricular escape rhythms and are important for patient survival, since they maintain some degree of cardiac output in situations when the sinoatrial and/or atrioventricular nodes are nonfunctional or are functioning inappropriately. Note that the various populations of pacemaker myocytes (i.e., in the sinoatrial and atrioventricular nodes) elicit so-called slow-type action potentials (slow-response action potential; see below).
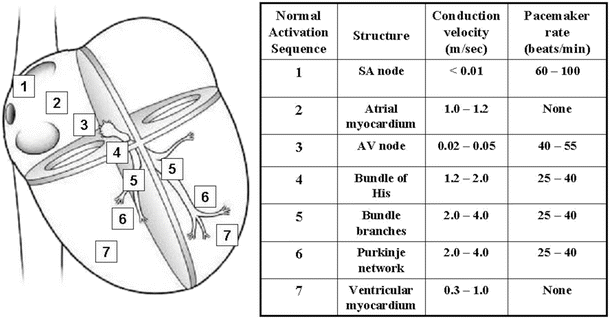

Fig. 13.7
Conduction velocities and intrinsic pacemaker rates of various structures within the cardiac conduction pathway. The structures are listed in the order of activation during a normal cardiac contraction, beginning with the sinoatrial node. Note that the intrinsic pacemaker rate is slower in structures further along the activation pathway. For example, the atrioventricular nodal rate is slower than the sinoatrial nodal rate. This prevents the atrioventricular node from generating a spontaneous rhythm under normal conditions, since it remains refractory at rates <55 beats per minute. If the sinoatrial node becomes inactive, the atrioventricular nodal rate will then determine the ventricular rate. Tabulation adapted from Katz AM (ed), Physiology of the Heart, 3rd edn., 2001)
In addition to the normal sources of cardiac rhythm, myocardial tissue can also exhibit abnormal self-excitability; such a site is also called an ectopic pacemaker or ectopic focus . This pacemaker may operate only occasionally, producing extra beats, or it may induce a new cardiac rhythm for some period of time. Potentiators of ectopic activity include caffeine, nicotine, electrolyte imbalances, hypoxia, and/or toxic reactions to drugs such as digitalis. For more detail on rate control of the heart, refer to Chap. 14.
13.4 Cardiac Action Potentials
Although cardiac myocytes branch and interconnect with each other (mechanically via the intercalated disk and electrically via the gap junctions), under normal conditions, the heart is thought to form two separate functional networks—the atria and the ventricles. The atrial and ventricular tissues are separated by the fibrous skeleton of the heart (the central fibrous body). This skeleton is comprised of dense connective tissue rings that surround the valves of the heart, fuse with one another, and merge with the interventricular septum. The skeleton can be considered to (1) form the foundation to which the valves attach, (2) prevent overstretching of the valves, (3) serve as a point of insertion for cardiac muscle bundles, and (4) act as an electrical insulator that prevents the direct spread of action potentials from the atria to the ventricles. See also Chap. 5 for further details on the cardiac skeleton.
A healthy myocardial cell has a resting membrane potential of approximately −90 mV. The resting potential is described by the Goldman–Hodgkin–Katz equation, which takes into account the permeabilities (Ps) as well as the intracellular and extracellular concentrations of ions [X], where X is the ion:
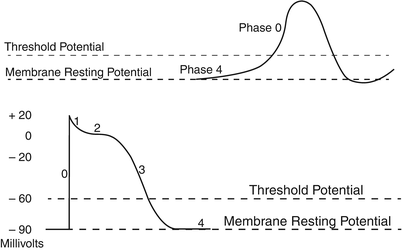
![$$ {V}_m=\left(2.3\;R*T/F\right)*{ \log}_{10}\frac{{\mathrm{P}}_{\mathrm{K}}{\left[\mathrm{K}\right]}_o+{\mathrm{P}}_{\mathrm{Na}}{\left[\mathrm{N}\mathrm{a}\right]}_o+{\mathrm{P}}_{\mathrm{Cl}}{\left[\mathrm{C}\mathrm{l}\right]}_i+\dots }{{\mathrm{P}}_{\mathrm{K}}{\left[\mathrm{K}\right]}_i+{\mathrm{P}}_{\mathrm{Na}}{\left[\mathrm{N}\mathrm{a}\right]}_i+{\mathrm{P}}_{\mathrm{Cl}}{\left[\mathrm{C}\mathrm{l}\right]}_o+\dots } $$](/wp-content/uploads/2016/07/A145597_3_En_13_Chapter_Equa.gif) In the cardiac myocyte, the membrane potential is dominated by the K+ equilibrium potential. An action potential is initiated when this resting potential becomes shifted toward a more positive value of approximately −60 to −70 mV (Fig. 13.8). At this threshold potential, the cell’s voltage-gated Na+ channels open and begin a cascade of events involving other ion channels. In artificial electrical stimulation, this shift of the resting potential and subsequent depolarization is produced by the excitation delivered through the pacing system. The typical ion concentrations for a mammalian cardiac myocyte are summarized in Table 13.1 and graphically depicted in Fig. 13.9.
In the cardiac myocyte, the membrane potential is dominated by the K+ equilibrium potential. An action potential is initiated when this resting potential becomes shifted toward a more positive value of approximately −60 to −70 mV (Fig. 13.8). At this threshold potential, the cell’s voltage-gated Na+ channels open and begin a cascade of events involving other ion channels. In artificial electrical stimulation, this shift of the resting potential and subsequent depolarization is produced by the excitation delivered through the pacing system. The typical ion concentrations for a mammalian cardiac myocyte are summarized in Table 13.1 and graphically depicted in Fig. 13.9.

![$$ {V}_m=\left(2.3\;R*T/F\right)*{ \log}_{10}\frac{{\mathrm{P}}_{\mathrm{K}}{\left[\mathrm{K}\right]}_o+{\mathrm{P}}_{\mathrm{Na}}{\left[\mathrm{N}\mathrm{a}\right]}_o+{\mathrm{P}}_{\mathrm{Cl}}{\left[\mathrm{C}\mathrm{l}\right]}_i+\dots }{{\mathrm{P}}_{\mathrm{K}}{\left[\mathrm{K}\right]}_i+{\mathrm{P}}_{\mathrm{Na}}{\left[\mathrm{N}\mathrm{a}\right]}_i+{\mathrm{P}}_{\mathrm{Cl}}{\left[\mathrm{C}\mathrm{l}\right]}_o+\dots } $$](/wp-content/uploads/2016/07/A145597_3_En_13_Chapter_Equa.gif)

Fig. 13.8
Typical cardiac action potentials (slow on top and fast below). The resting membrane potential, the threshold potential, and the phases of depolarization (0–4) are shown
Table 13.1
Ion concentrations for mammalian myocytes
Ion | Intracellular concentration (mM) | Extracellular concentration (mM) |
|---|---|---|
Sodium (Na) | 5–34 | 140 |
Potassium (K) | 104–180 | 5.4 |
Chloride (Cl) | 4.2 | 117 |
Calcium (Ca) | – | 3 |

Fig. 13.9
Cardiac cell at rest. The intracellular space is dominated by potassium ions, while the extracellular space has a higher concentration of sodium and calcium ions
When a myocyte is brought to the threshold potential, normally via a neighboring cell, voltage-gated fast Na+ channels actively open (activation gates); the permeability of the sarcolemma (plasma membrane) to sodium ions ( ) dramatically increases. Because the cytosol is electrically more negative than extracellular fluid, and the Na+ concentration is higher in the extracellular fluid, Na+ rapidly crosses the cell membrane. Importantly, within a few milliseconds, these fast Na+ channels automatically inactivate (inactivation gates) and
  decreases.
 ) dramatically increases. Because the cytosol is electrically more negative than extracellular fluid, and the Na+ concentration is higher in the extracellular fluid, Na+ rapidly crosses the cell membrane. Importantly, within a few milliseconds, these fast Na+ channels automatically inactivate (inactivation gates) and
  decreases.
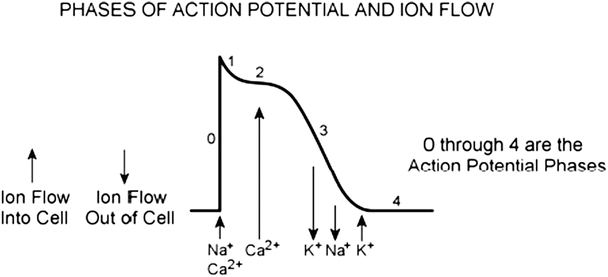
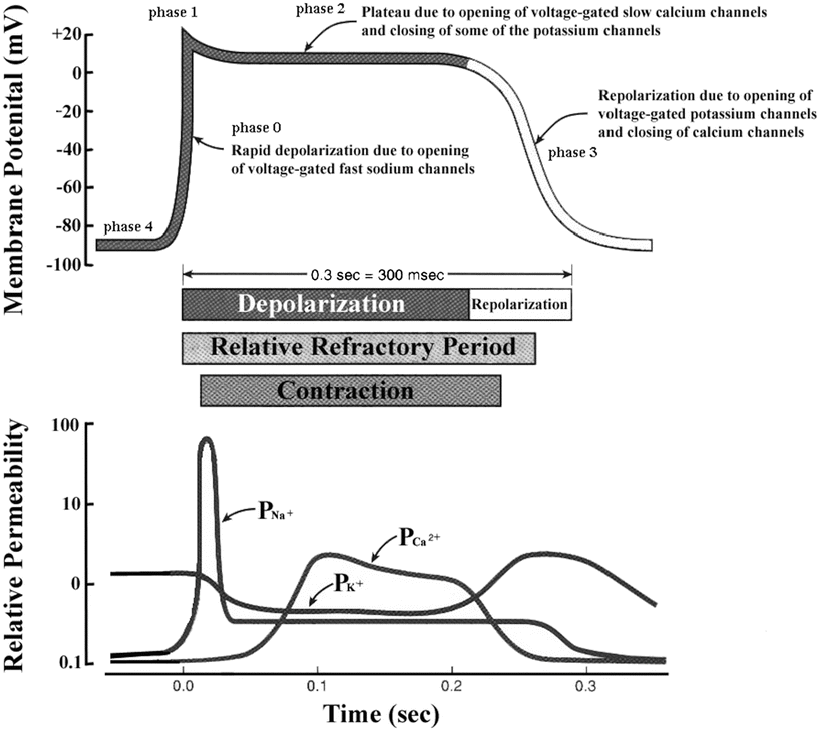
The membrane depolarization due to the activation of the Na+ induces the opening of the voltage-gated slow Ca2+ channels located within both the sarcolemma and sarcoplasmic reticulum (internal storage site for Ca2+) membranes. Thus, there is an increase in the permeability of Ca2+ ( ), which allows the concentration to dramatically increase intracellularly (Fig. 13.10). At the same time, the membrane permeability to K+ ions decreases due to closing of K+ channels. For approximately 200–250 ms, the membrane potential stays close to 0 mV, as a small outflow of K+ just balances the inflow of Ca2+. After this fairly long delay, voltage-gated K+ channels open and active repolarization is initiated. The opening of these K+ channels (increased membrane permeability) allows for K+ to diffuse out of the cell due to its concentration gradient. At this same time, Ca2+ channels begin to close, and net charge movement is dominated by the outward flux of the positively charged K+, restoring the negative resting membrane potential to approximately −90 mV (Figs. 13.10 and 13.11).
 ), which allows the concentration to dramatically increase intracellularly (Fig. 13.10). At the same time, the membrane permeability to K+ ions decreases due to closing of K+ channels. For approximately 200–250 ms, the membrane potential stays close to 0 mV, as a small outflow of K+ just balances the inflow of Ca2+. After this fairly long delay, voltage-gated K+ channels open and active repolarization is initiated. The opening of these K+ channels (increased membrane permeability) allows for K+ to diffuse out of the cell due to its concentration gradient. At this same time, Ca2+ channels begin to close, and net charge movement is dominated by the outward flux of the positively charged K+, restoring the negative resting membrane potential to approximately −90 mV (Figs. 13.10 and 13.11).
Fig. 13.10
Ion flow during the phases of a cardiac action potential

Fig. 13.11
A typical action potential of a ventricular myocyte and the underlying ion currents. The resting membrane potential is approximately −90 mV (phase 4). The rapid depolarization is primarily due to the voltage-gated Na+ current (phase 0), which results in a relatively sharp peak (phase 1) and transitions into the plateau (phase 2) until repolarization (phase 3). Also indicated are the refractory period and timing of the ventricular contraction. Modified from Tortora GJ, Grabowski SR (eds), Principles of Anatomy and Physiology, 9th edn., 2000
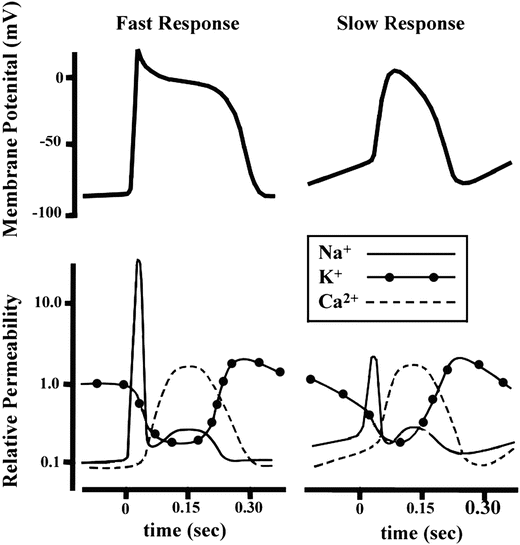
As mentioned above, not all action potentials that are elicited in the cardiac myocardium have the same time course; slow- and fast-response cells have differing shaped action potentials with different electrical properties in each phase. Recall that the pacemaker cells (slow-response type) have the ability to spontaneously depolarize until they reach threshold and thus elicit action potentials. Action potentials from such cells are also characterized by a slower initial depolarization phase, a lower amplitude overshoot, a shorter and less stable plateau phase, and repolarization to an unstable, slowly depolarizing resting potential (Fig. 13.12). In the pacemaker cells, at least three mechanisms are thought to underlie the slow depolarization that occurs during phase 4 (diastolic interval): (1) a progressive decrease in  , (2) a slight increase in
  , and (3) an increase in
  .
.
 , (2) a slight increase in
  , and (3) an increase in
  .
.
Fig. 13.12
The comparative time course of membrane potentials and ion permeabilities that would typically occur in a fast-response (left: ventricular myocyte) and a slow-response cell (right: nodal myocyte). Modified from Mohrman DE, Heller LJ (eds) Cardiovascular Physiology, 5th edn., 2003
13.5 Gap Junctions (Cell-to-Cell Conduction)
In the heart, cardiac muscle cells (myocytes) are connected end to end by structures known as intercalated disks . These are irregular transverse thickenings of the sarcolemma, within which there are desmosomes that hold the cells together and to which the myofibrils are attached. Adjacent to the intercalated disks are the gap junctions, which allow action potentials to directly spread from one myocyte to the next. More specifically, the disks join the cells together by both mechanical attachment and protein channels. The firm mechanical connections are created between the adjacent cell membranes by proteins called adherins in the desmosomes. The electrical connections (low-resistance pathways, gap junctions) between the myocytes are via the channels formed by the protein connexin. These channels allow ion movements between cells (Fig. 13.13).


Fig. 13.13
Several cardiac myocytes in different states of excitation. The depolarization that occurred in the cell on the left causes depolarization of the adjacent cell through cell-to-cell conduction via the gap junctions (nexus). Eventually all adjoining cells will depolarize. An action potential initiated in any of these cells will be conducted from cell to cell in either direction
As noted above, not all cells elicit the same type of action potentials, even though excitation is propagated from cell to cell via their interconnections (gap junctions). The action potentials elicited in the sinoatrial nodal cells are of the slow-response type and those in the remainder of the atria have a more rapid depolarization rate (Fig. 13.14). Although a significant temporal displacement in the action potentials elicited by the myocytes of the two nodes (sinoatrial and atrioventricular) occurs, the action potential morphologies are similar.
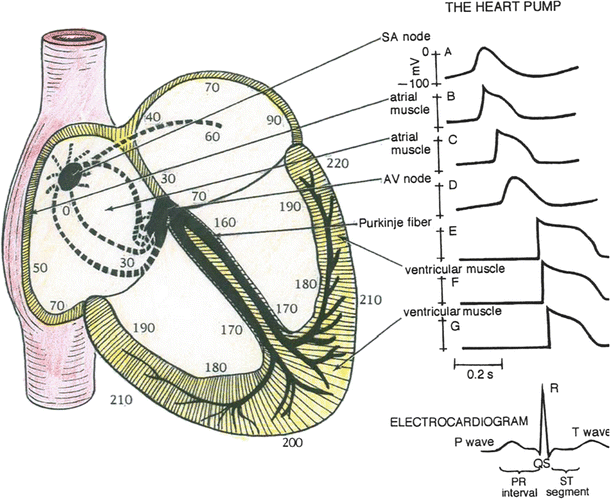

Fig. 13.14
Predominant conduction pathways in the heart and the relative time, in ms, that cells in these various regions become activated following an initial depolarization within the sinoatrial node. To the right are typical action potential waveforms that would be recorded from myocytes in these specific locations. The sinoatrial and atrioventricular nodal cells have similar shaped actions potentials. The nonpacemaker atrial cells elicit action potentials that have shapes somewhat between the slow-response (nodal) and fast-response cells (e.g., ventricular myocytes). The ventricular cells elicit fast-response-type action potentials; however, their durations vary in length. Due to the rapid excitation within the Purkinje fiber system, the initiation of depolarization of the ventricular myocytes occurs within 30–40 ms and is recorded as the QRS complex in the electrocardiogram
It takes approximately 30 ms for excitation to spread between the sinoatrial and atrioventricular nodes, and atrial activation occurs over a period of approximately 70–90 ms (Fig. 13.14). The speed at which an action potential propagates through a region of cardiac tissue is called the conduction velocity (Fig. 13.7). The conduction velocity varies considerably in the heart and is directly dependent on the diameter of a given myocyte. For example, action potential conduction is greatly slowed as it passes through the atrioventricular node. This is due to the small diameter of these nodal cells, the tortuosity of the cellular pathway [2], and the slow rate of rise of their elicited action potentials. This delay is important to allow adequate time for ventricular filling.
Action potentials in the Purkinje fibers are of the fast-response type (Fig. 13.14), i.e., rapid depolarization rates that, in part, are due to their large diameters. This feature allows the Purkinje system to transfer depolarization to the majority of cells in the ventricular myocardium nearly in unison. Because of the high conduction velocity in these cells which span the myocardium, there is a minimal delay in the cell’s time of onset. It is important to note that the ventricular cells that are last to depolarize have shorter duration action potentials (shorter Ca2+ current) and thus are the first to repolarize. The ventricular myocardium repolarizes within the time period represented by the T-wave in the electrocardiogram.
< div class='tao-gold-member'>
Only gold members can continue reading. Log In or Register to continue
Stay updated, free articles. Join our Telegram channel

Full access? Get Clinical Tree


