where PP = SBP − DBP, MAP = mean arterial pressure, DBP = diastolic blood pressure, PP = pulse pressure, and SBP = systolic blood pressure.
Blood flow throughout the circulatory system follows pressure gradients. By the time blood reaches the right atrium, representing the end point of the venous system, pressure will decrease to approx. 0 mmHg. The two major determinants of the arterial blood pressure are: (1) cardiac output, representing the volume of blood pumped by the heart (left ventricle) per minute, and (2) systemic vascular resistance, which is the impediment to blood flow created by the vascular bed. Cardiac output depends on a complexity of numerous factors including: preload, contractility, afterload, heart rate, and/or the heart’s relative rhythm. Systemic vascular resistance is equally complex and controlled by many additional factors including vasomotor tone of arterioles, terminal arterioles, and/or precapillary sphincters. Blood pressure as a function of the cardiac output and systemic vascular resistance can be expressed with the following abstract formula:
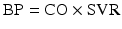 where BP = blood pressure, CO = cardiac output, and SVR = systemic vascular resistance.
Cardiac output is expressed by the formula: CO = HR × SV where HR = heart rate and SV = stroke volume. SVR is expressed by the formula: SVR = {(MAP − RAP) × 80}/CO where RAP is right atrial pressure.
Blood pressure decreases by 3–5 mmHg in arteries 3 mm in diameter and then reaches approx. 85 mmHg when entering arterioles; this accounts for approx. 50 % of the resistance of the entire systemic circulation. Blood pressure is further reduced to around 30–40 mmHg at the point of entry into capillaries and then becomes approx. 10 mmHg at the venous end of the capillaries.
The speed of the advancing pressure wave during each cardiac cycle far exceeds the actual blood flow velocity. In the aorta, the pressure wave speed may be 15 times faster than the flow of blood. In an end artery, the pressure wave velocity may be as much as 100 times the speed of the forward blood flow.
As the pressure wave moves peripherally through the arterial tree, wave reflection, refraction, and interference distort the pressure waveform, causing an exaggeration of systolic and pulse pressures. This enhancement of the peripheral pulse pressure can cause the systolic blood pressure in the radial artery to be 20–30 % higher than the aortic systolic blood pressure and the diastolic blood pressure to be approx. 10–15 % lower than the aortic diastolic blood pressure. Importantly, the mean blood pressure in the radial artery will closely correspond to the mean aortic arterial pressure.
18.2 Methods of Measuring Blood Pressure
Arterial blood pressure can be measured both noninvasively and invasively, as described in the following sections.
18.2.1 Noninvasive Methods
18.2.1.1 Palpation
Palpation is a relatively simple and easy method for assessing systolic blood pressure. For example, a blood pressure cuff containing an inflatable bladder is applied to the arm and inflated until the arterial pulse felt distal to the cuff disappears. Pressure in the cuff is then released at a speed of approx. 3 mmHg per heartbeat until an arterial pulse is felt again. The pressure at which the arterial pulsation can be detected is the systolic blood pressure; diastolic blood pressure and mean arterial pressure cannot be readily estimated using this method. Furthermore, the systolic blood pressure measured using the palpation method is typically an underestimation of the true arterial systolic blood pressure, i.e., because of insensitivity of one’s sense of touch and the relative delay between blood flow below the cuff and the appearance of arterial pulsations distal to the cuff.
18.2.1.2 Doppler Method
The Doppler method for blood pressure measurement is a modification and improvement of the palpation method. It uses a sensor Doppler probe to determine blood flow distal to the blood pressure cuff. The Doppler effect represents a shift in the frequency of a sound wave when a transmitted sound is reflected back from a moving object. Such a sound wave shift (e.g., caused by blood movement in an artery) is detected by a Doppler monitor and presented as a specific swishing sound. The pressure in the cuff, at which blood flow is detected by the Doppler probe, is the systolic arterial blood pressure. Doppler-assisted blood pressure measurement is more accurate and less subjective in estimating systolic blood pressure, compared to the palpation method. Using Doppler for blood pressure assessment is quite useful for patients in shock and patients in low-flow states, as well as obese and pediatric (very young) patients. Disadvantages of the Doppler method include: (1) an inability to detect the diastolic blood pressure, (2) a necessity for sound-conducting gel between the skin and the probe (air is a poor conductor of ultrasound), (3) the likelihood of a poor signal if the probe is not applied directly over an artery, and/or (4) the potential for motion and electrocautery artifacts.
18.2.1.3 Auscultation (Riva-Rocci Method)
The auscultation method uses a blood pressure cuff placed around an extremity (usually an upper extremity) and a stethoscope placed above a major artery just distal to the blood pressure cuff (e.g., the brachial artery if using the cuff on the upper extremity). Inflation of the blood pressure cuff above the patient’s systolic blood pressure flattens the artery and stops blood flow distal to the cuff. As the pressure in the cuff is released, the artery becomes only partially compressed, which creates conditions for turbulent blood flow within the artery and produces the so-called Korotkoff sounds , named after the individual who first described them. Dr. Nikolai Korotkoff first described these sounds which are caused by the vibrations created when blood flow in the partially flattened artery transforms from laminar into turbulent, and this state persists as long as there is a turbulent flow within the vessel. Systolic blood pressure is determined as the pressure of the inflated cuff at which Korotkoff sounds are first detected. Diastolic blood pressure is determined as the cuff pressure at which Korotkoff sounds become muffled or disappear.
Sometimes, in patients with chronic hypertension, there can be an auscultatory gap that represents disappearance of the normal Korotkoff sounds in a wide pressure range between the systolic and diastolic blood pressures. This condition will lead to an inaccurately low blood pressure assessment. Korotkoff sounds can also be difficult to detect in patients who are in shock, low cardiac output states, or in those with marked peripheral vasoconstriction. Increased systemic vascular resistance decreases vibration and decreases sound formation. Low systemic vascular resistance also leads to inaccurate readings as there is intermittent blood flow in the vessel. The use of microphones and electronic sound amplification can greatly increase the sensitivity of this method. Yet, considerations for systematic errors include motion artifact and electrocautery interference.
18.2.1.4 Oscillometry
Oscillometry is a noted method for blood pressure measurement which employs an automated blood pressure cuff. Arterial pulsations cause pressure oscillations in a cuff placed over an extremity. These oscillations are at their maximum when the cuff pressure equals the mean arterial pressure and decrease significantly when the cuff pressure is above the systolic blood pressure or below the diastolic blood pressure. Advantages of this approach include the ease and reliability of use; some of the potential technical problems include motion artifacts, electrocautery interference, and inability to measure accurate blood pressure when patients experience arrhythmias.
When selecting a blood pressure cuff for noninvasive blood pressure measurement, it is important to select the cuff in accordance with the given patient’s size; blood pressure cuffs for adult and pediatric patients come in variable sizes. An appropriate size means that the cuff’s bladder length is at least 80 % and the cuff width is at least 40 % of the patient’s arm circumference. If the cuff is too small, it will need to be inflated to a greater pressure to completely occlude the arterial blood flow, and the measured pressure can be falsely elevated. On the other hand, if the cuff is too large, the pressure inside the cuff needed for complete occlusion of the arterial blood flow will be less, and the measured pressure will likely be falsely low.
Blood pressure is most commonly taken while the patient is seated with the arm resting on a table and slightly bent, which will typically position the patient’s arm at the level of his/her heart. This same principle should be applied if the patient is in a supine position; the blood pressure cuff should be level with the patient’s heart. If the location of the blood pressure cuff during blood pressure measurement is above or below the patient’s heart level, measured blood pressure will be either falsely lower or higher than the actual pressure. This difference can be represented as the height of a column of water interposed between the level of the blood pressure cuff and the level of the patient’s heart. To convert centimeters of water (cm H2O) to millimeters of mercury, the measured height of the water column should be multiplied by a conversion factor of 0.74 (1 cm H2O = 0.74 mmHg).
All of the aforementioned methods for assessing blood pressure do so indirectly, by registering blood flow below a blood pressure cuff. Other noninvasive methods include plethysmography and arterial tonometry.
18.2.1.5 Plethysmography
The plethysmographic method for blood pressure assessment employs the fact that arterial pulsations cause a transient increase in the blood volume of an extremity and thus in the volume of the whole extremity. A finger plethysmograph determines the minimum pressure needed by a finger cuff to maintain constant finger blood volume. A light-emitting diode and a photoelectric cell are used to detect changes in the relative finger volume; this information is, in turn, used to rapidly adjust the cuff pressure. Data can be displayed as a beat-to-beat tracing. Thus, in healthy patients and those who are vasodilated, the blood pressure measured on a finger will correspond to the aortic blood pressure. This method allows for continuous noninvasive blood pressure measurement and, in addition, can provide information regarding pulse pressure and stroke volume variations (SVVs). Importantly, this relationship does not hold true for patients with low peripheral perfusion, such as those with peripheral artery disease, hypothermia, and/or patients in low-flow states.
18.2.1.6 Arterial Tonometry
Tonometry devices can be used to determine beat-to-beat arterial blood pressure by adjusting the pressure required to partially flatten a superficial artery located between a tonometer and a bony surface (e.g., radial artery). These devices commonly consist of an electronic unit and a pressure-sensing head. The system includes an adjustable air chamber and an array of independent pressure sensors that, when placed directly over the artery, assess intraluminal arterial pressures. The resultant pressure records resemble invasive arterial blood pressure waveforms. Yet, limitations to this method include motion artifacts and the need for frequent calibration.
18.2.2 Invasive Methods of Blood Pressure Measurement
18.2.2.1 Indications
Indications for using direct blood pressure monitoring (arterial cannulation) include consistent hemodynamic instability, intraoperative monitoring in selected patients, and use of vasoactive drugs such as dopamine, epinephrine, and norepinephrine. Invasive arterial blood pressure allows for beat-to-beat measurement of blood pressure as well as a method to access arterial blood supply.
18.2.2.2 Cannulation Sites
Arteries most often selected for direct cannulation are the radial, ulnar, brachial, femoral, dorsalis pedis, or axillary. Cannulation of an artery should be avoided if there is: (1) a considered lack of appropriate collateral circulation, (2) a skin infection on or near the site of cannulation, and/or (3) a known preexisting vascular deficiency (e.g., Raynaud’s disease). The radial artery is the most often selected artery for invasive blood pressure monitoring because of easy access, superficial location, and good collateral flow to the anatomic region it supplies.
18.2.2.3 Techniques
There are three techniques for arterial cannulation: (1) a catheter over a needle, (2) the Seldinger’s technique, and (3) real-time ultrasound guidance. When using the catheter over a needle technique , the operator enters a selected artery with a needle over which a catheter has been placed. After free blood flow through the needle, the catheter is advanced over the needle and into the artery, after which the needle is withdrawn. The catheter is then connected to a pressure-transducing system. When using the Seldinger’s technique, the operator first enters the artery with a needle. After confirmation of free blood flow through the needle, the operator places a steel wire into the artery and withdraws the needle. A plastic catheter is then advanced into the artery over the wire, and then the wire is removed and the catheter is connected to a transducer system. Real-time ultrasound guidance requires the use of a high-frequency transducer to visualize the artery and needle. One can use either the catheter over needle or Seldinger’s technique with the ultrasound to aid in the placement of the catheter. All three methods require sterile techniques and skilled operators.
18.2.2.4 Considerations
Invasive arterial pressure monitoring systems include a catheter (20 gauge for adults and 20–24 gauge for pediatric patients), tubing, a transducer, and an electronic monitor for signal amplification, filtering, and analysis. Such pressure transducers are commonly based on the strain gauge principle —stretching a wire of silicone crystal changes its electrical resistance. The catheter, the connective tubing, and the transducer are prefilled with saline, and the use of a pressure bag provides continuous saline flush of the system at a typical rate of 3–5 mL/h. These systems should also allow for intermittent bolus flushes.
Quality of information gathered using an invasive blood pressure monitoring depends on the dynamic characteristics of the whole system. For example, the complex waveform obtained from the arterial pulse can be expressed as a summation of simple sine and cosine waves using Fourier analysis. Most invasive blood pressure monitoring systems are designed to have natural frequencies of approx. 16–24 Hz, slightly exceeding the frequency of the arterial pulse waveform in order to reproduce it correctly. This natural frequency is described as that at which the system oscillates when disturbed. Another property of the catheter-tubing-transducer system is its dumping coefficient, characterizing how quickly oscillations in the system will spontaneously decay.
In a given case, both the natural frequency and the dumping coefficient are primarily determined by the length, size, and compliance of the catheter and tubing employed, as well as by the presence of any air bubbles or blood clots that may be trapped in the tubing. This chapter is not intended to go into details about how to determine and change the system characteristics but briefly describe how artifacts can be induced (e.g., underdamping the system will exaggerate artifacts). Further, a catheter whip can result in a significant overestimation of the systolic blood pressure. Likewise, overdamping will blunt the response of the catheter-tubing-transducer system and lead to an underestimation of the systolic blood pressure. In addition, systems with a low natural frequency will show amplifications of the pressure curves, thus causing overestimation of the systolic blood pressure. Diastolic blood pressure will also be affected by altering the abovementioned factors but to a lesser degree. Note that system response characteristics can be optimized by using short, low-compliance tubing and by avoiding air trapping by using a flushing system.
When an invasive blood pressure system is connected to a patient, it should be zero referenced and calibrated. Zero referencing is performed by placing the transducer at the level of the midaxillary line, which corresponds to the level of the patient’s heart when the patient is supine. The system is then opened to air, closed to the patient, and adjusted to a 0 mmHg baseline. Note that for proper zero referencing, it is not necessary for the transducer to be at the level of the patient’s heart as long as the stopcock, which is opened to air during zero referencing, is at that level. The system is then directed to record from the patient and thus is ready for use.
System calibration is a separate procedure and involves connecting the invasive blood pressure system to a mercury manometer, closing the system to the patient, and pressurizing it to certain predetermined pressures. The gain of the monitor amplifier is then adjusted until displayed pressure equals the pressure in the mercury manometer. Recommendations are to perform zero referencing at least once on every clinical shift and this type of calibration at least once daily. It should be noted that some of the more contemporary transducer designs rarely require external calibration.
When connected to a patient, today’s invasive blood pressure monitoring systems provide digital readings of systolic, diastolic, and mean blood pressures and pressure waveforms. Watching the trend of a waveform and its shape can provide other important information as well. More specifically, the top of the waveform represents the peak systolic blood pressure, and the bottom is the diastolic blood pressure. The dicrotic notch is caused by the closure of the aortic valve and backsplash of blood against the closed valve. The anacrotic notch is rarely seen distal to aortic root cannulation and thus is not useful in invasive blood pressure management. The rate of the upstroke of the arterial blood pressure wave depends on the myocardial contractility, whereas the rate of the downstroke is affected by the systemic vascular resistance. As the arterial waveform progresses down the arterial system, a steeper upstroke and decreased diastolic blood pressure are observed. This is due to the loss of kinetic energy as the wave travels down the arterial system as well as the change in elasticity in the arterial walls.
Importantly, exaggerated variation in the size of the waves with respiration typically suggests hypovolemia. Thus, the trained eye can gain insight about a patient’s cardiovascular status by evaluating aspects of this signal. Integrating the area under the waveform can be used for calculating the mean arterial pressure. Various invasive arterial line systems now perform arterial pressure waveform analysis in addition to calculating the mean arterial pressure. These systems allow for continuous cardiac output monitoring and also measurement of SVV, pulse pressure variation (PPV), and systolic pressure variation. Both SVV and PPV are excellent indicators of volume responsiveness. These systems use different methods of analyses which include: pressure recording analytical method, pulse power analysis, and pulse contour analysis. Despite these advances in arterial pressure waveform analyses, there are disadvantages to using such a system in that: (1) some require calibration or a central venous cannula to be placed; (2) some are inaccurate in patients with arrhythmias, hemodynamic instability, and/or the presence of ventricular assist devices and balloon pumps; and (3) some rely on an accurate arterial waveform to produce accurate information.
18.2.2.5 Complications
Potential complications associated with arterial cannulation include bleeding, hematoma, infection, thrombosis, ischemia distal to the cannulation site, vasospasm, embolization with air bubbles or blood clots, nerve damage, pseudoaneurysm formation, atheroma, and/or inadvertent intra-arterial drug injection.
18.3 Diagnoses
18.3.1 Pulsus Paradoxus
Normally, the arterial and venous blood pressures fluctuate throughout the respiratory cycle, decreasing with inspiration and rising with expiration. Yet, this fluctuation in the blood pressure under normal conditions is less than 10 mmHg. Inspiration increases venous return, therefore increasing the right heart output transiently, according to the Frank–Starling law. As the blood is sequestered in the pulmonary circulation during inspiration, the left heart output is reduced and is expressed as a lower systolic blood pressure. The right ventricle contracts more vigorously and mechanically bulges the interventricular septum toward the left ventricle, reducing its size and accounting for even lower systolic blood pressure. Pulsus paradoxus is defined as an inspiratory decrease of systolic blood pressure by more than 10 mmHg.
Certain conditions drastically reduce the transmural or distending (filling) pressure of the heart and interfere with the diastolic filling of the ventricles. In such cases, there is typically an exaggeration of the inspiratory fall in the systolic blood pressure, which results from reduced left ventricular stroke volume and the transmission of the negative intrathoracic pressure to the aorta. Common causes for such reduction include pericardial effusion, adhesive pericarditis, cardiac tamponade, pulmonary emphysema, severe asthma, paramediastinal effusion, endocardial fibrosis, myocardial amyloidosis, scleroderma, mitral stenosis with right heart failure, tricuspid stenosis, hypovolemia, and/or pulmonary embolism. Associated clinical signs include a palpable decrease in pulse with inspiration and decrease in the inspiratory systolic blood pressure of more than 10 mmHg compared to the expiratory pressure. On clinical examination, one can detect extra beats on cardiac auscultation during inspiration, when compared to a peripheral pulse. This may also be observed on an invasive arterial waveform.
< div class='tao-gold-member'>
Only gold members can continue reading. Log In or Register to continue
Stay updated, free articles. Join our Telegram channel

Full access? Get Clinical Tree


