The Aortic Valve
ECHO VIEWS OF THE AORTIC VALVE
The aortic valve is usually assessed in the:
left parasternal window
parasternal long axis view
parasternal short axis view (aortic valve level)
apical window
apical 5-chamber view.
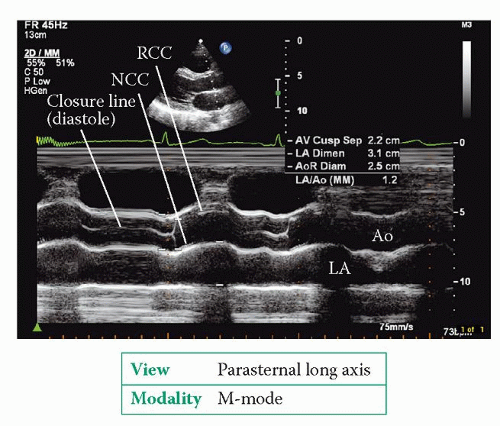
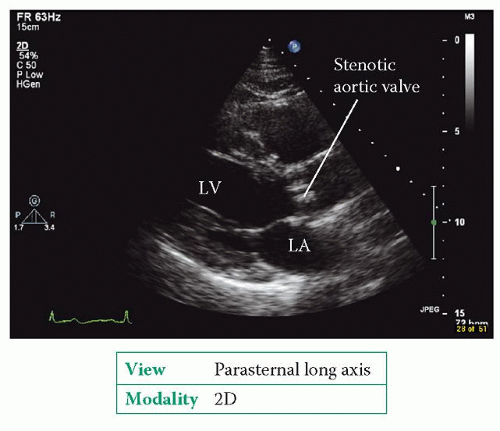
The parasternal long axis view (Fig. 6.2, p. 45) bisects the aortic valve, showing the right coronary cusp anterior to the non-coronary cusp. 2D imaging shows the structure of the aortic valve and allows an assessment of cusp mobility. An M-mode study of the valve, at the level of the cusp tips, shows the cusps opening at the start of systole (Fig. 19.1). The aortic root as a whole moves anteriorly during systole, being pushed forwards by the expanding left atrium (LA) as it fills during diastole. Conditions that enhance LA filling, such as mitral regurgitation, exaggerate this anterior motion of the aortic root. The aortic valve cusps close at the end of systole to make a single thin closure line. This M-mode pattern of normal aortic valve cusp motion is described as ‘box-shaped’. While in this view, use colour Doppler to assess valvular flow.
The parasternal short axis view (aortic valve level) shows the valve ‘face on’ and all three cusps can be seen together with the surrounding cardiac structures (Fig. 6.5, p. 48). Colour Doppler shows the location and extent of any valvular regurgitation.
The apical 5-chamber view allows further 2D inspection of the valve (Fig. 6.9, p. 53) and a colour Doppler assessment of any regurgitant flow.
In this view a good alignment of continuous wave (CW) Doppler with the valve can usually be obtained, allowing an assessment of forward (and any regurgitant) flow. The normal aortic valve has a peak forward flow velocity <1.7 m/s and a valve area >2.0 cm2.
Additional information can also be obtained from the:
right parasternal window
apical 3-chamber (long axis) view
subcostal window
subcostal short axis view
suprasternal window
aorta view.
The right parasternal window provides an additional view from which the aortic valve can be interrogated using CW Doppler (e.g. using a stand-alone pencil probe). The apical 3-chamber (long axis) view is similar in many ways to the parasternal long axis view, but offers the advantage of a suitable angle for CW Doppler assessment
(Fig. 6.11, p. 55). The subcostal short axis view is seldom used but can visualize the aortic valve in short axis when good views cannot be obtained from the standard locations. The suprasternal window (aorta view) allows Doppler assessment of flow in the descending thoracic aorta, which is useful in aortic regurgitation.
(Fig. 6.11, p. 55). The subcostal short axis view is seldom used but can visualize the aortic valve in short axis when good views cannot be obtained from the standard locations. The suprasternal window (aorta view) allows Doppler assessment of flow in the descending thoracic aorta, which is useful in aortic regurgitation.
AORTIC STENOSIS
Aortic stenosis is the obstruction of blood flow from the left ventricle (LV) due to a narrowing of the aortic valve, or an obstruction just below or above the level of the valve.
Causes of aortic stenosis
Calcific degeneration of the aortic valve is one of the commonest causes of aortic stenosis. This is characterized by progressive fibrosis and calcification of the aortic valve, beginning at the base of the cusps. The early stage of this process is often referred to as ‘aortic sclerosis’, but this term is somewhat misleading – it implies a benign process, but in fact aortic sclerosis is often a prelude to the development of significant stenosis later on.
Bicuspid aortic valve (p. 286) is also a common cause of aortic stenosis in the West, and is thought to be responsible for around half of cases of severe aortic stenosis in adults. The stenotic process is similar to that seen in calcific degeneration, but occurs at a younger age. Fibrosis typically starts in a patient’s teens, with gradual calcification in their thirties onwards. Patients who require surgery for stenosis of a bicuspid aortic valve do so on average 5 years earlier than those with calcific degeneration of a tricuspid aortic valve.
Rheumatic aortic stenosis is less common than rheumatic mitral stenosis, and the two often coexist in the same patient. There is fusion of the commissures of the aortic valve cusps and the cusps themselves become fibrotic and eventually calcified.
Sub- and supravalvular obstruction cause a form of aortic stenosis in which the valve itself is unaffected but the obstruction lies below or above the valve. Subvalvular aortic stenosis can result from a fixed obstruction in the LV outflow tract (LVOT), usually a fibromuscular ridge or membrane, and may be associated with
other congenital heart defects in up to half of cases. It can also result from a dynamic obstruction in the LVOT, causing obstruction predominantly in mid-late systole, as in hypertrophic obstructive cardiomyopathy (p. 241). In supravalvular aortic stenosis, which is uncommon, there is a fixed obstruction in the ascending aorta, just above the sinuses of Valsalva, due to a diffuse narrowing or a discrete membrane.
other congenital heart defects in up to half of cases. It can also result from a dynamic obstruction in the LVOT, causing obstruction predominantly in mid-late systole, as in hypertrophic obstructive cardiomyopathy (p. 241). In supravalvular aortic stenosis, which is uncommon, there is a fixed obstruction in the ascending aorta, just above the sinuses of Valsalva, due to a diffuse narrowing or a discrete membrane.
Clinical features of aortic stenosis
The clinical features of aortic stenosis are summarized in Table 19.1. Many cases of aortic stenosis are detected incidentally, either because of a systolic murmur heard during a routine examination or as an incidental finding during an echocardiogram for other indications. The appearance of symptoms has significant implications for the patient’s outlook: those with angina as a result of aortic stenosis have an average life expectancy of 5 years, those with exertional syncope 3 years, and those with heart failure just 1 year.
Table 19.1 Clinical features of aortic stenosis | ||||||||||||||||
|---|---|---|---|---|---|---|---|---|---|---|---|---|---|---|---|---|
|
Echo assessment of aortic stenosis
2D and M-mode
Is it a tricuspid aortic valve, or is it bicuspid (or pseudobicuspid), unicuspid or quadricuspid? If there is cusp fusion, describe which cusps are involved.
Is there any thickening of the cusps? How severe?
Is there any calcification of the cusps? How severe (mild = isolated spots, moderate = larger spots, severe = extensive)? Is this diffuse or focal? If focal, which area of each cusp is affected? Is there calcification in the LVOT or aorta?
Is cusp mobility normal or restricted? Grade any cusp restriction as mild (restricted in basal third only), moderate (affecting basal and middle third) or severe (affecting entire cusp).
Is there any systolic doming of the cusps?
Is there an asymmetric closure line (suggesting a bicuspid valve)?
Is there any evidence of sub- or supravalvular stenosis?
Planimetry of the aortic valve orifice area in the parasternal short axis view (aortic valve level) can be challenging, particularly with heavily calcified cusps, and is not routinely recommended. It can sometimes be useful, however, if Doppler estimation of aortic valve effective orifice area (see below) cannot be performed reliably.
SUB- OR SUPRAVALVULAR AORTIC STENOSIS
Always be alert to this possibility if the transaortic pressure gradient is unexpectedly high in the presence of an aortic valve that does not look stenosed. If you suspect sub- or supravalvular stenosis, use pulsed-wave (PW) Doppler to assess blood flow at different levels above and below the valve to detect where the main flow acceleration occurs. Use 2D echo to look carefully for a discrete membrane causing obstruction above or below the valve.
Colour Doppler
Colour Doppler imaging will show an increase in flow velocity and/or turbulent flow at valve level and downstream of the stenosis. If turbulence is seen proximal to the aortic valve, look carefully for any evidence of LVOT obstruction.
CW and PW Doppler
Use CW Doppler to obtain a trace of forward flow through the aortic valve (Fig. 19.3). Obtain traces from the apex and from at least one other position, such as the suprasternal or right parasternal position, and make recordings with both an
imaging probe and a standalone ‘pencil’ probe. Ignore traces obtained from ectopic beats (and the beat following an ectopic).
imaging probe and a standalone ‘pencil’ probe. Ignore traces obtained from ectopic beats (and the beat following an ectopic).
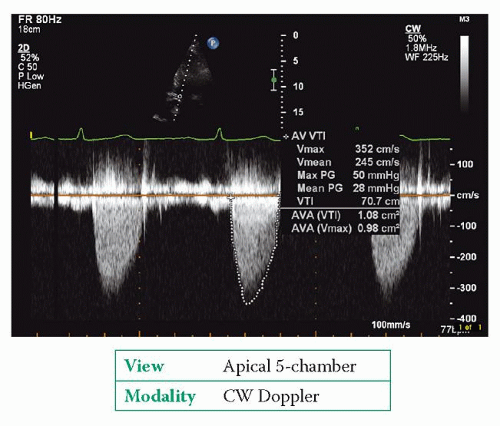 |
In severe aortic stenosis, the CW Doppler trace is rounded in shape with the peak velocity occurring in mid-systole. In mild aortic stenosis, the trace has a more triangular shape with an earlier peak.
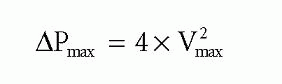
The CW Doppler trace will give peak transaortic velocity (Vmax), which relates to peak transaortic pressure gradient (ΔPmax) via the simplified Bernoulli equation:
If peak velocity in the LVOT is >1.0 m/s, use the full Bernoulli equation for greater accuracy:
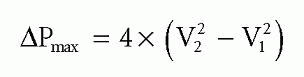
where V2 is the peak transaortic velocity, assessed by CW Doppler, and V1 is the peak LVOT velocity, assessed by PW Doppler.
PEAK-TO-PEAK AND INSTANTANEOUS GRADIENTS
Transaortic gradient can also be assessed during cardiac catheterization, by measuring the fall in systolic pressure on withdrawing a catheter across the aortic valve. The gradient measured in this way is a peak-to-peak gradient – it is the difference between the peak pressure in the LV and the peak pressure in the aorta (which do not occur simultaneously – see Fig. 2.6, p. 10). In contrast, the gradient measured by echo Doppler is an instantaneous gradient – it measures the maximum instantaneous pressure difference between the two chambers. Instantaneous gradients are greater than peak-to-peak gradients, and so peak transaortic gradients measured by echo will be higher than gradients measured by cardiac catheterization.
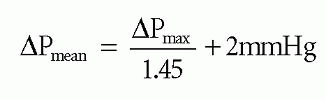
The mean transaortic pressure gradient (ΔPmean) can be obtained by tracing the Doppler envelope, from which the echo machine can calculate a mean value by averaging the instantaneous gradients throughout the trace. Alternatively, ΔPmean can be estimated from the ΔPmax using the equation:
Conditions that increase stroke volume (e.g. aortic regurgitation, pregnancy) increase transaortic flow during systole and can therefore lead to an overestimation of transaortic pressure gradients. Conversely, transaortic pressure gradients are underestimated in the presence of impaired LV function. These problems can, to some extent, be compensated for by using the continuity equation to measure aortic valve effective orifice area (EOAAV). To do this:
1. Measure the diameter of the LVOT in the parasternal long axis view, and then use this to calculate the cross-sectional area (CSA) of the LVOT:
2. Now measure the velocity time integral (VTI) of flow in the LVOT (using PW Doppler) and across the aortic valve (using CW Doppler) to give VTILVOT and VTIAV, respectively.
3. Use the continuity equation to calculate aortic valve EOA as follows:
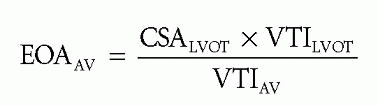
If you measured the LVOT diameter in centimetres, this will give you an EOAAV in cm2. Some versions of the continuity equation use the ratio of peak velocities in the LVOT and across the aortic valve instead of using VTIs – however, although the results are often very similar, they are not identical and it is better to use VTI for the calculation.
You will find more information on the assessment of aortic stenosis in the setting of impaired LV function in Chapter 8, ‘Stress echo’.
COMMON PITFALLS
Pitfalls in the echo assessment of aortic stenosis include:
Stay updated, free articles. Join our Telegram channel

Full access? Get Clinical Tree


