Little is known regarding temporal trends in characteristics and outcomes of young (≤50 years) patients who develop symptomatic premature coronary artery disease (CAD). The aim of this study was to describe temporal trends in clinical characteristics and outcomes and gender differences in patients with premature CAD undergoing percutaneous coronary intervention (PCI) over 3 decades. A retrospective analysis of 2,922 consecutive patients ≤50 years of age undergoing PCI from 1980 through 2007 was conducted. Baseline characteristics and in-hospital and long-term outcomes were compared by decade. Gender differences and predictors of mortality were analyzed in the most recent cohort. Although most patients were men (80%), there was an increasing proportion of women over time. An increasing prevalence of diabetes mellitus (10% in 1980 to 1989, 16% in 1990 to 1999, 20% in 2000 to 2007, p <0.001), hypertension (29%, 41%, 57%, p <0.001), and hyperlipidemia (39%, 55%, 73%, p <0.001) coincided with increasing body mass index (28.2 ± 4.6, 29.9 ± 5.8, 30.9 ± 6.7 kg/m 2 , p <0.001). The proportion of smokers decreased (84%, 76%, 74%, p <0.001). In-hospital mortality (1.0%, 0.8%, 0.9%, p = 0.93) and long-term mortality at 5 years (6%, 6%, 7%, p = 0.97) did not change over time. In contemporary PCI practice, women with premature CAD were more likely to have diabetes mellitus (25% vs 19%, p = 0.02), single-vessel disease (56% vs 41%, p <0.001), and a bleeding complication. In conclusion, there is an increasing burden of cardiovascular risk factors, related mostly to obesity, in patients with premature CAD requiring PCI. Long-term morbidity or mortality in these patients has not improved over the previous 3 decades.
A small proportion of patients manifest symptoms of coronary artery disease (CAD) at a relatively young age and are often referred to as having premature CAD. Previous studies have demonstrated that patients with premature CAD are predominantly men and have a high prevalence of conventional cardiovascular risk factors and a family history of premature CAD. There is a paucity of data on temporal trends in the cardiovascular risk factor profile and outcomes in this patient population. We hypothesized that there is an increasing burden of cardiovascular risk factors in patients with premature CAD due to adverse lifestyle trends and that their long-term outcomes have not improved. Thus, the aim of this study was to describe trends in clinical characteristics and outcomes of patients with premature CAD undergoing percutaneous coronary intervention (PCI) over the previous 3 decades.
Methods
Since 1979, patients undergoing percutaneous coronary revascularization at the Mayo Clinic in Rochester, Minnesota have been prospectively followed in our registry, which includes demographic, clinical, angiographic, and procedural data. Immediate postprocedure and in-hospital events are recorded and each patient is surveyed by telephone using a standardized questionnaire at 6 months, 1 year, and then annually after the procedure by trained data technicians. The inclusion criterion was an age ≤50 years in patients undergoing PCI. Patients were excluded if they declined authorization allowing use of their medical records for research, as required by Minnesota statute. Of patients with >1 qualifying procedure, only the earliest procedure was used. We identified 2,922 patients who met these criteria. Patients were grouped into 3 eras according to time of PCI: group 1, January 1980 to December 1989 (n = 523); group 2, January 1990 through December 1999 (n = 1,265); and group 3, January 2000 through December 2007 (n = 1,134). For comparison, data regarding clinical characteristics and in-hospital outcomes are provided for patients >50 years old for the most recent period. The study was approved by the Mayo Clinic institutional review board.
Hypertension was defined as a documented history of hypertension treated with medication. Hyperlipidemia was defined as any history of total cholesterol measurement >240 mg/dl or treatment with a lipid-lowering agent. Diabetes mellitus was defined as a documented history of diabetes treated with medication or diet. Multivessel CAD required ≥70% diameter stenosis in 1 major artery and ≥50% stenosis in a second major vessel. Patients with ≥50% diameter stenosis in the left main coronary artery were considered to have 2-vessel disease if there was right dominance and 3-vessel disease if there was left dominance. Major adverse cardiovascular events (MACEs) were defined as ≥1 of the following: (1) in-hospital death; (2) Q-wave myocardial infarction (MI); (3) urgent or emergency coronary artery bypass grafting (CABG) during the index hospitalization; and (4) cerebrovascular accident defined as transient ischemic attack or stroke. The Mayo Clinic Risk Score estimates the risk of MACE based on 8 clinical and angiographic variables. MI was diagnosed in the presence of 2 of the following 3 criteria: (1) typical chest pain for ≥20 minutes; (2) increase of serum creatinine kinase levels (or the MB fraction) >2 times normal; and (3) a new Q wave on electrocardiogram. In-hospital deaths included all deaths during the index hospital admission. Severe renal dysfunction was defined as a creatinine level >3.0 mg/dl or a history of dialysis or renal transplantation. Procedural success was defined as a decrease of residual luminal diameter stenosis to ≤20% in ≥1 treated lesion without in-hospital death, Q-wave MI, or CABG to allow comparison among the different eras. Long-term outcomes included all-cause mortality and the combined end point of death or any MI and target lesion revascularization. Target lesion revascularization was defined as any attempted percutaneous or surgical revascularization of the target lesion after the initial procedure.
Continuous data are summarized as mean ± SD unless otherwise stated. Categorical data are summarized as frequency (group percentage). Trends in distributions of continuous variables across the 3 periods were tested using a linear contrast of means in association with analysis of variance. Trends in categorical data were tested with the Armitage trend test. For comparison of patients ≤50 years old versus others in the current era and comparison between men and women, 2-sample t tests and Pearson chi-square tests were used. Kaplan-Meier methods are used to estimate follow-up event rates, with follow-up beginning at time of discharge (patients who died in hospital were excluded). Trends in follow-up risk were tested using a Cox proportional hazards model with the 3 groups scored as 1, 2, and 3 and modeled continuously. A multiple logistic regression model was employed to estimate the adjusted association between era and in-hospital mortality. Covariates chosen for adjustment were selected by clinical relevance. A Cox proportional hazards multiple regression model was used to investigate which variables were associated with follow-up mortality in patients ≤50 years old undergoing PCI in the 2000 to 2007 cohort. A backward selection variable procedure was employed on the following variables chosen for clinical relevance: MI within 1 week, preprocedure shock, history of congestive heart failure, diabetes mellitus, hypertension, body mass index (linear), hyperlipidemia, ever smoked, peripheral vascular disease, history of cerebral vascular accident/transient ischemic attack, moderate/severe renal disease, chronic obstructive pulmonary disease, tumor/lymphoma/leukemia, and multivessel disease. Variables were removed from the model if they were not significant at the 0.05 level. Expected mortality was calculated based on a cohort matched by age, gender, and calendar year of birth from the Minnesota white population.
Results
Clinical characteristics of the 2,922 patients in the 3 periods are presented in Table 1 . Patients with premature CAD represent 17%, 13%, and 11% (p <0.001) of the entire PCI population for the 3 periods, respectively. Most patients were men. Prevalence of diabetes mellitus, hypertension, hyperlipidemia, and obesity increased over time. However, the proportion of patients who were current or former smokers decreased. Prevalence of ≥1 of the risk factors obesity, diabetes mellitus, smoking, hypertension, or hyperlipidemia in the 3 eras were 95%, 96%, and 97% (p = 0.14 for trend). Frequency distribution of risk factors in the most recent cohort is presented in Figure 1 . Preprocedure risk for PCI as estimated by the Mayo Clinic Risk Score increased over time. Compared to patients >50 years old (2000 to 2007), patients with premature CAD had fewer co-morbidities except for a higher prevalence of obesity and smoking, and they were more likely to have had a MI within the preceding 7 days.
| Variable | 1980–1989 (n = 523) | 1990–1999 (n = 1,265) | 2000–2007 (n = 1,134) | p Value (age ≤50) | 2000–2007 (age >50) (n = 9,479) | p Value (age ≤50 vs >50, 2000–2007) |
|---|---|---|---|---|---|---|
| Age (years) | 44.8 ± 4.7 | 45.1 ± 4.8 | 45.5 ± 4.8 | 0.007 | 69.5 ± 10.0 | |
| Men | 438 (84%) | 1,031 (82%) | 880 (78%) | 0.002 | 6,539 (69%) | <0.001 |
| Diabetes mellitus | 52 (10%) | 200 (16%) | 228 (20%) | <0.001 | 2,468 (26%) | <0.001 |
| Hypertension | 151 (29%) | 506 (41%) | 583 (57%) | <0.001 | 6,927 (77%) | <0.001 |
| Hyperlipidemia | 164 (39%) | 600 (55%) | 711 (73%) | <0.001 | 7,120 (82%) | <0.001 |
| Smoking status | <0.001 | <0.001 | ||||
| Never | 79 (15%) | 284 (23%) | 290 (26%) | 3,402 (37%) | ||
| Former | 153 (29%) | 330 (26%) | 255 (23%) | 4,459 (49%) | ||
| Current | 289 (55%) | 641 (51%) | 569 (51%) | 1,329 (14%) | ||
| Obesity | 166 (32%) | 521 (43%) | 550 (49%) | <0.001 | 3,875 (41%) | <0.001 |
| Body mass index (kg/m 2 ) | 28.2 ± 4.6 | 29.9 ± 5.8 | 30.9 ± 6.7 | <0.001 | 29.6 ± 5.7 | <0.001 |
| Most recent myocardial infarction (days) | <0.001 | <0.001 | ||||
| <1 | 110 (21%) | 260 (21%) | 387 (34%) | 1,912 (21%) | ||
| 1–7 | 76 (15%) | 219 (17%) | 188 (17%) | 1,465 (16%) | ||
| >7 | 125 (24%) | 270 (21%) | 133 (12%) | 1,890 (20%) | ||
| Never | 212 (41%) | 508 (40%) | 415 (37%) | 4,039 (43%) | ||
| Mayo Clinic Risk Score predicted risk (%) | 0.6 (0.4–0.8) | 0.8 (0.6–1.5) | 1.1 (0.8–1.5) | <0.001 | 2.1 (1.5–3.9) | <0.001 |
| Preprocedure shock | 36 (3%) | 48 (4%) | 0.21 | 396 (4%) | 0.90 | |
| Previous percutaneous coronary intervention | 0 (0%) | 109 (9%) | 136 (12%) | <0.001 | 2,440 (24%) | <0.001 |
| Previous coronary bypass surgery | 36 (7%) | 117 (9%) | 73 (6%) | 0.33 | 2,029 (21%) | <0.001 |
| Peripheral vascular disease | 33 (4%) | 41 (4%) | 0.93 | 1,020 (11%) | <0.001 | |
| Cerebrovascular disease | 21 (2%) | 38 (3%) | 0.19 | 1,139 (12%) | <0.001 | |
| Moderate/severe renal disease | 29 (3%) | 42 (4%) | 0.60 | 353 (4%) | 0.96 |
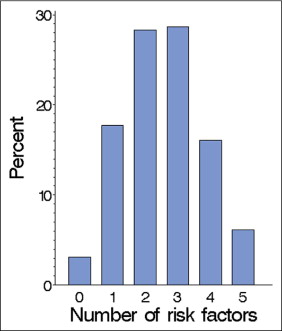
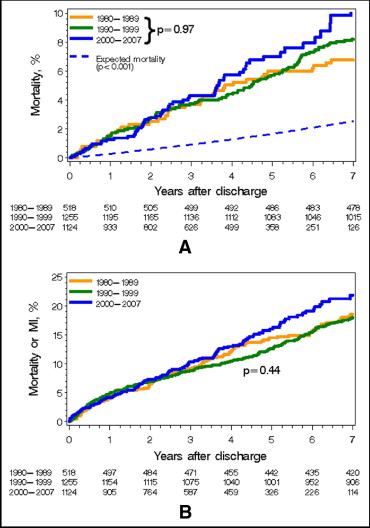
Table 2 presents angiographic and procedural characteristics in the 3 groups. Most patients had type B2 or C culprit lesions. Procedural success increased over time (31%, 71%, 94%, p <0.001) despite increased lesion complexity. Compared to patients >50 years old (2000 to 2007), patients with premature CAD were more likely to have single-vessel disease. In-hospital outcomes are presented in Table 2 . Although there was no change in unadjusted in-hospital mortality over time, in-hospital rates of Q-wave MI, CABG, target lesion revascularization, and MACE decreased significantly. Kaplan–Meier estimates for all-cause mortality and combined end point of death or MI during follow-up are shown in Figure 2 . Median follow-ups (interquartile ranges) were 21.0 years (19.1 to 24.0), 11.2 years (9.1 to 14.1), and 3.7 years (1.9 to 6.0) for the 3 groups. During follow-up, there was no significant difference in unadjusted mortality rates (p = 0.97 for trend over groups). At 5 years, mortality rates were 6%, 6%, and 7%, respectively. Risk-adjusted long-term mortality (for history of diabetes, hypertension, hyperlipidemia, current smoking, body mass index, MI within 1 week, congestive heart failure, and medication score) also did not differ in the 3 groups (p = 0.21). There was no difference in the combined end point of death or MI (p = 0.44) with event rates at 5 years of 14%, 13%, and 16%, respectively. However, rates of target lesion revascularization decreased significantly (27%, 25%, 19%, p <0.001). Figure 3 illustrates independent predictors of long-term mortality in the most recent cohort. Variables removed from the model (MI within previous week, peripheral vascular disease, history of cerebral vascular accident/transient ischemic attack, preprocedure shock, body mass index, hypertension) had p values >0.30 at the time of removal.
| Variable | 1980–1989 (n = 523) | 1990–1999 (n = 1,265) | 2000–2007 (n = 1,134) | p Value (age ≤50) | 2000–2007 (age >50) (n = 9,479) | p Value (age ≤50 vs >50, 2000–2007) |
|---|---|---|---|---|---|---|
| Single vessel coronary disease | 237 (47%) | 501 (41%) | 449 (43%) | 0.38 | 2,590 (30%) | <0.001 |
| Worst lesion type | <0.001 | 0.50 | ||||
| A | 34 (3%) | 32 (3%) | 235 (3%) | |||
| B1 | 232 (23%) | 181 (19%) | 1,475 (17%) | |||
| B2 | 376 (38%) | 289 (30%) | 2,835 (33%) | |||
| C | 354 (36%) | 468 (48%) | 4,098 (47%) | |||
| Urgency of percutaneous coronary intervention | <0.001 | 0.075 | ||||
| Elective | 485 (93%) | 626 (50%) | 319 (28%) | 3,219 (34%) | ||
| Urgent | 0 (0%) | 369 (29%) | 458 (40%) | 4,343 (46%) | ||
| Emergency | 38 (7%) | 268 (21%) | 357 (31%) | 1,914 (20%) | ||
| Number of vessels treated | 0.52 | 0.056 | ||||
| 1 | 467 (89%) | 1,120 (89%) | 979 (86%) | 7,949 (84%) | ||
| 2 | 54 (10%) | 138 (11%) | 146 (13%) | 1,400 (15%) | ||
| 3 | 2 (0%) | 7 (1%) | 9 (1%) | 127 (1%) | ||
| Use of drug-eluting stents | 0 (0%) | 0 (0%) | 502 (44%) | <0.001 | 4,006 (42%) | 0.20 |
| Glycoprotein IIb/IIIa inhibitors use | 0 (0%) | 288 (23%) | 782 (69%) | <0.001 | 5,715 (60%) | <0.001 |
| In-hospital outcomes | ||||||
| Death | 5 (1.0%) | 10 (0.8%) | 10 (0.9%) | 0.93 | 194 (2.0%) | 0.007 |
| Q-wave myocardial infarction | 8 (1.5%) | 4 (0.3%) | 1 (0.1%) | <0.001 | 22 (0.2%) | 0.32 |
| Coronary bypass surgery | 41 (7.8%) | 20 (1.6%) | 13 (1.1%) | <0.001 | 70 (0.7%) | 0.14 |
| Target lesion revascularization | 53 (10.1%) | 45 (3.6%) | 16 (1.4%) | <0.001 | 108 (1.1%) | 0.42 |
| Major adverse cardiovascular events | 29 (5.5%) | 28 (2.2%) | 19 (1.7%) | <0.001 | 295 (3.1%) | 0.007 |
| Admission medications | ||||||
| Aspirin | 175 (34%) | 915 (73%) | 992 (88%) | <0.001 | 8,244 (88%) | 0.81 |
| β Blocker | 204 (39%) | 775 (61%) | 895 (79%) | <0.001 | 7,035 (75%) | 0.003 |
| Angiotensin-converting enzyme inhibitors | 0 (0%) | 140 (13%) | 356 (32%) | <0.001 | 3,831 (41%) | <0.001 |
| Lipid-lowering drug | 0 (0%) | 220 (20%) | 374 (33%) | <0.001 | 4,028 (43%) | <0.001 |
| Discharge medications | ||||||
| Aspirin | 422 (81%) | 1,191 (95%) | 1,095 (97%) | <0.001 | 8,912 (95%) | 0.010 |
| β Blocker | 186 (36%) | 871 (69%) | 976 (87%) | <0.001 | 7,680 (82%) | <0.001 |
| Angiotensin-converting enzyme inhibitors | 0 (0%) | 241 (19%) | 643 (57%) | <0.001 | 5,333 (57%) | 0.98 |
| Lipid-lowering drug | 0 (0%) | 512 (41%) | 729 (65%) | <0.001 | 6,271 (67%) | 0.12 |