In the absence of a previous global comparison, we examined the variability in the prevalence of angina across 52 countries and its association with body weight and the poverty index using data from the World Health Organization-World Health Survey. The participants with angina were defined as those who had positive results using a Rose angina questionnaire and/or self-report of a physician diagnosis of angina. The body mass index (BMI) was determined as the weight in kilograms divided by the square of the height in meters. The poverty index (a standard score of socioeconomic status for a given country) was extracted from the United Nations’ statistics. The associations of angina with the BMI and poverty index were analyzed cross-sectionally using univariate and multivariate analyses. The results showed that the total participants (n = 210,787) had an average age of 40.64 years. The prevalence of angina ranged from 2.44% in Tunisia to 23.89% in Chad. Those participants with a BMI of <18.5 kg/m 2 (underweight), 25 to 29 kg/m 2 (overweight), or BMI ≥30 kg/m 2 (obese) had a significantly greater risk of having angina compared to those with a normal BMI (≥18.5 but <25 k/m 2 ). The odds ratios of overweight and obese for angina remained significant in the multilevel models, in which the influence of the country-level poverty status was considered. A tendency was seen for underweight status and a poverty index >14.65% to be associated with the risk of having angina, although these associations were not statistically significant in the multilevel models. In conclusion, significant variations were found in the anginal rates across 52 countries worldwide. An increased BMI was significantly associated with the odds of having angina.
Evidence of the global variability in angina pectoris (AP) rates has been limited. In the present study, we examined the prevalence of AP across 52 countries using data from the World Health Organization-World Health Survey (WHS) and to examine the associations between the body mass index (BMI) and odds of having AP. However, because huge differences exist in the socioeconomic development among different countries, we applied multilevel analysis techniques to test the BMI–AP association (individual level), taking into account the influence of the country-level socioeconomic status (SES), assessed using the poverty index, on the AP rates. The advantage of using a multilevel analysis is that it takes the hierarchical structure of the data (e.g., both the individual and the country level effects on health) into account by specifying random effects at each analysis level. Thus, this approach of multilevel modeling will result in a more conservative inference for the associations between the predictors and outcomes.
Methods
The present analysis was conducted cross-sectionally using individual data from the WHS and country-level data on SES from the United Nations’ health statistics.
The study design and methods of the WHS have been previously described in detail. In brief, the WHS, with a cross-sectional study design, was administered in 70 countries in 2002 to 2003. The countries included in the survey comprised a large proportion of the world’s population and geographically represented the 6 World Health Organization regions. These included high-, middle-, and low-income countries. The target population included adult, men and women, aged ≥18 years, living in private households, who were not out of the country during the survey period. In the WHS, randomized national samples, using a multistage cluster design, were obtained in all countries, except for the 6 countries of China, Comoros, the Republic of Congo, Côte d’Ivoire, India, and the Russian Federation. A Kish table was used to select the respondents within each household. Face-to-face interviews were conducted by lay people with at least a high school education. The interviewers had attended a weeklong training course using a standard protocol manual and participated in field interviews that were reviewed by the supervisors before actual data collection. In addition to the standard questions asked of all participants regarding social demographic variables, general health status, and chronic health condition, each country was able to select additional questionnaire modules of specific research interest. Of the 70 countries, 52 countries administered the dietary behavior module. These countries represented 6 regions, with 18 countries from the African region, 6 from the Americas, 4 from the Eastern Mediterranean region, 14 from the European region, 5 from the South-East Asia region, and 5 from the Western Pacific region. The present analysis included data from these 52 countries, because they had completed data on the BMI and dietary habits.
In the WHS, all questionnaires were translated and back-translated using a standard World Health Organization protocol. The quality of translations was independently verified by bilingual experts before field implementation. All respondents provided informed consent, and the study was cleared by the ethics review committees at each site.
Five chronic conditions were included in the WHS and defined according to the participants’ self-report medical history of a physician diagnosis, which included questions related to whether the respondent had ever been diagnosed with AP, diabetes mellitus, depression, asthma, or arthritis, and whether the respondent had ever received, or was currently receiving, therapy for these conditions. The classification of AP was also examined and defined according to the World Health Organization Rose questionnaires. The questionnaire is a validated instrument to assess the symptoms of typical AP in the general population. It is highly specific compared to physician-diagnosed AP and has been associated with coronary artery calcification and the risk of coronary events.
To examine whether cross-country difference in SES played a role in the associations between BMI and AP, we applied a multilevel analysis technique using country level data on the human poverty index (HPI). The HPI is an indication of the standard of living in a country that was developed by the United Nations. The calculation of the HPI has been previously described in detail by the United Nations. In brief, the HPI measures the deprivations in the 3 basic dimensions of human development: (1) early life expectancy, as measured by the probability at birth of not surviving to age 40 years; (2) adult illiteracy rate; and (3) the standard of living defined as the lack of access in overall economic provisioning, as measured by the percentage of the population not using an improved water source and the percentage of children who are underweight for age. A sum score is added to produce the HPI. Greater HPI levels indicate poorer SES status. In the present study, the HPI represented each country’s SES for 1998 to 2002.
To test the research questions, several univariate and multivariate analyses were conducted. In the first group analysis, the overall and age-specific prevalence of AP for each country were calculated. Next, the age-adjusted prevalence of AP was estimated using the 1999 World Health Organization’s World Standard Population. The standard error of the prevalence was estimated using Keyfitz’s method. The mean, standard error of the mean, and range of HPI have been described according to the 6 World Health Organization regions.
In the second group analysis, differences in age, gender, marital status, education, smoking status, vegetable and/or fruit intake, and participants’ self-reported history of a physician diagnosis of the chronic conditions of AP, diabetes mellitus, arthritis, asthma, and depression were stratified by 4 BMI groups. The BMI groups were defined according to the World Health Organization criteria of underweight (BMI <18.5 kg/m 2 ), normal weight (BMI 18.5 to 24 kg/m 2 ), overweight (BMI 25 to 29 kg/m 2 ), and obesity (BMI ≥30 kg/m 2 ).
In the third group analysis, multiple logistic regression models were used to examine the associations of AP with BMI and HPI separately. Odds ratios and 95% confidence intervals (CIs) of the BMI and HPI for the prevalence of AP were estimated, with adjustments for age and gender. The participants with a normal BMI were the reference group. We dichotomized HPI (<14.65% vs ≥14.65%) according to the 50% outpoint on the distribution of HPI across the 52 countries, because the distribution of this variable was quite wide.
In the fourth group analysis, multilevel analysis techniques were applied to account for the influence of HPI on the association between BMI and AP. In these analyses, generalized linear mixed models were conducted using the SAS GLIMMIX procedure. Three sets of models were tested. Model 1 was adjusted for age (per 10-year increase) and gender (male vs female). Model 2 was adjusted for age, gender, marital status (married vs unmarried), educational level (no formal education, elementary, middle school, vs high school or more), current smoking status (yes vs no), and vegetable and/or fruit intake (≥5 vs <5 servings/day). Finally, model 3 was adjusted for all covariates in model 2 plus the participants’ self-reported chronic condition of a physician diagnosis of diabetes mellitus, asthma, arthritis, or depression. The interaction effects of BMI with age, gender, and HPI on the odds of AP were tested.
Finally, sensitivity analyses were conducted to test the robustness of the models. In particular, we wanted to assess the effects of the country level variable HPI on the association between BMI and AP. We reran our models with exclusions of the extreme values (lowest and highest) of HPI. Because little change occurred in the overall results, we have presented our findings using the total sample size.
To account for the complex sampling design of the WHS, we used SAS software, version 9.1 (procedures for complex survey data) to adjust for sampling weights (SAS Institute, Cary, North Carolina). The level of significance was set at a 2-sided test at p ≤0.05.
Results
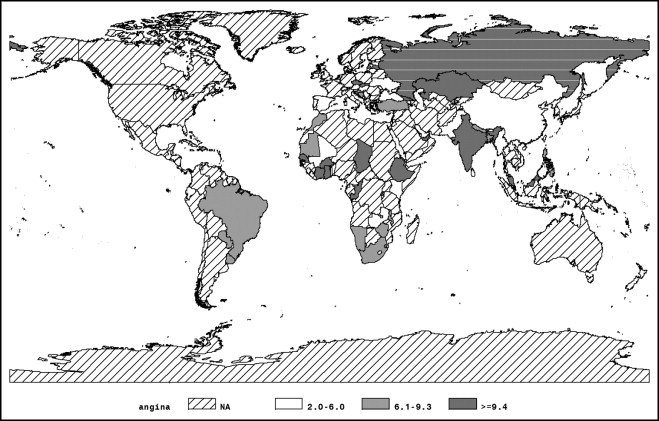
A total of 210,787 participants were included, with an average age of 40.64 years. The age range was 34.34 years (Slovenia) to 51.44 years (Russian) in the 52 countries of the WHS. The response rates ranged from 64.5% (Swaziland) to 99.9% (China). Table 1 lists the age-adjusted prevalence of AP, which ranged from 2.44% in Tunisia to 23.89% in Chad. Figure 1 depicts the significant variability in the prevalence of AP across the 52 countries.
| Country | Initial Sample Size | Final Sample Size (%) | Mean Age ± SEM | Crude Rate (SEP) | Age-Adjusted Rate (SEP) |
|---|---|---|---|---|---|
| Bangladesh | 5,942 | 5,509 (92.71) | 38.83 ± 0.30 | 8.57 (0.73) | 9.14 (0.42) |
| Bosnia Herzegovina | 1,031 | 1,012 (98.16) | 43.50 ± 0.58 | 7.32 (0.88) | 7.49 (0.73) |
| Brazil | 5,000 | 4,992 (99.84) | 41.06 ± 0.34 | 7.83 (0.45) | 7.77 (0.39) |
| Burkina Faso | 4,948 | 4,798 (96.97) | 36.81 ± 0.42 | 14.41 (1.12) | 14.99 (0.57) |
| Chad | 4,875 | 4,496 (92.23) | 36.45 ± 0.33 | 22.79 (1.75) | 23.89 (0.74) |
| China | 3,994 | 3,990 (99.90) | 45.07 ± 0.76 | 3.65 (0.71) | 3.31 (0.27) |
| Comoros | 1,836 | 1,752 (95.42) | 40.74 ± 0.53 | 5.49 (0.69) | 5.62 (0.56) |
| The Congo | 3,077 | 2,133 (69.32) | 35.32 ± 0.57 | 9.66 (1.58) | 11.34 (0.73) |
| Côte d’Ivoire | 3,251 | 3,089 (95.02) | 34.67 ± 0.42 | 8.57 (0.69) | 8.67 (0.55) |
| Croatia | 993 | 979 (98.59) | 49.46 ± 0.67 | 8.78 (1.08) | 9.94 (0.99) |
| Czech Republic | 949 | 915 (96.42) | 46.48 ± 1.17 | 8.20 (1.35) | 6.78 (0.89) |
| Dominican Republic | 5,027 | 4,497 (89.46) | 39.99 ± 0.41 | 4.28 (0.49) | 3.84 (0.29) |
| Ecuador | 5,677 | 4,403 (77.56) | 40.65 ± 0.42 | 5.28 (0.65) | 4.88 (0.33) |
| Estonia | 1,021 | 1,006 (98.53) | 49.71 ± 0.46 | 18.97 (1.28) | 14.15 (1.01) |
| Ethiopia | 5,090 | 4,651 (91.38) | 35.58 ± 0.31 | 14.81 (1.30) | 15.82 (0.60) |
| Georgia | 2,950 | 2,731 (92.58) | 45.87 ± 0.50 | 15.69 (1.07) | 13.32 (0.60) |
| Ghana | 4,165 | 3,898 (93.59) | 40.05 ± 0.40 | 5.77 (0.45) | 6.05 (0.39) |
| Guatemala | 4,890 | 4,689 (95.89) | 39.99 ± 0.24 | 4.91 (0.32) | 5.00 (0.33) |
| Hungary | 1,419 | 1,416 (99.79) | 49.78 ± 0.57 | 18.90 (1.24) | 13.63 (0.84) |
| India | 10,692 | 9,333 (87.29) | 38.35 ± 0.32 | 9.12 (0.85) | 11.03 (0.34) |
| Kazakhstan | 4,499 | 4,484 (99.67) | 42.56 ± 1.17 | 10.67 (1.56) | 12.62 (0.57) |
| Kenya | 4,640 | 4,322 (93.15) | 35.34 ± 0.44 | 3.29 (0.40) | 4.52 (0.33) |
| Lao People’s Democratic Republic | 4,989 | 4,815 (96.51) | 38.21 ± 0.28 | 5.16 (0.40) | 5.74 (0.35) |
| Latvia | 929 | 853 (91.82) | 50.48 ± 0.92 | 23.81 (1.77) | 15.73 (1.09) |
| Mali | 5,209 | 3,481 (66.83) | 41.93 ± 0.39 | 10.27 (0.78) | 9.23 (0.51) |
| Malawi | 5,551 | 4,582 (82.54) | 35.30 ± 0.48 | 14.38 (1.24) | 13.19 (0.56) |
| Malaysia | 6,145 | 5,999 (97.62) | 39.87 ± 0.37 | 4.35 (0.33) | 4.92 (0.29) |
| Mauritania | 3,907 | 3,620 (92.65) | 37.45 ± 0.39 | 9.31 (0.79) | 9.34 (0.50) |
| Mauritius | 3,968 | 3,880 (97.78) | 41.18 ± 0.35 | 4.97 (0.45) | 4.99 (0.36) |
| Morocco | 5,000 | 4,471 (89.42) | 40.08 ± 0.55 | 5.84 (0.63) | 6.39 (0.36) |
| Myanmar | 6,045 | 5,886 (97.37) | 40.62 ± 0.29 | 3.02 (0.48) | 3.03 (0.22) |
| Namibia | 4,379 | 3,952 (90.25) | 37.34 ± 0.48 | 8.10 (0.69) | 9.20 (0.51) |
| Nepal | 8,822 | 8,606 (97.55) | 38.79 ± 0.24 | 6.10 (0.37) | 6.06 (0.27) |
| Pakistan | 6,502 | 6,033 (92.79) | 37.56 ± 0.79 | 3.19 (0.40) | 3.75 (0.26) |
| Paraguay | 5,288 | 5,106 (96.56) | 38.95 ± 0.30 | 6.60 (0.40) | 7.42 (0.39) |
| Philippines | 10,083 | 9,913 (98.31) | 38.87 ± 0.25 | 6.40 (0.41) | 6.62 (0.27) |
| Russian Federation | 4,427 | 4,360 (98.49) | 51.44 ± 0.70 | 30.04 (1.79) | 17.66 (0.51) |
| Senegal | 3,465 | 2,699 (77.89) | 37.93 ± 0.41 | 9.88 (0.83) | 9.35 (0.58) |
| Slovakia | 687 | 579 (84.28) | 47.25 ± 0.75 | 20.03 (1.66) | 18.72 (1.74) |
| Slovenia | 2,535 | 1,783 (70.34) | 34.34 ± 0.88 | 4.20 (0.81) | 7.56 (0.74) |
| South Africa | 2,629 | 2,310 (87.87) | 37.56 ± 0.48 | 5.70 (0.65) | 8.10 (0.64) |
| Spain | 6,373 | 6,258 (98.20) | 50.35 ± 0.34 | 5.14 (0.40) | 3.26 (0.18) |
| Sri Lanka | 6,805 | 6,509 (95.65) | 41.40 ± 0.47 | 4.15 (0.91) | 4.57 (0.26) |
| Swaziland | 3,121 | 2,013 (64.50) | 38.88 ± 0.64 | 12.88 (2.09) | 9.83 (0.69) |
| Tunisia | 5,203 | 4,991 (95.93) | 40.11 ± 0.32 | 2.16 (0.24) | 2.44 (0.22) |
| Turkey | 11,481 | 11,184 (97.41) | 41.27 ± 0.25 | 6.38 (0.36) | 6.46 (0.24) |
| Ukraine | 1,183 | 1,152 (97.38) | 36.68 ± 0.48 | 3.70 (0.67) | 5.04 (0.83) |
| United Arab Emirates | 2,860 | 2,474 (86.50) | 46.30 ± 0.63 | 21.31 (1.72) | 16.33 (0.66) |
| Uruguay | 2,996 | 2,969 (99.10) | 44.50 ± 0.53 | 7.58 (0.82) | 7.21 (0.47) |
| Viet Nam | 4,174 | 3,485 (83.49) | 39.19 ± 0.48 | 4.94 (0.60) | 4.78 (0.38) |
| Zambia | 4,166 | 3,791 (91.00) | 35.41 ± 0.00 | 3.27 (0.00) | 4.04 (0.34) |
| Zimbabwe | 4,292 | 3,938 (91.75) | 37.04 ± 0.68 | 6.94 (0.69) | 7.63 (0.45) |
The data in Table 2 show that the African region had the greatest HPI (34.03), followed by the South-East Asia region, Eastern Mediterranean region, and Western Pacific region, region of the Americas (9.80), and the European region.
| World Health Organization region | n | HPI (%) | |
|---|---|---|---|
| Mean ± SEM | Range | ||
| African region | 18 | 34.03 ± 3.02 | 9.50–54.50 |
| Region of the Americas | 6 | 9.80 ± 2.24 | 3.00–19.70 |
| Eastern Mediterranean region | 4 | 19.05 ± 7.67 | 4.00–33.40 |
| European region | 14 | 5.03 ± 1.10 | 0.20–12.50 |
| South-East Asia region | 5 | 26.68 ± 3.58 | 16.80–36.10 |
| Western Pacific region | 5 | 13.86 ± 4.39 | 6.10–30.70 |
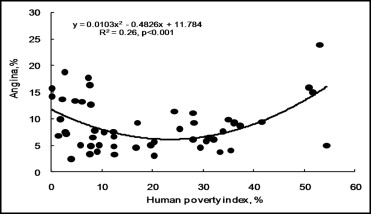
Figure 2 shows the tendency of a U -shaped association between the HPI and AP rates across the 52 countries. The differences in HPI explained 26% of the variance in the prevalence of AP worldwide (R 2 = 0.26).
The data in Table 3 show that the participants with a BMI ≥30 kg/m 2 had the greatest mean age, followed by those with a BMI of 25 to 29, <18.5, and 18.5 to 24 kg/m 2 (p <0.001). Significant differences in the proportions of gender, marital status, educational level, and smoking status were also observed in the different BMI groups.
| Individual Level | Body Mass Index Category ⁎ | p Value | |||
|---|---|---|---|---|---|
| Underweight | Normal Weight | Overweight | Obesity | ||
| Mean age (years) | 40.02 (0.20) | 38.61 (0.16) | 45.74 (0.26) | 48.98 (0.36) | <0.001 |
| Age ≥50 years | 29.10 (0.45) | 24.51 (0.45) | 40.07 (0.79) | 46.85 (1.14) | <0.001 |
| Men (%) | 42.09 (0.50) | 52.70 (0.59) | 49.67 (0.74) | 36.68 (1.03) | <0.001 |
| Married (%) | 67.32 (0.56) | 64.43 (0.60) | 69.00 (0.80) | 65.79 (1.32) | <0.001 |
| Educational level | |||||
| No formal education | 25.59 (0.69) | 17.22 (0.89) | 10.54 (0.73) | 10.40 (0.81) | |
| Elementary | 30.69 (0.56) | 24.32 (0.52) | 24.99 (0.71) | 26.53 (0.99) | <0.001 |
| Middle school | 33.48 (0.61) | 40.59 (0.58) | 41.14 (0.75) | 41.40 (1.18) | |
| High school or more | 10.25 (0.53) | 17.87 (0.53) | 23.33 (0.79) | 21.67 (1.21) | |
| Current smoker (%) | 24.30 (0.62) | 25.33 (0.73) | 20.77 (0.59) | 14.61 (0.79) | <0.001 |
| Vegetable/fruit intake ≥5 servings/day | 2.09 (0.34) | 2.53 (0.41) | 1.81 (0.19) | 2.37 (0.44) | 0.134 |
| Medical conditions (%) | |||||
| Angina pectoris | 9.61 (0.39) | 7.32 (0.30) | 12.34 (0.57) | 17.63 (0.95) | <0.001 |
| Diabetes | 2.70 (0.16) | 2.44 (0.14) | 6.12 (0.35) | 11.47 (1.07) | <0.001 |
| Arthritis | 16.79 (0.44) | 13.48 (0.44) | 17.44 (0.51) | 25.49 (1.00) | <0.001 |
| Asthma | 5.75 (0.24) | 5.52 (0.22) | 6.87 (0.47) | 8.02 (0.52) | <0.001 |
| Depression | 7.99 (0.38) | 8.57 (0.38) | 10.23 (0.52) | 11.60 (0.70) | <0.001 |
Stay updated, free articles. Join our Telegram channel

Full access? Get Clinical Tree


