Several systemic diseases can directly or indirectly affect the function and geometry of the heart. Here, we discuss the cardiac implications of the systemic diseases listed below and suggest an approach to cardiac imaging for each.
1.Rheumatic fever
2.Kawasaki disease
3.Autoimmune diseases (systemic lupus erythematosus, rheumatoid arthritis)
4.Human immunodeficiency virus infection
5.Metabolic syndrome
6.Cardiac diseases in cancer patients
7.Myocarditis
8.Sickle cell disease
9.Chronic kidney disease
RHEUMATIC FEVER
Rheumatic fever (RF) is an inflammatory disease caused by autoantibodies generated in response to group A β-hemolytic streptococcal infection. These antibodies cross-react with various cardiac structures—predominantly valves—resulting in their dysfunction.
Rheumatic fever is prevalent in developing countries and, in fact, most valve procedures performed in developing countries are to treat rheumatic mitral disease. Rheumatic fever is rarely encountered in developed countries, where the diagnosis is usually limited to immigrants and travelers from developing countries. Prompt diagnosis and treatment of Streptococcal pharyngitis has reduced the incidence of RF in the U.S. to less than 1%.
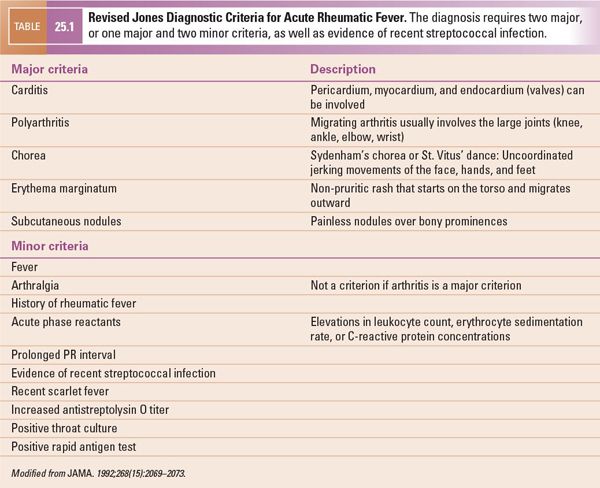
The diagnosis of RF is based on a combination of major and minor clinical criteria called the modified Jones criteria (Table 25.1). Carditis is one of the major criteria and can occur in up to 50% of affected patients. Carditis can involve the endocardium, myocardium, and pericardium to a variable degree, although valvulitis is clinically the most important problem. The mitral and aortic valves are involved more often than the right-sided valves. The aortic valve is rarely involved without coexisting mitral valvulitis. Acute valvulitis manifests as regurgitation, but with recovery, the regurgitation may lessen. Scarring of affected valves may lead to stenosis as a delayed complication. Myocarditis and pericarditis are not often seen and are almost nonexistent in the absence of valvulitis.
Goals of Imaging
The foremost objective of echocardiographic imaging is to diagnose carditis because it is a major diagnostic criterion for RF. Echocardiography further helps to define the presence, severity, and progression of abnormalities of valvar and myocardial structure and function. The mitral valve is usually the first valve to be affected (in 60% to 70% of cases); the aortic valve is the second (in 25% of cases); and the tricuspid valve is involved in only about 10% of cases.
During imaging, detailed information should be collected on valvar structure and function, particularly of the mitral and aortic valves. Myocardial dysfunction in acute RF can be caused by myocarditis or by acute valvar insufficiency. Pericardial effusion can usually be seen when myocarditis is present.
Rheumatic Mitral Valve Disease
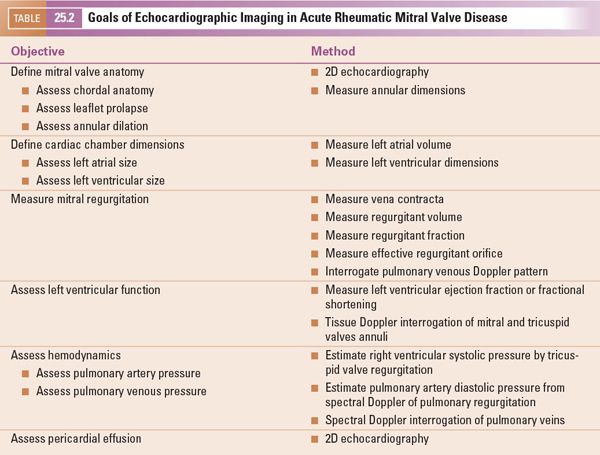
During the acute phase of RF, the primary echocardiographic findings are chordal lengthening and annular dilation, which lead to poor coaptation of the mitral valve leaflets and thus regurgitation (Table 25.2). Mitral valve prolapse, especially of the anterior mitral leaflet, can be seen on two-dimensional echocardiography (Fig. 25.1, Videos 25.1–25.4). Acute valvar regurgitation can also lead to dilation of the left atrium and left ventricle, which can also be detected by two-dimensional echocardiography.
Doppler echocardiography can measure valvar regurgitation and so can be used to assess the progression of the disease. It can also provide the hemodynamic data critical to planning interventions. Color Doppler echocardiography can detect degrees of regurgitation that cannot be auscultated. It can also measure the size and duration of the regurgitant jet, providing a rough estimate of the degree of regurgitation. The effective regurgitant orifice, volume, and fraction can be calculated with the proximal isovelocity surface area (PISA).
Regurgitant volume can also be calculated with a continuity equation if there is no aortic valve disease. The stroke volume, calculated by the aortic valve time-velocity index (TVI), is the same as the effective forward volume across the mitral valve. The actual forward volume across the mitral valve can be calculated by the TVI. The difference between the actual and the effective volumes across the mitral valve is the regurgitant volume. The regurgitant fraction is the regurgitant volume divided by the total forward volume across the mitral valve.
Interrogating the mitral valve medial and lateral annuli with tissue Doppler echocardiography can help detect occult systolic and diastolic myocardial dysfunction. Clinically important mitral valve disease affects the left atrial size, pulmonary venous Doppler pattern, and right ventricular pressure. The pulmonary venous Doppler pattern can help estimate mitral regurgitation. Diastolic velocity decreases as the severity of mitral regurgitation increases, and flow in the pulmonary veins reverses in systole when regurgitation is severe. In addition to myocarditis, acute valvar insufficiency can also lead to myocardial dysfunction from RF. The presence of pericardial effusion should also be assessed.
The goals of imaging in acute rheumatic mitral valve disease are summarized in Table 25.2.
In the chronic phase of rheumatic mitral valve disease, chronic fibrosis and scarring reverse the changes that occurred in the acute phase (Table 25.3). The chordae begin to shorten and the mitral valve annulus becomes tighter. Ideally, this process will stop when the valve is close to normal in structure and function. Clinically, the patient becomes asymptomatic, and there may be no signs of disease on auscultation. More often, the fibrosis continues to progress, and the mitral valve becomes stenotic. The chordae become thick and shorten, and the valve annulus becomes smaller. The valve leaflets thicken and their mobility is reduced. The valve commissures may fuse, further limiting leaflet mobility and markedly decreasing the size of the effective mitral orifice. With these changes, the shape of the mitral valve changes from a saddle-like (normal) to a funnel-like “fish-mouth” configuration (Fig. 25.2, Videos. 25.5–25.7).
About half the patients with marked rheumatic mitral stenosis continue to have substantial mitral regurgitation as a result of the restrictive movement and persistent coaptation gap between the valve leaflets. In adults, scarred mitral valves may become calcified. The anatomy and mobility of the mitral valve can be assessed with two-dimensional echocardiography. The valve orifice can be traced by planimetry in a parasternal short-axis view to show the mitral valve en face. Three-dimensional echocardiography can be useful in understanding the structural deformity of the mitral valve. The anterior leaflet of the mitral valve can assume a characteristic “hockey-stick” appearance when its mobility is somewhat preserved but the commissures are fused, creating a “doming” of the mitral valve.
In contrast to other chronic inflammatory diseases, such as rheumatoid arthritis or systemic lupus erythematosus, the entire valve is diffusely involved in rheumatic endocarditis. Calcification of the valve in chronic rheumatic disease starts from the edges of the leaflets and progresses toward the annulus. As the stenosis progresses, left atrial pressure continues to rise. Left atrial hypertension can be evident by increased left atrial size and an abnormal pulmonary venous Doppler pattern. Progressive left atrial dilation increases the risk of atrial arrhythmias and intracardiac thrombi, which must be sought during an echocardiographic study. In pure mitral stenosis, the size of the left ventricle can be normal. However, because many patients have both mitral stenosis and regurgitation, the left ventricle may still be dilated. To confirm this dilation, the ventricular dimensions and function should be assessed.
The goals of imaging in chronic rheumatic mitral valve disease are summarized in Table 25.3.
Rheumatic Aortic Valve Disease
The aortic valve is involved in about 25% of the cases of rheumatic carditis, but it is rarely involved in the absence of mitral valve disease. In the acute phase, just as in rheumatic mitral valve disease, the predominant finding is regurgitation. The aortic valve cusps should be assessed carefully to detect any prolapse. In diastole, the regurgitant jet from the aortic valve can reach the anterior mitral leaflet, making it flutter, an effect that can be seen by two-dimensional and M-mode echocardiography. Severely elevated left ventricular diastolic pressure may close the mitral valve prematurely.
The left ventricle is typically dilated and its function may be impaired. Severe acute regurgitation of the aortic valve imposes a great volume load on the left ventricle and can hinder its function. Increased left atrial volume in the absence of mitral valve disease can be the result of increased left ventricular diastolic pressure. Color Doppler echocardiographic interrogation of the aortic valve is key to diagnosing mild regurgitation (Fig. 25.3, Video 25.8). The origin, size, and direction of the regurgitant jet must be assessed by multiple views. Pressure half-time and the proximal isovelocity surface area can estimate this regurgitation more accurately. Marked reversal in diastolic flow in the descending and abdominal aorta, as apparent on Doppler interrogation, correlates with marked aortic valve regurgitation.
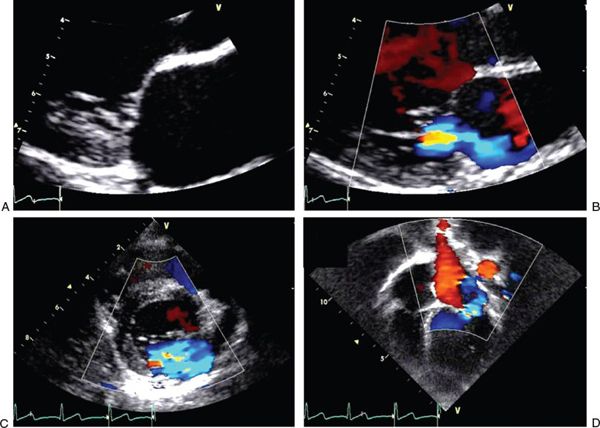
FIGURE 25.1. Images of acute rheumatic mitral valve disease. A: Parasternal long-axis view in systole with zoomed image showing mild prolapse of the anterior mitral leaflet. B: Parasternal long-axis view in systole with zoomed image showing mitral regurgitation with a posteriorly directed jet caused by a prolapsing anterior leaflet. C: Parasternal short-axis view in systole with an en face perspective of the mitral valve showing mitral regurgitation. D: Apical four-chamber view in systole showing eccentric mitral regurgitation jet.
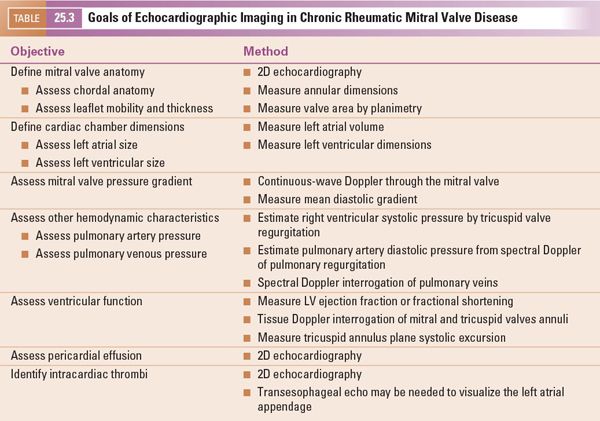
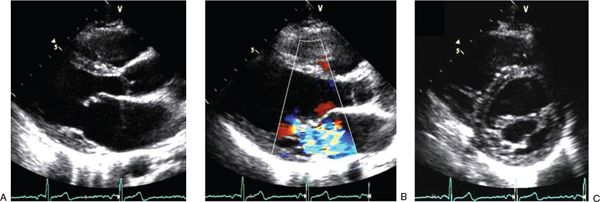
FIGURE 25.2. Images of chronic rheumatic mitral valve disease. A: Parasternal long-axis view in systole showing the typical “hockey-stick” appearance of the anterior mitral leaflet caused by restricted mobility of the leaflet edge. B: Parasternal long-axis view in systole showing marked mitral regurgitation. C: Parasternal short-axis view in diastole with an en face perspective of the mitral valve showing restricted opening of the leaflets with a greatly reduced effective orifice.
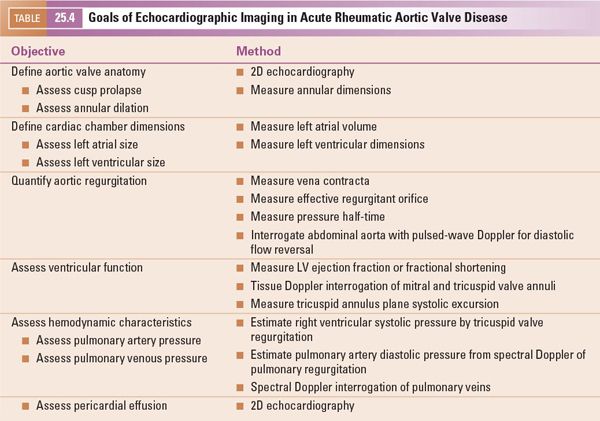
The goals of imaging in acute rheumatic aortic valve disease are summarized in Table 25.4.
In chronic rheumatic aortic valve disease, fibrosis of the valve cusps leads to progressive stenosis. In addition, the fibrosis also causes the valve cusps to shorten and retract, leading to concomitant regurgitation. The commissures may fuse, limiting the excursion of cusps and resulting in a small effective orifice (Fig. 25.4, Videos 25.9–25.12). Planimetry by two-dimensional and three-dimensional echocardiography can determine the effective valve area. The effective valve area can also be determined by the continuity equation using the left ventricular outflow tract and the aortic valve TVI. Doppler interrogation provides critical hemodynamic information. Mean and maximum pressure gradients can be calculated by continuous-wave Doppler interrogation across the aortic valve. The severity of aortic stenosis can be underestimated when ventricular function is impaired. The TVI ratios of the left ventricular outflow tract and the aortic valve can help reveal this underestimated severity from decreased ventricular function.
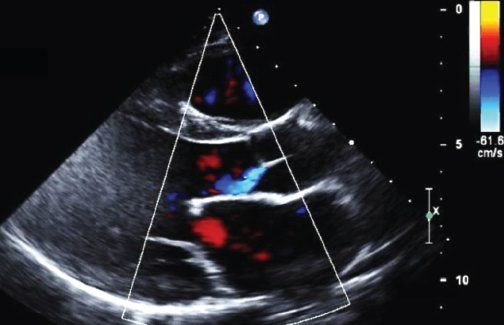
FIGURE 25.3. Image of acute rheumatic aortic valve disease. Parasternal long-axis view in diastole showing mild aortic regurgitation.
The goals of imaging in chronic rheumatic aortic valve disease are summarized in Table 25.5.
KAWASAKI DISEASE
Kawasaki disease (KD) is an acute vasculitis syndrome of childhood that affects the coronary arteries. Its cause is unknown. It is more prevalent in Americans of Asian and Pacific Island descent, in which the incidence is about 30 per 100,000 children up to age 5 years. About 80% of affected children receiving medical care are under 5 years of age, and their median age is 2 years.
The diagnosis is based on clinical criteria (Table 25.6). Characteristic signs include fever for 5 days, cracked lips, bilateral conjunctivitis, “strawberry tongue” (glossitis), cervical lymphadenopathy, and desquamation of the hands and feet. Other clinical features include sterile pyuria, anterior uveitis, perianal erythema, edema and erythema of the hands and feet, gallbladder hydrops, hepatitis, and irritability. The disease is characterized by inflammation of the mid-sized arteries throughout the body, which results in various clinical features. However, the long-term sequelae stem from the involvement of the coronary arteries. Young infants and children older than 8 years have the highest rate of coronary artery involvement.
Cardiovascular pathology in KD progresses in four stages. In the first, acute phase, which occurs at about the first 10 days of illness, there is diffuse microvascular angiitis with endarteritis and perivasculitis of the major coronary arteries. These conditions can result in pericarditis, valvulitis, and endocarditis. More often, myocarditis is seen at this stage, which may involve the intracardiac conduction system. Stage 2, the subacute phase, lasts until the third or fourth week of illness and is characterized by a panvasculitis of the major coronary arteries, which results in aneurysm and thrombus formation. Myocarditis, endocarditis, and pericarditis can still be present in this stage. Stage 3 is also subacute and lasts from the fourth to the fifth week of illness. In this stage, microvascular angiitis resolves and the coronary arteries granulate, which causes intimal thickening. The fourth and late phase lasts 40 days to 4 years and is characterized by fibrosis and scarring of the coronary arteries and myocardium. Thrombosed vessels recanalize during this stage.
Goals of Imaging
Imaging is not a component of the diagnostic criteria for KD. The role of imaging in KD is primarily prognostic. However, according to the 2011 American Academy of Pediatrics statement for KD, it can also help in establishing the diagnosis in cases of incomplete KD, where all the required diagnostic criteria are not met. In this situation, a positive echocardiogram establishes the diagnosis.
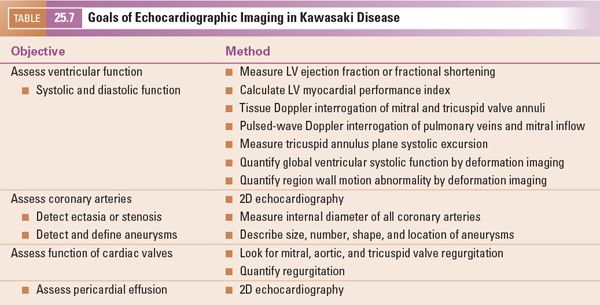
The goals of imaging in Kawasaki disease are summarized in Table 25.7.
Given the pathophysiology of KD, the American Heart Association recommends that every child in whom KD is diagnosed be evaluated by echocardiography at the time of diagnosis, 2 weeks after diagnosis, and again 6 to 8 weeks after diagnosis. Furthermore, children with coronary artery disease should be assessed annually. For long-term follow-up, the American Heart Association recommendations include invasive and noninvasive assessment of ventricular function, coronary abnormalities, and perfusion studies based on the risk levels defined below.
■Risk level I. No coronary artery abnormality: no diagnostic imaging.
■Risk level II. Transient coronary artery ectasia resolving in 6 to 8 weeks: no diagnostic imaging.
■Risk level III. One small-to-medium-size coronary artery aneurysm: a yearly echocardiogram and electrocardiogram and a biennial stress test or perfusion imaging study. Angiography is indicated only if noninvasive imaging suggests ischemia.
■Risk level IV: One or more large or giant coronary artery aneurysms without obstruction: semi-annual echocardiograms and electrocardiograms and an annual stress test or perfusion imaging study. Angiography is recommended 6 to 12 months after diagnosis or sooner if clinically indicated. Repeat angiography is recommended if noninvasive tests suggest ischemia.
■Risk level V. Coronary artery obstruction: semiannual echocardiograms and electrocardiograms, an annual stress test or perfusion imaging study, and angiography to address therapeutic options.
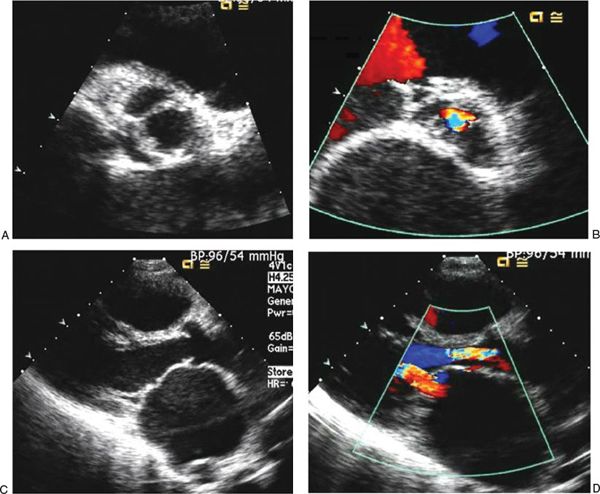
FIGURE 25.4. Images of chronic rheumatic aortic valve disease. A: Parasternal short-axis view in systole with an en face perspective of the aortic valve showing the restricted opening of the leaflets with a greatly reduced effective orifice. B: Parasternal short-axis view of the aortic valve in diastole showing the central regurgitation jet. C: Parasternal long-axis view in systole showing the dome of the aortic valve leaflets created by restricted mobility. The left atrium is severely dilated as a result of concomitant severe mitral stenosis. D: Parasternal long-axis view in systole showing a wide regurgitant jet across the aortic valve, indicating substantial regurgitation. The effective orifice of the mitral valve is extremely reduced as a result of coexisting mitral stenosis. The left atrium is enlarged, and the anterior mitral leaflet has the “hockey-stick” appearance.
During the acute phase, the initial echocardiogram usually shows only a few subtle findings with respect to coronary artery disease. Increased perivascular brightness and mild coronary ectasia may indicate vasculitis. More important findings during the acute phase are the presence of pericardial effusion secondary to pericarditis, reduced ventricular function secondary to myocarditis, and new valvar (most likely mitral) regurgitation secondary to valvulitis.
Baseline ventricular function should be measured with several methods so that follow-up imaging can detect even small changes. Assessing regional wall motion abnormalities with deformation imaging may be useful. In the subacute and late phases, the goals of imaging are primarily to detect coronary abnormalities or reduced ventricular function with regional wall motion abnormalities. The proximal portion of the coronary arteries can be visualized easily in most patients. However, assessing coronary arteries in patients with KD is not limited to the proximal coronary arteries; the distal coronary arteries must also be interrogated with specific views, as explained in the next section.
The internal diameter of the coronary arteries should be compared to normative data. In normal individuals, the internal diameter of the coronary arteries should be less than 3 mm in children less than 5 years old, and less than 4 mm in children older than 5 years. Diffuse dilation of a coronary artery more than these limits, without aneurysm, is “coronary ectasia” (Fig. 25.5). Segmental dilation or narrowing along the length of a vessel is important. An internal diameter of a segment that measures 1.5 times that of the adjacent segment is considered to be abnormal.

Coronary aneurysms should be described by their number, shape, size, and location. The shape of the aneurysms can be described as either fusiform or saccular (Fig. 25.6).Multiple aneurysms in a coronary artery can give a “beads-on-string” appearance. The aneurysms can be classified as small (<5 mm in internal diameter), medium (5 to 8 mm in internal diameter), or giant (>8 mm in internal diameter).
Children with a diagnosis of KD but without coronary abnormalities (risk level I) are still considered high-risk for early onset of adult coronary artery disease. The 2011 National Heart, Lung, and Blood Institute Guidelines categorize children with KD as high-risk for early coronary artery disease and recommend lower cut-off values for body mass index, blood pressure, and lipid levels to trigger early interventions.

Imaging Coronary Arteries by Echocardiography
Echocardiographic assessment of coronary arteries is important in diagnosing and following patients with KD. The highest quality coronary artery images should be obtained. A high-frequency transducer should be used with the highest feasible frequency. In general, slightly reducing the two-dimensional gain and compression (dynamic range) will improve visualizing the coronary arteries. In most pediatric echocardiograms, imaging the origin and proximal portions of the coronary arteries is adequate. However, in children with KD, every effort should be made to visualize the length of each of the three major coronary arteries.
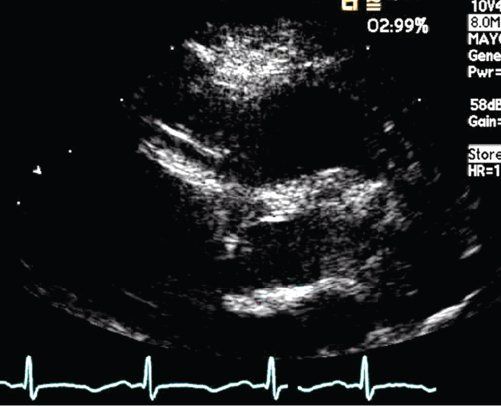
FIGURE 25.5. Kawasaki disease. Ectasia of the right coronary artery segment.
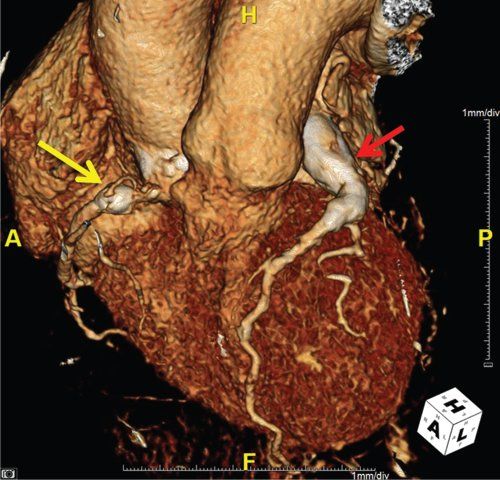
FIGURE 25.6. Kawasaki disease. Yellow arrow: saccular aneurysm of the right coronary artery. Red arrow: giant, fusiform aneurysm of the left coronary artery.
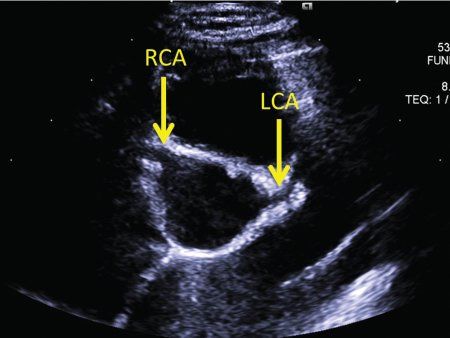
FIGURE 25.7. Kawasaki disease. The parasternal short-axis view is optimal to start imaging the coronary arteries. RCA, origin of the right coronary artery; LCA, origin of the left coronary artery.
The proximal left coronary artery is best visualized in the parasternal short-axis view. The bifurcation of the left coronary artery into the left anterior descending and circumflex arteries is best visualized by rotating the transducer clockwise to the 3 o’clock position (Fig. 25.7, Video 25.13). Tilting the transducer toward the left shoulder can better show the length of the left anterior descending coronary artery (Fig. 25.8, Video 25.14). Pointing the transducer downward will show the circumflex coronary artery better (Fig. 25.9). A high, left parasternal window can sometimes be useful in imaging the left coronary artery (Fig. 25.10, Video 25.15). The distal left anterior descending coronary artery can be better seen in the parasternal long-axis view by angling the transducer toward the left shoulder to visualize the anterior interventricular groove. A similar view of the distal left anterior descending coronary artery can be obtained through a subcostal window in the coronal plane. To visualize the length of the left circumflex coronary artery, anterior angulation in the apical view can be helpful.
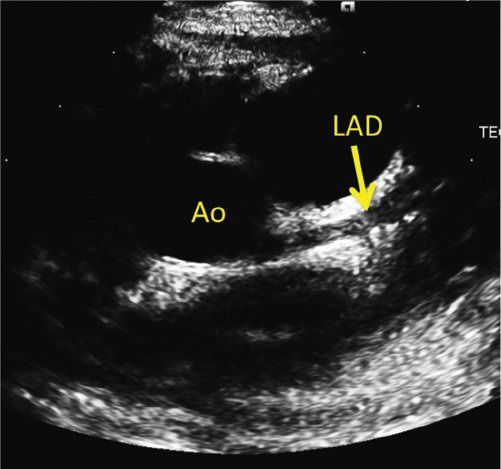
FIGURE 25.8. Kawasaki disease. Counterclockwise rotation of the transducer with tilting toward the left shoulder shows the length of left anterior descending coronary artery (LAD) in the anterior interventricular groove. The LAD is ectatic with a distal fusiform aneurysm. Ao, aorta.
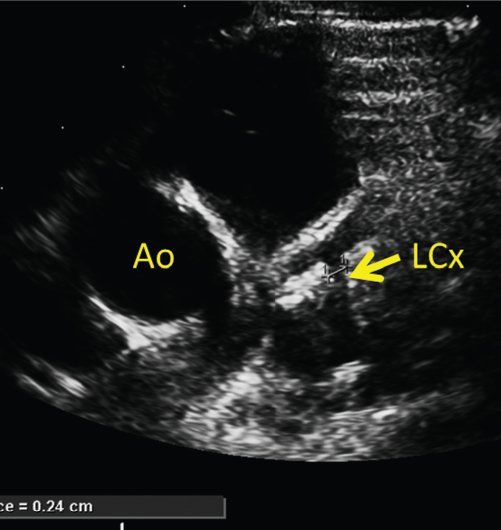
FIGURE 25.9. Kawasaki disease. Clockwise rotation of the transducer with downward tilting shows the left circumflex coronary artery (LCx). Ao, aorta.
The parasternal short-axis view is also optimal to image the right coronary artery (Fig. 25.7
Stay updated, free articles. Join our Telegram channel

Full access? Get Clinical Tree


