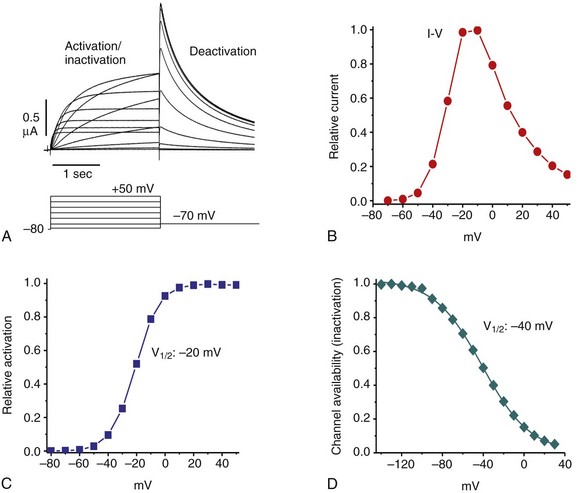
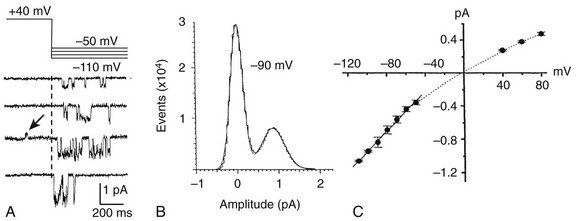
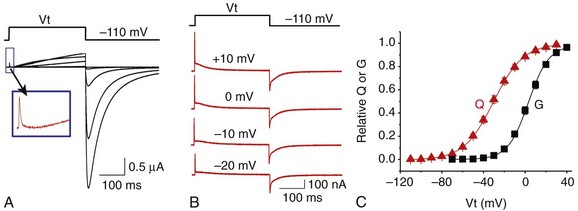
12 In the mammalian heart, hERG1 K+ channels are largely responsible for terminal repolarization of action potentials, and congenital mutations of this channel are a major cause of long QT syndrome, a life-threatening cardiac arrhythmia. The discovery of the HERG1 (KCNH2) gene began with genetic and neurophysiologic studies of mutant flies. The eag (ether-a-go-go) locus of a mutant strain of the Mediterranean fruit fly (Drosophila melanogaster) was associated with repetitive firing of motor neurons, an ether-induced leg-shaking phenotype, and altered K+ currents.1 Subsequent cloning and heterologous expression of eag revealed that the fly gene encoded the first member of a novel class of voltage-gated K+ channels. A low stringency screen and degenerate polymerase chain reaction was later used to identify additional channel genes, including erg (eag-related gene) and elk (eag-like).2 The HERG1 gene (human ether-a-go-go–related gene) encodes the hERG1 (KV11.1) protein, an α-subunit that coassembles to form functional hERG1 K+ channels that conduct the rapid delayed rectifier K+ current (IKr) in the heart.3 Two highly related channels, hERG2 and hERG3, form K+ channels with similar biophysical properties, but these channels are primarily expressed in the central nervous system and not in the heart.4 In the human heart, loss of function mutations in HERG1 delay ventricular repolarization and cause type 2 long QT syndrome. Delayed ventricular repolarization increases the incidence of Torsades de pointes arrhythmia that can lead to syncope and sudden death. The majority of HERG1 mutations disrupt folding or trafficking of channels to the plasma membrane.5 Inherited mutations that alter channel gating are very rare. Examples include a point mutation (G638S) that disrupts the structure of the highly conserved potassium selectivity filter and prevents K+ ion conductance. A few congenital mutations in HERG1 (N588K, T618I) induce a gain in channel function and cause short QT syndrome6,7; these two mutations shift the voltage dependence of channel inactivation to more positive potentials, greatly increase outward IKr, and thereby shorten the duration of ventricular action potentials. The kinetics and voltage dependence of hERG1 currents are commonly studied in heterologous expression systems, such as mammalian cells transfected with cDNA or Xenopus oocytes injected with cRNA. Currents are usually activated by pulsing to test potentials from a negative holding potential. In the example shown in Figure 12-1, A, an oocyte expressing hERG1 channels was voltage-clamped to a holding potential of −80 mV and two-second test pulses were applied in 10-mV increments to voltages between −70 and +50 mV. Channels were activated at potentials greater than −60 mV, and the resulting whole-cell currents activated slowly throughout the two-second test pulses in response to test potentials from −50 to −10 mV. Activation of hERG1 occurs with a time constant of approximately 150 ms at +10 mV.8 At test potentials of 0 mV and greater, outward currents progressively activate faster and reach a smaller peak magnitude. These currents are typically analyzed by plotting the peak outward current as a function of test potential. The resulting bell-shaped current-voltage (I-V) relationship (see Figure 12-1, B) is the hallmark characteristic of IKr measured in the native cardiomyocytes of all species. The decrease in current magnitude associated with more depolarized test potentials is caused by progressive channel inactivation. Figure 12-1 Biophysical properties of hERG1 channel currents. A, Whole-cell currents (top panel) elicited in response to step changes in membrane voltage as indicated (bottom panel). Currents were measured in Xenopus oocytes heterologously expressing hERG1 channels. B, Normalized I-V relationship for peak activating currents shown in A. C, Voltage dependence of hERG1 channel activation based on plot of normalized peak tail currents illustrated in A. D, Voltage dependence of hERG1 channel inactivation. After each test pulse, the cell was clamped to −70 mV to elicit channel deactivation, observed as a slowly decaying outward “tail” current (see Figure 12-1, A). A plot of the peak amplitude of tail currents as a function of test potential (see Figure 12-1, C) defines the voltage dependence of current activation. The relationship is fitted with a Boltzmann function to determine the half-point (V0.5, in this case −20 mV) for activation. The magnitude of outward tail current measured at −70 mV is larger than the outward current elicited by its preceding test pulse (see Figure 12-1, A) despite the fact that the electrical driving force for outward flux of K+ is smaller at −70 mV than it is for the more depolarized test pulses. This paradox can be explained by the kinetics of channel inactivation versus deactivation. Immediately after the cell is repolarized to −70 mV, channels first rapidly recover from inactivation (i.e., reopen) before they slowly close (deactivate). The time constant for recovery from inactivation at −70 mV is approximately 10 ms (at room temperature), approximately 30 to 100 times faster than deactivation at this potential. Most importantly, because channels are far less inactivated at −70 mV compared with more depolarized test potentials, tail currents are actually larger than test currents despite the considerably smaller electrical driving force. Two different voltage clamp protocols (two-step or three-step) have been used to characterize the rate of onset and voltage dependence of hERG1 inactivation. The two-step protocol includes a prepulse to +40 mV, followed by a test pulse applied to a variable potential.3 During the prepulse, channels reach a “fully-activated” condition (most channels are inactivated and only a minority remain open). The second (test) pulse is applied to a voltage that is varied between −140 and +30 mV. The peak initial current measured for test pulse is divided by the product of the maximum slope conductance and the driving force for K+ (test potential − reversal potential), is normalized to a maximum value of 1, and is plotted as a function of test voltage, Vt. The resulting relationship is shown in Figure 12-1, D, and represents the voltage dependence of channel availability that varies from 1.0 (no inactivation) to nearly 0 (all channels inactivated). The second method to measure the voltage dependence of hERG1 inactivation uses a three-step voltage clamp protocol in which channels are first activated/inactivated by a prepulse to a positive potential (e.g., +40 mV). The prepulse is followed by a short (e.g., 10 ms) interpulse to a variable potential to allow channels to recover from inactivation but not appreciably deactivate. Finally, a third pulse is applied to a fixed positive potential to measure the relative proportion of channels that were in the open state at the end of the second pulse.9,10 The half-point for inactivation of hERG1 estimated with this protocol is approximately −90 mV. The time course of hERG1 inactivation can be determined by modification of the triple-pulse protocol. Here, the interpulse voltage is kept constant and the voltage of the final pulse is varied and used to observe the onset of current inactivation. Using this method, the time constants for inactivation vary between 16 ms at −20 mV and 2 ms at +50 mV.3,10 Ionic currents conducted by hERG1 channels can also be studied by recording single-channel currents, usually in the presence of high [K+]e (e.g., 120 mM) to increase the signal-to-noise ratio. In cell-attached patches, single hERG1 channel activity is mostly absent at positive voltages (e.g., +40 mV in Figure 12-2, A) because the probability of channel inactivation is very high. Upon repolarization to a negative potential, the channel reopens after a variable delay (the period between the dotted line and initial channel openings shown in Figure 12-2, A). The delay reflects the time required for the channel to recover from inactivation and is shorter at more negative potentials. Once opened, channels briefly close and reopen repetitively until they finally enter a stable closed state. Analysis of these brief open and closed times indicates that single channels have at least two open and two closed states. At −90 mV, the mean open times are approximately 3 and 12 ms, and the mean closed times are approximately 0.5 and 15 ms.11 The single-channel current amplitude (i) at each return potential is estimated by fitting data to a Gaussian distribution of an all-points histogram of digitized current (see Figure 12-2, B). The resulting single-channel current-voltage relationship (i-V) is then used to calculate slope conductance, which varies as a function of voltage (see Figure 12-2, C). The single-channel conductance of hERG1 is approximately 12 pS when measured at negative potentials and decreases to 5 pS at positive potentials when measured in the presence of high [K+]e.11 Figure 12-2 Single hERG1 channel currents. A, Currents recorded from a cell-attached patch of a Xenopus oocyte overexpressing hERG1 channels. The arrow points to a short opening of the channel at +40 mV. The dotted line indicates onset on repolarization to the test potential indicated in the upper panel. B, All-events histogram used to determine single hERG1-channel current amplitude (I, ~0.9 pA) at −90 mV. C, Average i-V relationship for hERG1 channels for cell-attached patches ([K+]e = 120 mM). Solid line indicates a slope conductance of 12 pS. (Adapted from Zou A, Curran ME, Keating MT, et al: Single HERG delayed rectifier K+ channels in Xenopus oocytes. Am J Physiol 272:H1309–H1314, 1997.) Unique insights into the mechanisms of hERG1 channel gating have been facilitated by measurement of gating currents. As opposed to ionic currents, which result from movement of ions through the channel pore from one side of the membrane to the other, gating currents represent the intramembrane displacement of charged residues in the voltage sensors of the channel protein. The unusual kinetics of hERG ionic current, with its slow activation and rapid inactivation, imply that the underlying movement of the voltage sensor is different from most voltage-gated K (Kv) channels, in which activation is fast and inactivation is relatively slow. Gating currents can be observed as very small outward currents that occur immediately after membrane depolarization and before the relatively slow onset of ionic currents (Figure 12-3, A). Voltage clamp fluorimetry12 and direct measurement of gating currents13 of hERG reveal two distinct components of charge displacement (see Figure 12-3, B). The slow component is approximately 100-fold slower than Kv1 channel gating currents, carries approximately 90% of the gating charge, and is associated with the slow rate of hERG activation. The fast-gating component likely represents rapid transitions between channel states during the early steps of the activation pathway. The majority of the gating current represents intramembrane displacement of the highly-charged S4 domain. Intramembrane charge displacement invoked by membrane depolarization is estimated by integration of either the ON or OFF gating current elicited by depolarization or repolarization, respectively. In the example illustrated in Figure 12-3, B, after a pulse to a variable Vt, OFF gating currents are elicited by repolarization to −110 mV. The integral of the OFF gating current is the charge (Q), and when plotted as a function of Vt defines the Q-V relationship that occurs over a more negative voltage range than ionic currents defined by the conductance-voltage (G-V) relationship (see Figure 12-3, C). In simple terms, this means that voltage sensor movement occurs at more negative potentials than that required for channel opening or closing. Figure 12-3 hERG1 channel gating currents. A, Outward hERG ionic currents recorded from Xenopus oocytes, elicited by depolarizing pulses from −50 to +30 mV (in 20-mV increments); inward tail currents were measured after repolarization to −110 mV. Boxed area represents fast component of gating current that precedes onset of outward ionic currents. B, Gating currents (red traces) in response to membrane depolarization to the indicated test potential (Vt) and upon return to −110 mV. Gating currents were measured using the cut-open oocyte voltage clamp method in the absence of ionic currents. C, Plot of normalized charge (Q) and conductance (G) as a function of Vt for hERG1 channels. KCNE2 encodes a 123 amino acid protein (MiRP1) with a single transmembrane domain that can serve as ancillary β-subunit for hERG1 to modulate channel expression and may14 or may not15 alter hERG1 gating kinetics and response to certain drugs. Like many Kv channels, hERG1 channels are also modulated by phosphatidylinositol-4,5-biphosphate (PIP2). This phosphoinositide increases current magnitude and slows deactivation.16 with the probability of states, P, and the matrix of transition rates, Q. Each matrix element Qij specifies the transition rate from the i-th to the j-th state. The major task of model development is the definition of these states and parameterization of transition rates. Typical states of the hERG1 channels models are the closed (C), open (O), and inactivated states (I). Transitions are commonly described with voltage-dependent or constant rate coefficients. Markov models of hERG1 channels originate from descriptions of voltage-gated K+ channels, in particular, the Markov models of IKr of ferret atrial myocytes17 and rabbit ventricular myocytes.18 Studies by Wang et al8 and Kiehn et al19 aimed at reconstruction of ion currents through hERG1 channels with hidden Markov models. In these studies, voltage-clamp protocols were applied to characterize hERG1 channels expressed in Xenopus
Structural Determinants and Biophysical Properties of hERG1 Channel Gating
Background
Biophysical Properties of hERG1 Channels


Markov Models of hERG1 Gating
![]()
Stay updated, free articles. Join our Telegram channel

Full access? Get Clinical Tree


Thoracic Key
Fastest Thoracic Insight Engine

