Stress Testing During Cardiac Catheterization: Exercise, Pacing, and Dobutamine Challenge
William Grossman
Mauro Moscucci
Some material in this chapter was developed for previous editions by Drs. Beverly Lorell, Mark Feldman, and Raymond McKay.
Patients with significant heart disease may have entirely normal hemodynamics when assessed in the resting state during cardiac catheterization. Because most cardiac symptoms are precipitated by exertion or some other stress, however, it may also be important to assess hemodynamic performance during some form of stress such as muscular exercise, pharmacologic intervention (e.g., dobutamine infusion), or pacing-induced tachycardia. Such an evaluation enables the physician to assess the cardiovascular reserve and the relationship (if any) between specific symptoms and hemodynamic impairment. Physiologic information so obtained is often valuable in prescribing specific medical therapy, selecting patients for corrective cardiac surgery, and estimating prognosis.
Muscular exercise, both dynamic and isometric, has been studied extensively in the cardiac catheterization laboratory, and the normal hemodynamic responses are reasonably well understood. There are major differences between the hemodynamic responses to dynamic exercise (done either in the supine or in the erect position) and to static, isometric exercise, and these two types of exercise are discussed separately.
DYNAMIC EXERCISE
During dynamic exertion, skeletal muscles are actively contracting and developing force that is translated into motion and work. This is accompanied by an increase in both oxygen (O2) consumption and carbon dioxide production by skeletal muscle, and a corresponding increase in alveolar gas exchange needed to support the higher metabolic rate.
In normal sedentary individuals, the level of O2 consumption during maximal exercise ( max ) can increase about 12-fold in comparison with that during the resting state.1 Age and fitness also modify
  max. With aging, there is a decrease in
  max of about 5% per decade.
  max increases because of both cardiovascular and skeletal muscle adaptation. In marathon runners and Olympic-class athletes,
  max may represent an 18-fold increase in O2 consumption above that of the resting state. The increased oxygen requirements of muscular exercise are met by both an increase in the cardiac output and an increased extraction of oxygen from arterial blood by skeletal muscle, which causes widening of the arteriovenous oxygen difference (AV O2 difference).
In normal sedentary individuals, the level of O2 consumption during maximal exercise (
max ) can increase about 12-fold in comparison with that during the resting state.1 Age and fitness also modify max. With aging, there is a decrease in max of about 5% per decade. max increases because of both cardiovascular and skeletal muscle adaptation. In marathon runners and Olympic-class athletes, max may represent an 18-fold increase in O2 consumption above that of the resting state. The increased oxygen requirements of muscular exercise are met by both an increase in the cardiac output and an increased extraction of oxygen from arterial blood by skeletal muscle, which causes widening of the arteriovenous oxygen difference (AV O2 difference).The need for the heart to increase cardiac output appropriately for the increase in O2 consumption resulting from exercise is met by an increase in heart rate and an increase in stroke volume. The relative contributions of these increases to the rise in cardiac output depend on the type of exercise (supine versus upright), the intensity of exercise, the limitation of diastolic filling at high heart rates, and the response to sympathetic stimulation. Metabolic adaptations of exercising muscle include a switch from use of free fatty acids at rest to an accelerated breakdown of muscle glycogen stores and enhanced uptake of bloodborne glucose, which is supplied by increased hepatic gluconeogenesis. Because carbohydrate metabolism produces more carbon dioxide than fat metabolism does, the respiratory quotient (ratio of carbon dioxide production to O2 consumption) rises from a resting value of 0.7 to 0.8 toward 1.0. The delivery of bloodborne oxygen and glucose to working skeletal muscle is enhanced in the presence of normal vasculature by a reduction in skeletal muscle vascular resistance mediated by metabolic byproducts and by sympathetically mediated vasoconstriction elsewhere, which causes a redistribution of blood away from the renal and splanchnic beds to the exercising muscle.
Exercise depends on the adequacy of pulmonary function to increase oxygen supply. During progressive exercise, there is a linear increase in minute ventilation relative to the increase in O2 consumption. When the intensity and duration of exercise are such that oxygen delivered to the exercising muscle is insufficient, anaerobic metabolism of glucose develops, causing metabolic acidosis and an increase in respiratory quotient to values >1.0; minute ventilation increases out of proportion to O2 consumption. Beyond this anaerobic threshold, the accumulation of hydrogen ions usually causes skeletal muscle weakness, pain, and severe breathlessness, followed by exhaustion and cessation of exercise. It is best to conduct exercise studies in the catheterization laboratory in such a way that the patient reaches a steady state level of submaximal exercise below the anaerobic threshold and exercise can be sustained for several minutes. This approach permits estimation of cardiovascular reserve and allows the physician to determine whether the increase in cardiac output is appropriate for the increase in O2 consumption occurring at that particular level of exercise.
Oxygen Uptake and Cardiac Output
There is a linear relationship between O2 consumption and increasing workload (Figure 20.1). Oxygen uptake increases abruptly after initiation of dynamic exercise, reflecting the additional work needed to overcome inertia of the legs, and then increases steadily over a few minutes to reach a new steady state that is directly related to the intensity or level of exercise.2, 3, 4 Simultaneously, the mixed venous blood oxygen saturation decreases to a lower steady level related to the intensity of exercise, producing an increase in the AV O2 difference.
The cardiac output increases linearly with increasing workload during both supine and upright exercise in normal subjects.2, 3, 4, 5 As can be seen from the regression equation for this relationship (Figure 20.2), for each increment of 100 mL/minute per m2 of O2 consumption during exercise, there is an increase in cardiac output of 590 mL/minute per m2.
Exercise Index
The linear relationship between oxygen uptake and cardiac output during exercise, illustrated in Figure 20.2, may be used to assess whether the cardiac output response measured in an individual patient is appropriate to the level of exercise and increased oxygen uptake. The regression formula is CI = 0.0059X + 2.99, where CI is the cardiac index in liters per minute per square meter of body surface area (BSA) and X is the O2 consumption in mL/minute per m2 BSA. This formula may be used to calculate the predicted cardiac index for a given level of O2 consumption (X), and the predicted cardiac index may then be compared with
the measured cardiac index. Note that this assessment can be performed at any steady state level of exercise and does not depend on achieving any specific target level of exertion. This equation can be used to calculate a predicted cardiac index by measuring O2 consumption during dynamic exercise. The patient’s actual measured cardiac index during exercise is then divided by the predicted cardiac index to determine the deviation from normal:
the measured cardiac index. Note that this assessment can be performed at any steady state level of exercise and does not depend on achieving any specific target level of exertion. This equation can be used to calculate a predicted cardiac index by measuring O2 consumption during dynamic exercise. The patient’s actual measured cardiac index during exercise is then divided by the predicted cardiac index to determine the deviation from normal:
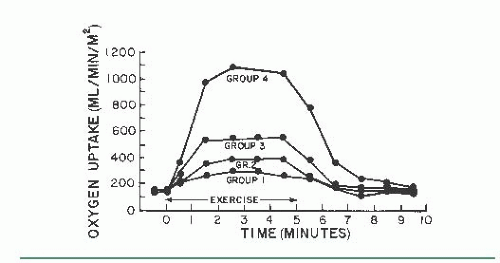 Figure 20.1 Oxygen consumption in normal subjects during exercise. Each group represents a different level of exercise, with the most intense exercise being performed by group 4. Note the prompt increase and establishment of a new steady state in oxygen uptake that is directly related to the intensity of the exercise. (From Donald KW, et al. The effect of exercise on the cardiac output and circulatory dynamics of normal subjects. Clin Sci 1955; 14:37, with permission.) |
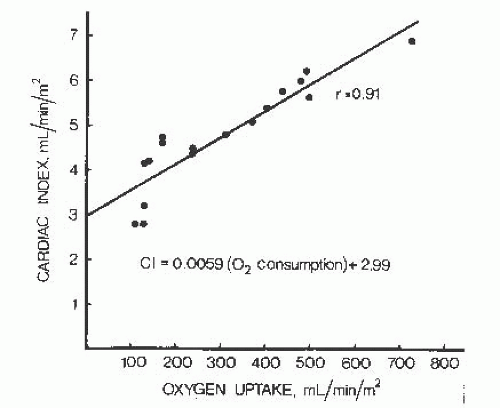 Figure 20.2 The relationship between cardiac output and oxygen consumption (both indexed for body surface area) during supine dynamic exercise of varying intensity in normal subjects, based on the data supplied by Dexter. As can be seen from the regression equation for this relationship, for each increment of 100 mL/minute per m2 of oxygen consumption, there is an increase in cardiac output of 0.59 L/minute per m2 or 590 mL/minute per m2. CI, cardiac index. (Data from Dexter L, et al. Effects of exercise on circulatory dynamics of normal individuals. J Appl Physiol 1951;3:439.) |

We have termed this ratio the exercise index, since it allows expression of exercise capacity as a percentage of the normal response. An exercise index of 0.8 or higher indicates a normal cardiac output response to exercise.
Exercise Factor
Another way of using this relationship between cardiac output and O2 consumption involves calculation of the exercise factor, which is the increase in cardiac output with exercise divided by the corresponding increase in O2 consumption:

A normal exercise factor represents an increase of 600 mL/minute in cardiac output per 100 mL/minute increase in O2 consumption. An exercise factor <6 indicates a sub normal response in cardiac output; like exercise index of <0.8, such a factor suggests some pathologic process limiting the heart’s ability to meet the exercise induced increase in O2 consumption with an appropriate increase in cardiac output, forcing an excessive reliance on oxygen extraction from arterial blood and widening of the AVO2 difference.
Systemic and Pulmonary Arterial
Pressure and Heart Rate Systolic arterial pressure and mean arterial pressure also increase linearly in relation to O2 consumption during dynamic exercise in normal subjects, although the response is somewhat variable4,6, 7, 8. Despite this increase in arterial pressure, systemic vascular resistance decreases substantially during dynamic exercise, indicating that the elevated arterial blood pressure is secondary to increased cardiac output. Patients who are unable to generate an adequate increase in cardiac output during dynamic exercise may also increase their arterial pressure, that in this circumstance systemic vascular resistance does not decline and may actually increase.
The behavior of the pulmonary circulation in response to dynamic exercise is different from that of the systemic circulation in normal individuals. Mean pulmonary artery pressure increases almost proportionally with cardiac output (pulmonary blood flow), so that there is only a slight decrease in pulmonary vascular resistance, in contrast to the normal substantial decrease in the resistance of the systemic vasculature.
Heart rate increases consistently during both supine and upright dynamic exercise and tends to increase linearly in relation to O2 consumption. During dynamic supine exercise in the catheterization laboratory, tachycardia is the predominant factor in increasing cardiac output. Tachycardia exerts a positive inotropic effect (the so-called treppe phenomenon, see below), but increased sympathetic nervous system activity appears to be the most significant factor leading to enhanced myocardial contractility. In most normal subjects, supine bicycle exercise is accompanied by an increase in ejection fraction and other ejection indices off left ventricular (LV) systolic function with a decrease in LV end-systolic volume.
Several investigators examining the responses of cardiac output, stroke volume, and heart rate to a given intensity of supine exercise in normal subjects and showed that the increase in cardiac output is caused primarily by an increase in heart rate with a negligible contribution by increased stroke volume. During repeat exercise when heart rate is held constant, there is a comparable increase in cardiac output caused by a marked increase in stroke volume7. When heart
rate is artificially increased by electrical pacing in the absence of dynamic exercise, however, cardiac output remains unchanged and a major fall in stroke volume occurs7, indicating that further cardiovascular adjustments are required for an adequate hemodynamic response to dynamic exercise.
rate is artificially increased by electrical pacing in the absence of dynamic exercise, however, cardiac output remains unchanged and a major fall in stroke volume occurs7, indicating that further cardiovascular adjustments are required for an adequate hemodynamic response to dynamic exercise.
Therefore, to adequately interpret the response to supine exercise in the catheterization laboratory, it is important to recognize that the increase in cardiac output in normal young subjects is caused by a proportionate increase in heart rate. As discussed later, when chronotropic reserve is depressed, an appropriate increase in cardiac output relative to O2 consumption depends on the capacity to augment LV diastolic filling and end-diastolic fiber tension, leading to an increase in stroke volume by means of the Frank-Starling mechanism.
Upright Versus Supine Exercise
The contributions of heart rate and stroke volume to cardiac output differ in supine and upright bicycle exercise. End-diastolic volumes at rest are near maximum when normal subjects are supine, smaller when they are sitting, and smallest when they are standing4. When subjects are in the upright position, LV end-diastolic volume, cardiac output, and stroke volume are lower than when they are in the supine position6,8. During erect bicycle exercise, most normal subjects demonstrate an increase in ejection fraction and reduction in end-systolic volume, some enhancement of left ventricular end-diastolic volume, and an increase in stroke volume as well as heart rate. LV end-diastolic volume and stroke volume tend to increase up to about 50% of peak 02 consumption and then to plateau or actually decrease at high levels of exercise4. At high levels of exercise and fast heart rates, recruitment of the Frank-Starling mechanism may be blunted by the effects of tachycardia and limitation of diastolic filling owing to shortening of diastole. At high levels of upright exercise, the stroke volume is preserved by a progressive decrease in end-systolic volume and increase in ejection fraction in the presence of a constant or decreased LV end-diastolic volume4,5.
Caution must be used in interpreting the relative contributions of inotropic reserve and use of the Frank-Starling mechanism in patients studied during dynamic exercise in the catheterization laboratory. The effects of advancing age profoundly alter the exercise response. In healthy subjects, there appears to be no age related changes in resting cardiac output, ejection fraction, and systolic volume or end-diastolic volume9. With age, there is it reduction in both peak 02 consumption and cardiac output during exercise. Also, with advancing age there is a reduction in heart rate and contractility response during exercise, so that the increase in cardiac output at any level of exercise is accomplished by significant increases in end-diastolic volume and in stroke volume9, 10.
Therefore, as discussed earlier, studies of the effect of dynamic supine bicycle exercise in young adults have generally shown no changes or a fall in LV end-diastolic pressure (LVEDP) and volume during exercise. In contrast, studies of older normal subjects or patients with atypical chest pain and normal coronary arteries have generally shown that both dynamic supine and upright bicycle exercise are associated with an increase in LVEDP,10,11 which is consistent with an age-dependent reliance on an increase in preload during exercise. For example, in a group of 10 sedentary men whose average age was 46 years, there was a rise in LVEDP from 8 ± 1 to 16 ± 2 mmHg during supine bicycle exercise and a rise from 4 ± 1 to 11 ± 1 mmHg during upright bicycle exercise.8 The diminished heart rate and contractility responses during exercise and the resultant increased dependence on the Frank-Starling mechanism with aging may reflect an age-related decrease in responsiveness to β-adrenergic stimulation.12
There are also gender-related differences in the normal response to exercise. Normal men and women can achieve comparable increases in weight-adjusted peak O2 consumption, heart rate, and blood pressure. However, normal women generally achieve increases in stroke volume during upright exercise through an increase in end-diastolic volume without an increase in ejection fraction, whereas normal men exhibit a progressive increase in ejection fraction to peak exercise.13
The interpretation of normal versus abnormal LV systolic performance during dynamic exercise may also be complicated by the effects of chronic β-adrenergic blockade. Studies of the hemodynamic effects of chronic β-adrenergic blockade on graded exercise in hypertensive but otherwise healthy young adults have shown that no impairment of maximal exercise capacity (maximal O2 consumption) or cardiac output response occurs during chronic β-adrenergic blockade. β-Blockade, however, causes a reduction in heart rate at all levels of exercise, and this relative reduction in heart rate is compensated for by both a widening of the AV O2 difference and an increase in stroke volume, associated with an increased LV end-diastolic volume and a reduced arterial blood pressure (decreased impedance to ejection).
In normal β-blocked subjects, increases in cardiac output during exercise depend on increasing stroke volume by means of the Frank-Starling mechanism. Therefore, the dynamic exercise response of a patient receiving chronic β-adrenergic blocking therapy may be associated with an inappropriately low increase in cardiac output relative to O2 consumption, accompanied by excessive widening of the AV O2 difference with an increased reliance on an increase in LV end-diastolic volume. During dynamic supine exercise in the catheterization laboratory, the finding that an increase in cardiac output depends on an increase in LV end-diastolic volume (and pressure) could be owing to either β-adrenergic blockade per se or intrinsic impairment of LV systolic function. For these reasons, strong consideration should be given to discontinuation of β-adrenergic blocking drugs at least 24 hours before catheterization if analysis of the hemodynamic response to dynamic exercise is planned to assess the adequacy of cardiovascular reserve.
Left Ventricular Diastolic Function
Interpretation of the changes in LV diastolic pressure with exercise depends to a great extent on an appreciation of the adaptations in diastolic function that occur. In normal subjects, multiple adjustments occur to accommodate an increased transmitral flow into the left ventricle in the face of an abbreviated diastolic filling period and to maintain low pressures throughout diastole. Exercise is associated with a progressive acceleration of isovolumetric relaxation so that enhanced diastolic filling occurs with minimal change in mitral valve opening pressure.14 The exercise-induced enhancement of diastolic relaxation and filling is probably modulated by both β-adrenergic stimulation and increased heart rate.
In normal subjects, there is either no change or a downward shift in the LV diastolic pressure-volume relation during exercise (Figure 20.3). However, in the presence of ischemia or cardiac hypertrophy, and in patients with heart failure and preserved ejection fraction (HFpEF, see Chapter 43), exercise may provoke an upward shift in the LV diastolic pressure-volume relationship so that any level of LV end-diastolic volume is associated with a much higher LVEDP. In such patients, the left ventricle may be regarded as exhibiting increased chamber stiffness (decreased distensibility) during exercise. In patients with coronary artery disease, a transient but striking upward shift in the LV diastolic pressure-volume relation is common during episodes of ischemia.15 Patients with coronary artery disease who develop angina during dynamic exercise in the catheterization laboratory commonly show a marked rise in LVEDP. A careful study of the dynamics of LV diastolic filling during exercise in patients with coronary artery disease has been reported by Carroll et al.16 These authors studied LV diastolic pressure-volume relations in 34 patients with coronary disease who developed ischemia during exercise and compared the findings with those from 5 patients with minimal cardiovascular disease (control) and 5 patients with an akinetic area at rest from a prior infarction but no active ischemia during exercise (the scar group). There was an upward shift in the LV diastolic pressure-volume relationship during exercise-induced ischemia, which was not seen in either the scar or the control group (Figure 20.3). Therefore, interpretation of an exercise-induced rise in LVEDP in patients with coronary artery disease is complex and may be related to both a decrease in LV chamber distensibility and an increase in LV end-diastolic volume secondary to a reduction in ejection fraction.11,16
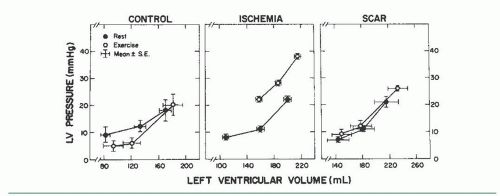 Figure 20.3 Left ventricular (LV) diastolic pressure-volume relations at rest and during exercise in patients without heart disease (control), as compared with patients with coronary disease who developed ischemia during exercise (ischemia), and patients with akinetic areas owing to previous infarction but no active ischemia during exercise (scar). Pressure and volume are averaged at three diastolic points: early diastolic pressure nadir, mid-diastole, and end-diastole. The control group had a downward shift of the early diastolic pressure-volume relation, but the ischemia group showed an upward and rightward shift. (From Carroll JD, Hess OM, Hirzel HO, et al. Dynamics of left ventricular filling at rest and during exercise. Circulation 1983;68:59, with permission.) |
The presence of cardiac hypertrophy is frequently characterized by depression of the rates of LV relaxation and diastolic filling at rest, and this depression profoundly impedes LV filling during exercise-induced tachycardia. In patients with conditions such as hypertrophic cardiomyopathy or hypertensive hypertrophic cardiomyopathy, in whom baseline LV end-systolic volumes are small, there is no reserve to further enhance systolic shortening, and abnormal diastolic properties limit the capacity to recruit the Frank-Starling mechanism during exercise. Furthermore, tachycardia may provoke ischemia (owing to impaired coronary vasodilator reserve), accompanied by an upward shift in the diastolic pressure-volume relationship. These findings with exercise-induced tachycardia in patients with coronary disease and/or advanced LV hypertrophy are remarkably similar to the changes in diastolic function seen during angina induced by pacing tachycardia, as described later in this chapter.
Marked abnormalities in LV diastolic function occur with exercise in patients with clinical evidence of heart failure but normal resting systolic function (the so-called diastolic heart failure, and recently reclassified as heart failure with preserved ejection fraction, or HFpEF). Kitzman and Sullivan17 studied seven patients with New York Heart Association (NYHA) class III or IV heart failure with one or more documented episodes of pulmonary edema and no significant coronary artery disease. All had LV ejection fractions of ≥50%, without echocardiographic evidence of regional wall motion abnormalities, or valvular or pericardial disease. Four of these patients were elderly with a medical history remarkable only for chronic hypertension. Most patients had increased LV wall thickness and mass. Patients were studied by symptom-limited upright exercise with simultaneous hemodynamic and radionuclide measurements, and the data were compared to those seen in age- and sex-matched healthy volunteers who served as controls. As can be seen in Figure 20.4, maximum exercise capacity was reduced, and the cardiac output increased primarily as a result of tachycardia, with no change in stroke volume. Figure 20.5 shows that LV ejection fraction was normal at rest and with exercise for both patients and control subjects, but there was a striking rise in pulmonary capillary wedge pressure in patients with diastolic heart failure, as compared with the control subjects. Accordingly, these patients clearly have “pure” diastolic heart failure: Efforts to treat their heart failure by improving systolic function (e.g., digoxin) will not be successful. As seen in Figure 20.6, diastolic distensibility markedly decreased with exercise in these patients. More recently, Borlaug et al evaluated the exercise hemodynamics of 55 patients who presented with exertional dyspnea, EF of >50, no significant coronary disease, normal BNP, and normal resting hemodynamics [mean pulmonary artery (PA) pressure <25 mmHg and PA wedge pressure (PCWP) <15 mmHg; n = 55].18 On the basis of exercise hemodynamics, 32 patients were classified as having HFpEF (PCWP >25 mmHg; n = 32) and 23 patients were classified as having noncardiac dyspnea (PCWP <25 mmHg; Figure 20.7). These data support the
value of exercise hemodynamics in reaching the correct diagnosis in selected patients with unexplained dyspnea.
value of exercise hemodynamics in reaching the correct diagnosis in selected patients with unexplained dyspnea.
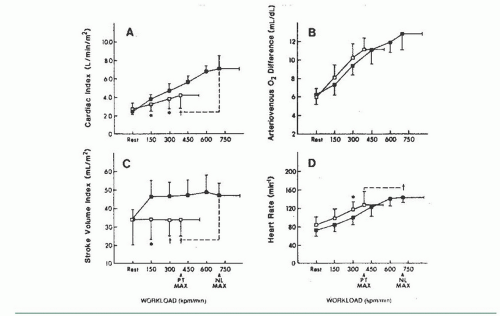 Figure 20.4 Seven patients with heart failure and normal left ventricular systolic function (open symbols) were compared with 10 age- and gender-matched healthy volunteers (solid symbols) who served as controls. All subjects underwent upright bicycle exercise with hemodynamic evaluation. Cardiac index increased for the patients with heart failure (A) as a result of an increase in heart rate (D), with fixed stroke volume (C). PT MAX, patient maximum exercise; NL MAX, normal subject maximum exercise. (From Kitzman D, et al. Exercise tolerance in patients with heart failure and preserved left ventricular systolic function: failure of the Frank-Starling mechanism. J Am Coll Cardiol 1991;17:1065, with permission.) |
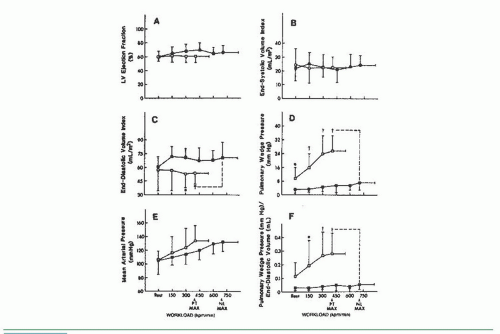 Figure 20.5 Response of left ventricular function to upright bicycle exercise in the patients with diastolic heart failure (□) and healthy controls (▪) illustrated in Figure 20.4. Pulmonary wedge pressure increases dramatically (D), but left ventricular end-diastolic volume fails to increase in the patients with heart failure (C), as compared with healthy age- and gender-matched controls. LV ejection fraction remains normal (A). The intolerance to exercise is probably the result of increased pulmonary capillary wedge pressure and the resultant increased lung stiffness rather than decreased cardiac output or oxygen delivery to metabolizing tissues. PT MAX, patient maximum exercise; NL MAX, normal subject maximum exercise. (From Kitzman D, et al. Exercise tolerance in patients with heart failure and preserved left ventricular systolic function: failure of the Frank-Starling mechanism. J Am Coll Cardiol 1991;17:1065, with permission.) |
Examples of the Use of Exercise to Evaluate Left Ventricular Failure in the Cardiac Catheterization Laboratory
A suggested supine bicycle exercise protocol for the cardiac catheterization laboratory is illustrated in Table 20.1. Examples of the hemodynamic changes that can occur during supine bicycle exercise are shown in Tables 20.2 and 20.3. Table 20.2 illustrates the response to 6 minutes of supine bicycle exercise of a 36-year-old woman with idiopathic dilated cardiomyopathy (ejection fraction 40%) whose major symptom was exertional dyspnea. Because her ejection fraction was only moderately depressed and her hemodynamic values were almost normal at rest, resting hemodynamic data alone did not clarify whether her cardiovascular reserve was impaired and whether her exertional dyspnea was likely to be cardiac in origin. During exercise, the cardiac index increased appropriately in relation to the increase in O2 consumption, yielding an exercise index of 1.1 and an exercise factor of 8.5.
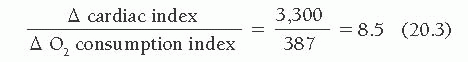
The increase in cardiac output, however, was accomplished at the cost of a substantial increase in mean pulmonary capillary wedge pressure, which rose from 11 to 27 mmHg. These data suggest that the patient had some limitation of inotropic reserve and that her ability to increase cardiac output depended heavily on use of the Frank-Starling mechanism. Therefore, her dyspnea can be considered to be of cardiac origin.
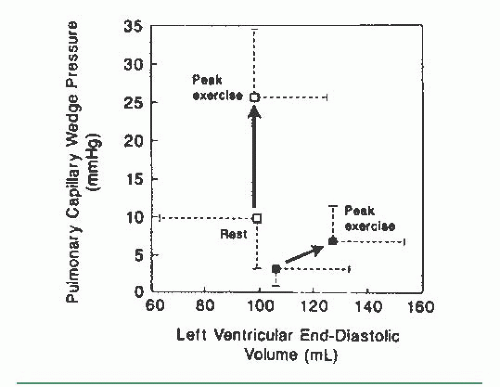 Figure 20.6 Plot of the relationship between changes in pulmonary capillary wedge pressure and left ventricular end-diastolic volume in the patients illustrated in Figures 20.4 and 20.5. In patients with diastolic heart failure, the stiff left ventricle cannot dilate normally (□) in response to the increased venous return during exercise, leading to a marked rise in left ventricular filling pressure, as compared with normal controls (▪). (From Kitzman D, et al. Exercise tolerance in patients with heart failure and preserved left ventricular systolic function: failure of the Frank-Starling mechanism. J Am Coll Cardiol 1991;17:1065, with permission.) |
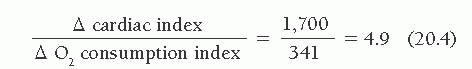
The case of a patient with more severe impairment of cardiovascular reserve is illustrated in Table 20.3, which shows the response to 6 minutes of supine bicycle exercise of a 60-year-old man with idiopathic dilated cardiomyopathy and symptoms of marked fatigue and dyspnea with minimal exertion. His chest radiograph showed cardiomegaly with no evidence of pulmonary edema, and his rest hemodynamics were almost normal. Supine bicycle exercise was associated with a marked rise in both left and right heart filling pressures and a marginal ability to increase cardiac output appropriately in relation to his increase in O2 consumption. His exercise index was 0.85, with a low exercise factor at 4.9.
The cause of exercise intolerance in some patients with LV failure is diminished cardiovascular reserve, so that oxygen delivered to the working skeletal muscle is inadequate to meet the demands of aerobic metabolism. Some other patients are limited not by the inability to deliver oxygen to working skeletal muscle but by the rise in pulmonary capillary wedge pressure associated with exercise (Table 20.2). As illustrated in these examples, the relative contributions of the inability of the heart to augment cardiac output versus an exercise-induced rise in pulmonary capillary wedge pressure that could impair gas exchange are controversial. Exercise tolerance in patients with congestive heart failure is highly variable and correlates poorly with ejection fraction. Studies of the hemodynamic and ventilatory response to exercise have shown that as the clinical severity of congestive heart failure worsens, there is a progressive decrease in maximal O2 consumption, premature onset of the anaerobic threshold, and decline in both maximal cardiac output and the cardiac output achieved at levels of submaximal O2 consumption.19 Studies of brief exercise performed by patients with chronic congestive heart failure have shown that arterial oxygen saturation usually increases (presumably as a result of increased ventilation) despite elevation of the pulmonary capillary wedge pressure; maximal oxygen extraction is normal, and ventilatory mechanisms do not limit maximum O2 consumption, so that both symptomatic limitation and the inability to normally increase oxygen delivery are caused by the failure to increase cardiac output adequately. Conversely, in patients with depressed LV ejection fraction who can achieve normal levels of exercise, factors that contribute to normal exercise capacity include normal augmentation of heart rate, the ability to increase cardiac output through further increases in LV end-diastolic volume and stroke volume, and tolerance of a high pulmonary venous pressure, possibly because of enhanced lymphatic drainage.
Therefore, in patients with severe depression of LV ejection fraction, the failure to increase cardiac output normally appears to be related both to the inability to increase stroke volume and to the inability to increase heart rate, as compared with age-matched subjects.20 This impaired chronotropic response appears to be caused by an impaired postsynaptic response to β-adrenergic stimulation that may be related to several defects, including a reduced cardiac β-receptor density, “uncoupling” of the β-receptor and adenylate cyclase activity, and deficient production of cyclic adenosine monophosphate.21
Evaluation of Valvular Heart Disease
Valvular Stenosis
Exercise may also be used in the cardiac catheterization laboratory to evaluate valvular heart disease. Gradients across the atrioventricular and semilunar valves may become apparent during exercise and may reach levels that account for the clinical symptoms of the patient. Exercise hemodynamics are especially useful when the resting transvalvular gradient or estimated valve area has borderline significance.
An example of the hemodynamic changes during supine dynamic exercise in a patient with moderate mitral stenosis is shown in Figure 20.8 and Table 20.4. As the result of increased mitral valve flow and a decreased diastolic filling period, the pressure gradient increased significantly, producing left atrial
pressures of sufficient magnitude to cause symptoms. Cardiac output increased normally, yielding an exercise index of 1.2 and an exercise factor of 5.8.
pressures of sufficient magnitude to cause symptoms. Cardiac output increased normally, yielding an exercise index of 1.2 and an exercise factor of 5.8.
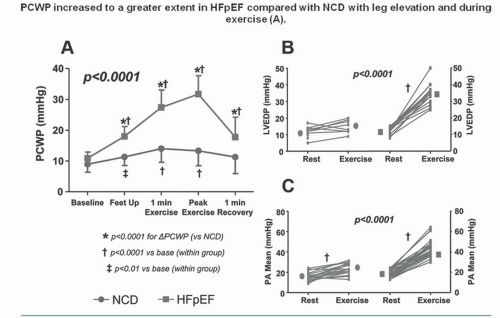 Figure 20.7 Exercise hemodynamics in patients with exertional dyspnea and preserved ejection fraction. PCWP increased to a larger extent in patients with heart failure with preserved ejection fraction (HFpEF) as compared to patients with noncardiac dyspnea (NCD) with leg elevation and during exercise (A). PCWP returned to baseline almost immediately in recovery. LVEDP (B) and mean PAP (C) also rose with exercise more dramatically in the HFpEF group (P for exercise change between groups). (Reproduced with permission from: Borlaug BA, Nishimura RA, Sorajja P, Lam CSP, Redfiled MM. Exercise hemodynamics enhance diagnosis of early heart failure with preserved ejection fraction. Circ Heart Fail 2010;3:588-595.) |
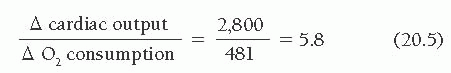
Table 20.1 Supine Bicycle Exercise Protocol18 | ||||||||
|---|---|---|---|---|---|---|---|---|
|
Stay updated, free articles. Join our Telegram channel

Full access? Get Clinical Tree


