Stress Echocardiography
Thomas H. Marwick
Overview
Stress echocardiography uses stress-induced changes in wall thickening, wall motion, and left ventricular (LV) volumes to infer the presence of myocardial ischemia and viability. The attraction of echocardiography is that it may be combined with various stressors and used in a variety of environments. The test is patient friendly because it is rapidly performed and inexpensive.
The accuracy of stress echocardiography in detecting significant coronary artery disease (CAD) ranges from 80% to 90%, exceeding that of exercise electrocardiography (ECG), especially in subgroups among whom the latter is unreliable (e.g., women and patients with LV hypertrophy). Its accuracy is comparable to that of stress myocardial perfusion scintigraphy, even though the underlying physiology of the test mandates the development of myocardial ischemia rather than perfusion heterogeneity, and this limits its sensitivity in patients who exercise submaximally or who are receiving antianginal therapy. In addition to its diagnostic role, the prognostic information provided by stress echocardiography makes it a valuable guide to management in chronic CAD, after infarction, and before major noncardiac surgery. Similarly, the presence and extent of viable myocardium are adjuncts to decision making in the management of ischemic LV dysfunction, and the detection of contractile reserve may be useful in assessing valvular and primary myocardial disease.
Several new advances are promising. Feasibility has been improved by LV opacification. Quantitative interpretation is possible with tissue Doppler and strain imaging and acoustic quantification. Evaluation of both function and perfusion is possible with echo-contrast agents. Three-dimensional imaging permits comparison of the same tissue planes before and after stress.
Glossary
Coronary steal
A situation in which a vasodilator increases runoff to a normal branch, thus reducing the driving pressure in an artery proximal to a stenosis and causing ischemia because of reduced blood flow across the stenosis.
Echocardiographic contrast agents
Injectable compounds comprising gas-filled microbubbles that increase the reflected signal of the cardiac structures in which they are located.
Myocardial strain imaging
Quantification of regional shortening using either tissue Doppler or gray-scale imaging.
Sensitivity
Proportion of patients with CAD correctly identified as abnormal.
Single-photon emission computed tomography (SPECT)
A means of acquiring and portraying scintigraphic data in a tomographic fashion.
Specificity
Proportion of patients without CAD correctly identified as normal.
Viable myocardium
Myocardial segments characterized by reduced function at rest but potentially recoverable either spontaneously (stunned) or with revascularization, usually associated with reduced myocardial perfusion (i.e., hibernating myocardium).
Introduction
The exercise ECG has been the most commonly accepted functional test, but in certain situations it is inappropriate. First, patients who either cannot exercise or who exercise submaximally account for 30% to 40% of those presenting for functional testing (1). These patients are best studied using the combination of pharmacologic stress with an imaging technique. Second, even if the patient is able to exercise, the ECG may be uninterpretable because of repolarization abnormalities. In these circumstances, the ability of the patient to exercise is exploited by the combination of exercise testing with imaging. Third, imaging is needed if clinical decision making requires the localization of ischemic or viable tissue.
The use of stress imaging tests is not restricted to the diagnosis of CAD. In patients with known coronary anatomy, a functional evaluation may help understand the site of ischemia (and thereby the culprit lesion) and distinguish among ischemic, infarcted, and viable myocardium. Similarly, the functional responses to stress may guide the management of valvular heart disease, primary myocardial disease, and some obstructive lesions.
Pathophysiology
Detection of Ischemia by Echocardiography
The normal responses of the LV to increasing workload are a uniform increase of regional wall motion, thickening, and a reduction of end-systolic LV cavity size (2). These changes return to baseline shortly after the test (3).
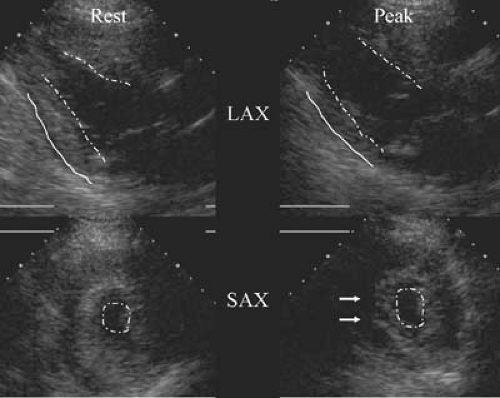
Although cardiomyopathic processes may be regional rather than global, the diagnostic algorithm for stress echocardiography (Table 50.1) assumes that regional systolic dysfunction is usually caused by CAD. In addition to reduction in the extent of thickening (Fig. 50.1) (4,5), ischemia may be identified by its timing (6). LV enlargement after stress is a marker of severe ischemia or other serious heart muscle diseases. Wall motion abnormalities may rapidly recover following the cessation of stress (7,8), but they may also persist for 30 minutes or longer (9); the time course of recovery probably reflects the severity and duration of ischemia.
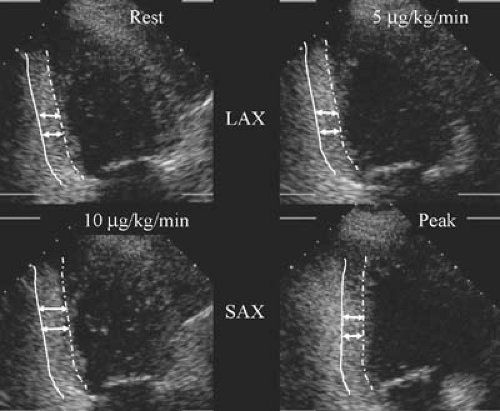
Resting wall motion abnormalities may be caused by transmural infarction, nontransmural infarction or viable, noninfarcted tissue (10), which may recover spontaneously (if the tissue is stunned) or following revascularization (if the myocardium is hibernating) (11,12). Probably, both stunned tissue and hibernating tissue contribute to chronic LV dysfunction resulting from CAD. Residual viable tissue is more common in hypokinetic than akinetic segments and is least common in dyskinetic segments (13). The augmentation of viable myocardium in response to inotropic stimulation may be detected using echocardiography with low doses of stressors (see Table 50.1). This may be combined with deterioration of function at peak dose (Fig. 50.2).
TABLE 50.1 Interpretation of Exercise and Pharmacologic Stress Echocardiography | ||||||||||||||||||||||||||||
|---|---|---|---|---|---|---|---|---|---|---|---|---|---|---|---|---|---|---|---|---|---|---|---|---|---|---|---|---|
| ||||||||||||||||||||||||||||
Methodology of Stress Echocardiography
Stress Testing Modalities
Exercise Stress
The performance of stress echocardiography in patients with known or suspected CAD who are able to exercise incorporates either treadmill stress or upright or supine cycle ergometry. In general, treadmill exercise is more widely accepted among
patients and physicians in the United States, and patients are more likely to stress maximally, although the disadvantage is that imaging is performed after stress. During exercise, heart rate, blood pressure, and inotropic state increase in proportion to the increase of cardiac work, and preload is relatively reduced during upright exercise, although this may not occur during supine exercise. The lower attainable workload with bicycle than treadmill exercise is compensated by avoiding the gap between completion of stress and the initiation of imaging. Neither bicycle nor treadmill exercise is clearly superior, so the choice depends on local expertise and familiarity. Imaging at peak stress is attractive for making assessments of the functional severity of coronary stenoses and for the assessment of valvular lesions. Moreover, the performance of imaging during stress may facilitate definition of the ischemic threshold.
patients and physicians in the United States, and patients are more likely to stress maximally, although the disadvantage is that imaging is performed after stress. During exercise, heart rate, blood pressure, and inotropic state increase in proportion to the increase of cardiac work, and preload is relatively reduced during upright exercise, although this may not occur during supine exercise. The lower attainable workload with bicycle than treadmill exercise is compensated by avoiding the gap between completion of stress and the initiation of imaging. Neither bicycle nor treadmill exercise is clearly superior, so the choice depends on local expertise and familiarity. Imaging at peak stress is attractive for making assessments of the functional severity of coronary stenoses and for the assessment of valvular lesions. Moreover, the performance of imaging during stress may facilitate definition of the ischemic threshold.
Sympathomimetic Stressors
Mechanism of Action
Hemodynamic Response
Hemodynamic Response
The attainable peak heart rates with dobutamine—from 120 to 140 beats per minute (14)—correspond to at least 85% of age-predicted heart rate in most patients. The systolic blood pressure usually increases by 30 to 40 mm Hg, with peak pressures of 170 to 180 mm Hg, and peak rate-pressure products of approximately 20,000. However, considerable variability occurs among patients with respect to both the extent and the speed of these hemodynamic responses.
Side Effects
Many patients requiring dobutamine stress are elderly and have serious noncardiac diseases or even severe CAD and LV dysfunction. Despite the use of high doses of these agents, serious complications occur in approximately 3 in 1,000 (15).
Administration Protocol
The protocol for dobutamine administration is empiric. Most centers now use a high-dose protocol (to 40 μg/kg per minute) (14,16), although low-dose protocols provide adequate stress if the duration of each stage is longer (e.g., 5 rather than 3 minutes) (17). Atropine has been combined with dobutamine at peak dose if the heart-rate target is not attained (18), and more recently it has been administered earlier in an attempt to shorten test duration (19). When evidence of myocardial viability is being sought, augmentation of function may occur only at very low doses of dobutamine, and some authors have suggested specific low-dose protocols (e.g., to 12.5 μg/kg per minute in 2.5-μg increments) for this purpose. Our practice is to use a single standard protocol with 3-minute increments, involving low-dose imaging at 5 and 10 μg/kg per minute, and proceeding in 10 μg/kg per minute increments to 40 μg/kg per minute unless this is considered unsafe, for example, because of hemodynamic instability. This offers the versatility of identifying both viability and ischemia while at the same time providing a study of acceptable length. Although caution should be exercised, the high-dose protocol appears safe for studying patients with severe LV dysfunction (20,21,22), and this gives the benefit of detecting a biphasic response, which is the most reliable marker of recovery of LV function. At present, none of the dobutamine protocols is clearly superior, and the main consideration should be to ensure the adequacy of stress.
Vasodilator Stress
Mechanism of Action
Hemodynamic Response
Hemodynamic Response
These stressors exert minor hemodynamic effects. Blood pressure is usually little altered, and heart rate increments are small and may be attributable to various side effects.
Side Effects
Serious side effects occur in approximately 1 in 1,000 patients. The most common side effects of dipyridamole and adenosine are headache and dyspnea, respectively (23,24). The speed of onset and potency of adenosine render its side effects less well tolerated, but these effects resolve rapidly with cessation of the drug. Both techniques are contraindicated in patients with untreated atrioventricular block and bronchospastic disorders, and abstinence from xanthene-containing foods and drugs is required before either stress.
Administration Protocol
The standard dipyridamole dose for myocardial perfusion imaging is 0.56 mg/kg administered over 4 minutes. For stress echocardiography, this dose induces ischemia only in patients with severe CAD, so if ischemia is not induced, an additional 0.28 mg/kg is administered over 2 minutes, followed if necessary by atropine (25), with imaging continued over 16 minutes. Although reversal of dipyridamole with aminophylline is not usually necessary, it may be useful in the presence of significant side effects. If aminophylline is needed, the supervising physician should be aware that the effect of dipyridamole may last longer than that of aminophylline, thus leading patients to become ischemic after they have left the stress laboratory.
The standard dose of adenosine for myocardial perfusion imaging is 0.14 mg/kg per minute intravenously over 4 minutes. This is also the most widely used dose for stress echocardiography, although both higher and lower doses have been studied. Although analogous to the dose of dipyridamole, higher-dose protocols are constrained by dose-limiting side effects.
Selection of the Optimal Stress Agent
Pharmacologic stressors enhance the feasibility of imaging, but they have a number of important disadvantages (Table 50.2), and exercise stress is preferable in an active patient unless the test has been performed for other reasons than the
detection of myocardial ischemia (e.g., identification of viability or coronary spasm). Although comparable levels of sensitivity are obtainable, the performance of submaximal stress owing to drug side effects is an important limitation. The development of new technologies such as strain rate imaging has made pharmacologic stressors more attractive, but whether the incremental data offered by the addition of these features justify the disadvantages of using a pharmacologic stressor in all patients remains to be established. The feasibility of perfusion assessment with myocardial contrast echocardiography is optimized by vasodilator stress, although this may be at the cost of lower sensitivity for inducible wall motion abnormalities. The combination of inotropic and vasodilator stressors was used in the past, and the desire to use vasodilators with contrast may lead these combinations to undergo a renaissance.
detection of myocardial ischemia (e.g., identification of viability or coronary spasm). Although comparable levels of sensitivity are obtainable, the performance of submaximal stress owing to drug side effects is an important limitation. The development of new technologies such as strain rate imaging has made pharmacologic stressors more attractive, but whether the incremental data offered by the addition of these features justify the disadvantages of using a pharmacologic stressor in all patients remains to be established. The feasibility of perfusion assessment with myocardial contrast echocardiography is optimized by vasodilator stress, although this may be at the cost of lower sensitivity for inducible wall motion abnormalities. The combination of inotropic and vasodilator stressors was used in the past, and the desire to use vasodilators with contrast may lead these combinations to undergo a renaissance.
TABLE 50.2 Benefits of Exercise over Pharmacologic Stress | |
|---|---|
|
The type of pharmacologic stress may also be the source of debate. Serious side effects are rare with either stress, and the frequency of all side effects with dipyridamole and dobutamine stress is comparable, but the contraindications to each test are different. Patients with asthma or untreated conduction system disease may be better tested using dobutamine echocardiography, whereas dipyridamole stress would be preferable in those with serious arrhythmias or severe hypertension. In the majority of patients, who do not fall into these categories, either stressor may be used, and the choice may be based on physician preference, cost, and the clinical situation. If the question relates to the diagnosis of CAD in a patient with chest pain, the sensitivity of dobutamine echocardiography is somewhat greater than that of dipyridamole echocardiography, especially in patients with single-vessel disease. If the main interest is in prognostic evaluation, the agents are both attractive, and certainly a wealth of information is available regarding dipyridamole echocardiography as a prognostic test (see the section on prognostic considerations in CAD).
Imaging Techniques
Stress echocardiography is almost universally performed using transthoracic echocardiography, although transesophageal imaging is sometimes used in the setting of poor image quality. The procedure brings together facilities for stress testing, echocardiography, and at least two and sometimes three staff members including physician, sonographer, and nurse. The commitment of so many resources limits the feasibility of performing an exhaustive echocardiographic examination in the context of stress echocardiography, but we perform a screening M-mode and color Doppler examination at the beginning of every study. If more complex (e.g., valvular) problems are identified, these issues should be analyzed by echocardiography at another time.
Analysis of digital loops is beneficial for the interpretation of all forms of stress echocardiography. Side-by-side comparison of cine loops in a split-screen display permits easy comparison of regional wall motion at rest and stress, and frame-by-frame review facilitates definition of the endocardium as well as evaluation of the temporal sequence of contraction. The disadvantages of this approach, however, are the finite number of views that can be compared using the quad-screen display and the presentation of a limited number of cardiac cycles. Despite the advantages and ubiquity of digital storage, review of the videotape remains an important and underutilized part of stress echocardiographic interpretation, especially in difficult studies (26).
Interpretation of Stress Echocardiography
Qualitative Approaches
The interpretation of stress echocardiography using the standard, qualitative approach is centered on comparison of each LV segment is before, during, and after stress. Myocardial thickening (see Fig. 50.1) should be examined in preference to myocardial motion, which may result from translational movement, or tethering. The standard criteria used to identify ischemia, myocardial viability, and myocardial scar have been summarized earlier (see Table 50.1). Delayed contraction is a subtle index of ischemia that may be difficult to identify in continuous-loop playback but can be appreciated by stepping through individual freeze-frame images. Stress-induced LV enlargement is often a marker of multivessel CAD, and changes of ventricular shape as well as size are useful diagnostic clues to ischemia. Myocardial viability is characterized by improvement of a dyssynergic zone in response to low-dose dobutamine. The “biphasic” response, an association of this finding with ischemia at peak doses of dobutamine (see Fig. 50.2), is an indicator of myocardial viability in the setting of a stenosed vessel (27). An improvement without subsequent deterioration is an ambiguous finding that may signify viability or nontransmural infarction. The presence of augmentation at peak doses of dobutamine is a nonspecific response, poorly predictive of myocardial viability.
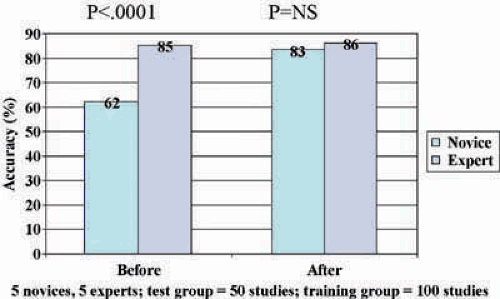
The subjectivity of current approach to the interpretation of stress echocardiography is the greatest shortcoming of this technique. This has two major manifestations: first, the need for training, and, second, the problems posed for reproducibility. Despite technical advances, repeated studies since the mid-1980’s have confirmed the need for specific training in stress echocardiography (28). The exact characteristics of this training period are not well defined, but evidence has been gathered to show improvement to expert level with 100 studies (Fig. 50.3), and some improvement has been documented even with short courses (29). However, once this level of skill is attained, we believe that a regular workload is required to prevent it from attenuating. Finally, even among expert readers, although the concordance of interpretations within the same center is high (30), concordance among different centers may be less than 80% (31), even when uniform interpretive criteria are used (32). Poor concordance is particularly a problem in studies of poor technical quality, and the problem has been reduced by technical advances including harmonic imaging and digital display (33). Nonetheless, interpretive disagreements remain common, especially in patients with subtle abnormalities resulting from mild CAD.
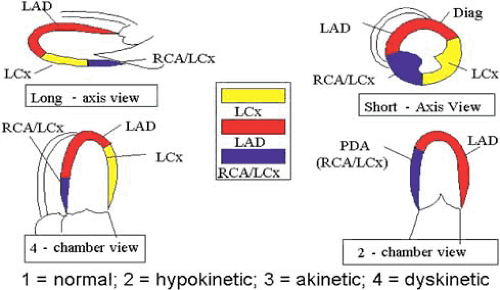
To control issues related to subjectivity and concordance among observers, we review stress echocardiograms systematically. Quad-screen displays are first examined to assess their quality and the presence of technical limitations (e.g., gating problems); in technically limited studies, more reliance will need to be based on analysis of the videotape. Resting images
are then examined in each view, using a segmental model to score regional wall motion (Fig. 50.4). Global function may be assessed subjectively by calculation of a wall motion scoring index or by measurement of the ejection fraction. The rest and stress images are then compared. The first step is to check for the presence of LV enlargement and shape changes, which are global indicators of ischemia, and in the case of the former, of multivessel disease. Each segment is then scored and compared with the equivalent segment at rest to identify the site, extent, and severity of abnormal function. If a bicycle or dobutamine stress study is used, the ischemic threshold is an important clue to the severity of ischemia. The report should therefore describe the site, extent, and severity of scar and ischemia, the global LV function before and after stress, and the presence of other abnormalities.
are then examined in each view, using a segmental model to score regional wall motion (Fig. 50.4). Global function may be assessed subjectively by calculation of a wall motion scoring index or by measurement of the ejection fraction. The rest and stress images are then compared. The first step is to check for the presence of LV enlargement and shape changes, which are global indicators of ischemia, and in the case of the former, of multivessel disease. Each segment is then scored and compared with the equivalent segment at rest to identify the site, extent, and severity of abnormal function. If a bicycle or dobutamine stress study is used, the ischemic threshold is an important clue to the severity of ischemia. The report should therefore describe the site, extent, and severity of scar and ischemia, the global LV function before and after stress, and the presence of other abnormalities.
Quantitative Approaches
Quantitative techniques may be used for the measurement of radial or longitudinal function (Table 50.3). Myocardial displacement may be measured in the short- or long-axis dimension. The centerline approach is well established for measuring regional radial function, which has been applied to the interpretation of stress echocardiograms (34). Using this technique, radial excursion is measured by tracing of the endocardial surface (thickening is sometimes possible to measure by tracing of endocardial and epicardial surfaces) at peak diastole and peak systole, and it is compared with a normal range. This technique has three major limitations. First, many stress echocardiograms are not of satisfactory quality to provide excellent border definition. Second, the approach requires compensation for translational or rotational cardiac movement, and methodologies for compensating for these technical issues are not well defined. Third, the process of tracing the wall is time consuming and is not applicable in a busy clinical laboratory.
TABLE 50.3 Quantitative Techniques for the Evaluation of Stress Echocardiography | ||||||||||||||||||
|---|---|---|---|---|---|---|---|---|---|---|---|---|---|---|---|---|---|---|
|
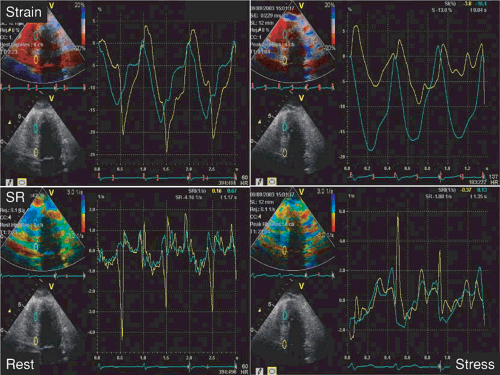
Because of these limitations, efforts to quantify stress echocardiography have moved more to the measurement of longitudinal function using strain and strain rate imaging. Currently, this is performed using tissue Doppler imaging (Fig. 50.5), although recent developments have focused on obtaining these data from speckle-tacking from standard two-dimensional echocardiography.
Diagnosis of Coronary Artery Disease
Influences on Accuracy of Stress Echocardiography
Adequacy of Stress
Failure to stress the heart maximally will not engender either maximal coronary hyperemia (used for myocardial perfusion
imaging) or ischemia (used for stress echocardiography and ECG analysis). Thus, failure to stress the patient maximally will be associated with reduced sensitivity, especially for milder CAD. Indeed, in our experience of exercise echocardiography, apart from the number and severity of coronary stenoses, the only predictor of false-negative results was failure to obtain 85% of age-predicted maximum heart rate (35). As discussed previously, patients who are unable to exercise or who are likely to exercise submaximally should undergo pharmacologic stress testing.
imaging) or ischemia (used for stress echocardiography and ECG analysis). Thus, failure to stress the patient maximally will be associated with reduced sensitivity, especially for milder CAD. Indeed, in our experience of exercise echocardiography, apart from the number and severity of coronary stenoses, the only predictor of false-negative results was failure to obtain 85% of age-predicted maximum heart rate (35). As discussed previously, patients who are unable to exercise or who are likely to exercise submaximally should undergo pharmacologic stress testing.
The use of pharmacologic stress testing may be particularly useful in patients with previous myocardial infarction and resting wall motion abnormalities. In these situations, the identification of ischemia may be facilitated by the availability of low-dose augmentation in viable tissue (36), which may not be appreciated during exercise testing. This topic is discussed further in a later section on identification of myocardial viability.
Echocardiographic Considerations
Poor image quality reduces concordance among expert observers (31), and it likely reduces the accuracy of the test, if not for the identification of CAD (35) then at least for the ability to recognize multivessel disease. Not all segments of the myocardium are equally well visualized; the lateral wall is usually parallel to the ultrasound beam in the apical four-chamber view, and the endocardium may be poorly defined, with consequent effects on the sensitivity for left circumflex disease. Fortunately, this problem has been improved by the development of lateral gain correction, harmonic imaging, and LV opacification. The basal inferoposterior walls are particularly difficult to interpret owing to tethering to the plane of the mitral valve and poor endocardial definition. Wall motion abnormalities involving the latter segments should be identified only if adjacent segments are abnormal.
Several interpretive factors may also influence the accuracy of the data. First, a low threshold for identifying wall motion abnormalities (e.g., identification of minor stress-induced wall motion abnormalities as ischemic or identification of failure to enhance function as being indicative of ischemia) is attended by a high sensitivity, but a correspondingly low specificity. Interpreter bias may also be an important source of inaccuracy. It is important to interpret the echocardiographic data independent of the clinical and stress testing data; failure to do so may compromise accuracy (particularly the specificity). The experience of the reader is obviously an important determinant of
accuracy during stress echocardiography. Factors responsible for false-negative and false-positive results are summarized in Table 50.4.
accuracy during stress echocardiography. Factors responsible for false-negative and false-positive results are summarized in Table 50.4.
TABLE 50.4 Causes of False-Negative and False-Positive Stress Echocardiogram Results | ||||
|---|---|---|---|---|
|
Exercise Echocardiography
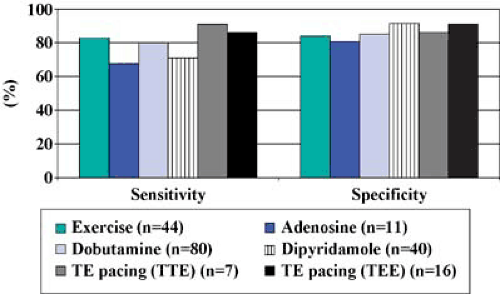
With appropriate patient selection according to exercise capacity, and with an expert sonographer, exercise echocardiography is feasible in almost all patients. A recent metaanalysis (37) identified 41 studies of exercise echocardiography, with an average sensitivity of 83% and specificity of 84% (Fig. 50.6). Important landmarks in developing the evidence base have been the initial validation of treadmill exercise echocardiography (38), its application in standard clinical practice (35), and the initial major bicycle stress study (39). Generally, variability in the reported accuracy reflects differences in patient mix among studies, although some differences arise because of different criteria for significant stenoses (9). Quantitative angiography has been used in a few studies; Sheikh and associates (40) reported that inducible wall motion abnormalities were associated with a stenosis diameter of 1.0 mm, compared with patients without inducible ischemia in spite of detectable stenoses, among whom the diameter was 1.7 mm. Agati and colleagues (41) identified an absolute lumen diameter of 0.7 mm, corresponding to an 85% diameter stenosis, as best predictive of inducible wall motion abnormalities.
Pharmacologic Stress Echocardiography
Dobutamine Stress Echocardiography
The metaanalysis (37) identified 80 studies of dobutamine echocardiography, with an average sensitivity of 80% and specificity of 85% (see Fig. 50.6). Variability in the reported accuracy of the test arises from reasons related to the test and study population. The addition of atropine increases sensitivity (18), as does the use of transesophageal echocardiography (42), although the feasibility of the latter is limited.
At quantitative coronary angiography (43,44,45), the optimal correlates of a positive dobutamine test result are a lumen diameter of 1.07 mm, percent diameter stenosis of 52%, and percent area stenosis of 75%; minimal lumen diameter has the best predictive value for a positive dobutamine stress test result (sensitivity, 94%; specificity, 75%; odds ratio, 51) (43). Stenoses less than 1 mm in diameter can be identified with a sensitivity of 86% (44


Stay updated, free articles. Join our Telegram channel

Full access? Get Clinical Tree


