Staged surgical palliation has revolutionized the care of patients with hypoplastic left heart syndrome (HLHS), although the outcomes of survival and cost at a national level remain unclear. This study sought to evaluate (1) trends in HLHS surgical outcomes including in-hospital mortality, length of stay (LOS), and cost, and (2) patient and hospital risk factors associated with these outcomes. Hospitalizations for patients with HLHS, including stage I, II, and III palliations, were analyzed using the Kids’ Inpatient Database from 2000 through 2009. Trends in mortality, LOS, and cost were analyzed and chi-squared tests were used to test association between categorical variables. Patient and hospital characteristics associated with death were analyzed using logistic regression and associations with LOS were analyzed using ordinary least squared regression. There were 16,923 hospital admissions in patients with HLHS of which 5,672 (34%) included surgical intervention. Total (3,201–5,102) and surgery-specific admissions (1,165–1,618) increased from 2000 to 2009. Mortality decreased 14% per year in stage III palliations (odds ratio [OR] 0.86; 95% confidence interval [CI]: 0.79–0.94) and 6% per year for stage I palliations (OR 0.94; 95% CI 0.90–0.99) but not for stage II palliations (OR 1.01; 95% CI; 0.89–1.14). Length of stay increased for stage I and II palliations; however, per-patient hospital cost decreased in 2009. In conclusion, recent decrease in per patient cost for staged surgical palliation for HLHS has correlated temporally with improved mortality.
The advent of staged surgical palliation in patients with hypoplastic left heart syndrome (HLHS), including modified Norwood, Glenn, and Fontan procedures, has vastly improved the likelihood of patient survival in an otherwise universally fatal form of congenital heart disease. Although patient care including fetal diagnosis, surgical techniques, and postoperative management has improved, hospital morbidity and mortality in patients with HLHS remain significant. Like many disease processes in the field of pediatric cardiology, outcomes analysis in patients with HLHS are often limited to relatively small cohorts from single or small multi-institutional studies, and these results reported by select, high-volume centers may not be generalizable. Studies using larger data registries or consortiums may address some of those limitations; however, those findings may be biased by the characteristics of the hospitals that choose to participate. To date, there has not been a population-based, nationally representative evaluation of surgical HLHS outcomes in the United States. Furthermore, although it has been demonstrated that surgical palliation for HLHS requires significant resources, little is known with regard to patient and hospital factors associated with mortality and resource utilization. Therefore, we sought to analyze trends of hospital admissions, in-hospital survival, hospital length of stay (LOS), and hospital cost during staged surgical palliation. Additionally, we sought to analyze patient and hospital characteristics associated with surgical outcomes. We used the Kids’ Inpatient Database (KID), part of the national Healthcare Utilization Project (HCUP), which allows for national estimates of relatively rare diseases.
Methods
This study was a retrospective, observational data analysis over a 10-year period from 2000 to 2009. This study was performed in accordance with the institutional review board at Cincinnati Children’s Hospital Medical Center (IRB# 2011-1926).
The 2000, 2003, 2006, and 2009 KID data were used. The KID, developed by HCUP, which was sponsored by the Agency for Healthcare Research and Quality, was designed to analyze inpatient visits for children aged ≤20 years in the United States and has been used in several previous studies in the evaluation of pediatric cardiac disease processes and procedures. The KID includes a sample of discharges of children, extracted from >2,500 hospitals. The hospitals were community-based, nonrehabilitation hospitals and included stand-alone pediatric centers. Because of its large sample size, the KID is ideal for analyzing rare conditions, procedures, and subpopulations that cannot be studied using a single institution. The KID contains discharge weights or multipliers that, when multiplied for each visit, produce national estimates. The unit of analysis is the hospital visit.
Visits were identified in patients aged ≤20 years. All diseases and procedures were identified using primary and secondary International Classification of Diseases, Ninth Revision (ICD-9) procedure codes. This study evaluated admissions of patients with HLHS (ICD-9 code 746.7). Concomitant surgical codes during a visit identified the following palliative procedures: stage I, stage II, or stage III palliation. Stage I Norwood palliations were classified as either Norwood with modified Blalock-Taussig shunt (ICD-9 code 39.0) or as Norwood with Sano modification (ICD-9 code 35.92) in patients between the ages of 0 and 4 months. Stage II palliations were classified as bidirectional Glenn (BDG) palliations using ICD-9 code 39.21 in patients 2 to 9 months. Stage III palliations were classified as Fontan procedures (ICD-9 codes 35.95, 35.94) in patients 6 months to 20 years. These age ranges were chosen to minimize outliers likely to represent data entry errors. A small percentage of patients underwent stage I and II palliative procedures during the same admission and were identified by the presence of defined codes for both stage I and II palliations during the same hospital admission. For descriptive purposes, these patients were described separately. For purposes of statistical analysis, they were used in both the stage I and stage II analyses.
Patient-related variables were gender, age, comorbidities such as prematurity and low birth weight, parent demographics, and payor type. Birth weight was only included in the analysis of stage I admissions. Low birth weight was defined as weight less than 2,500 grams. Age in months was analyzed as a continuous variable. Because data on race was missing for a majority of records in the data set, race was not used in the analysis. Payor type was classified as private insurance, government insurance including Medicaid and Medicare, and other, which included self-pay, no charge, and charity.
Hospital-related variables included information such as hospital bed size, teaching versus nonteaching status, location, and region. A small bed-size hospital is defined as rural with 1 to 49 beds, urban, and nonteaching with 1 to 99 beds or urban and teaching with teaching with <300 beds; a medium bed-size hospital is defined as rural with 50 to 99 beds, urban and nonteaching with 100 to 199 beds, or urban and teaching with 300 to 499 beds; a large bed-size hospital is defined as rural with >99 beds, urban and nonteaching with >199 beds, or urban and teaching with >499 beds. Bed size categories were defined by the KID based on hospital beds and were specific to the hospital’s region, location, and teaching status. The bed size cutoff points were chosen so that approximately one-third of the hospitals in a given region, location, and teaching status combination would fall within each bed-size category (small, medium, large). Different cut-off points for rural, urban nonteaching, and urban teaching hospitals were used because hospitals in those categories tend to be small, medium, and large, respectively. Using differing cut-off points in this manner avoids strata containing small numbers of hospitals. Hospital region was defined as Northeast, Midwest, South, or West.
In-hospital mortality was identified by the death variable in the KID. Because the KID is cross sectional and does not contain patient identifiers, there is no ability to track individual patients following hospital discharge to link separate hospital admissions on an individual patient. Mortality was only able to be determined during the hospitalization for surgical palliation, and we were not able to identify deaths following discharge either at home or on readmission.
The KID database reports charges for each visit. The Agency for Healthcare Research and Quality provides a cost-to-charge multiplier that, when applied to the data, estimates the costs associated with each visit. The cost-to-charge ratios are hospital-specific based on all-payor inpatient cost for hospitals in the database. Cost is collected by the Centers for Medicare and Medicaid Services. Costs from 2003 and 2006 were inflated to 2009 cost using the consumer price index for inpatient hospital services. Because there was no charge-to-cost multiplier available for the 2000 KID data set, cost analysis was only performed on the 2003, 2006, and 2009 data sets. LOS is a continuous variable in the data.
All analyses was conducted using SAS version 9.2 (SAS Institute Inc., Cary, North Carolina) survey techniques to account for the complex survey design of HCUP as noted in the HCUP documentation to obtain national estimates. Estimates based on ≤10 unweighted observations were not reported according to HCUP agreement. Descriptive statistics including means for continuous variables and frequencies and percentages for categorical variables were used to describe the trends in surgical palliation procedures for each of the 3 stages. Logistic regression was conducted to predict the odds of death during the visit, and ordinary least squares regression was used for a model testing variable effects on length of hospital stay. The multivariable models for mortality and LOS include the following covariates: age at admission, insurance type, income, hospital region, hospital size, year of the study, and birth weight for Stage I.
Results
There were 16,923 admissions for patients with HLHS for the 2000, 2003, 2006, and 2009 time points of which 5,672 (34%) were admissions for staged surgical palliation ( Table 1 ). From 2000 through 2009, there was an increasing number of total HLHS admissions as well as admissions with associated staged surgical palliations. Comparing surgical admissions by stage type, there was a decrease in the percent of admissions for stage I palliation, from 62% in 2000 to 48% in 2009, with a corresponding increase in admissions for stage II, from 17% in 2000 to 26% in 2009, and III, from 24% in 2000 to 29% in 2009, procedures. Within the stage I palliation cohort, the majority of procedures were performed with a Blalock-Taussig shunt with an abrupt increase in patients undergoing stage I palliation with the Sano modification in 2003.
| 2000 | 2003 | 2006 | 2009 | |
|---|---|---|---|---|
| Total admissions for patients with HLHS | 3,201 (0.04%) | 3,880 (0.05%) | 4,740 (0.06%) | 5,102 (0.07%) |
| Total surgical admissions ∗ | 1,165 (36%) | 1,252 (32%) | 1,637 (34%) | 1,618 (32%) |
| Surgical admissions by surgical stage type † | ||||
| Stage I palliation total † | 721 (62%) | 660 (53%) | 780 (48%) | 780 (48%) |
| Norwood with BTS | 716 (99%) | 626 (95%) | 728 (93%) | 721 (92%) |
| Norwood with Sano modification ‡ | § | 87 (13%) | 106 (15%) | 119 (15%) |
| Norwood with both BTS and Sano modifications ‡ | § | 53 (4%) | 58 (4%) | 60 (4%) |
| Stage II palliation † | 199 (17%) | 273 (22%) | 453 (28%) | 418 (26%) |
| Stage I and II palliations | 15 (1%) | 22 (2%) | 47 (3%) | 56 (3%) |
| Stage III palliation † | 274 (24%) | 348 (28%) | 448 (27%) | 475 (29%) |
∗ Percent of surgical HLHS admissions compared with total HLHS admissions.
† Percent of surgical stage type admissions compared with total HLHS surgical admissions.
‡ Percent of stage I surgical subtype admissions compared with total stage I admissions.
§ Estimates based on ≤10 observations were suppressed according to HCUP documentation.
For all surgical palliation stages, male predominance was stable through the time periods ( Table 2 ). In 2000, the majority of visits were for patients with private insurance; however, from 2000 through 2009, there was a statistically significant decrease in visits for patients with private insurance coverage with a concomitant increase in visits for patients with Medicare/Medicaid coverage.
| 2000 | 2003 | 2006 | 2009 | p Value | |
|---|---|---|---|---|---|
| Stage I palliation | |||||
| Prematurity | ∗ | 17 (2.6%) | 40 (5.2%) | 54 (6.9%) | 0.07 |
| Birth weight (g), mean | 3,130 | 2,995 | 3,056 | 3,135 | 0.86 |
| Age at admission (mo), mean | 0.2 | 0.2 | 0.4 | 0.3 | 0.51 |
| Male gender | 450 (62%) | 423 (64%) | 474 (61%) | 474 (61%) | 0.07 |
| Insurance type | |||||
| Medicare/Medicaid | 259 (37%) | 270 (41%) | 412 (53%) | 405 (52%) | 0.01 |
| Blue Cross, Blue Cross PPO | 405 (57%) | 329 (50%) | 303 (39%) | 330 (42%) | 0.02 |
| Other/self-pay | 43 (6.1%) | 60 (9.1%) | 64 (8.2%) | 46 (5.9%) | 0.32 |
| Median household income quartile | |||||
| 0–25th percentile | 67 (9.8%) | 157 (24%) | 237 (31%) | 206 (27%) | 0.37 |
| 26th–50th percentile (median) | 217 (31%) | 214 (33%) | 205 (27%) | 220 (29%) | 0.49 |
| 51st–75th percentile | 204 (30%) | 150 (23%) | 174 (23%) | 206 (27%) | 0.69 |
| 76th–100th percentile | 199 (29%) | 122 (19%) | 155 (20%) | 139 (18%) | 0.03 |
| Stage II palliation | |||||
| Age at admission (mo), mean | 6.8 | 5.7 | 5.8 | 5.5 | 0.02 |
| Male gender | 118 (59%) | 181 (66%) | 279 (62%) | 259 (62%) | 0.44 |
| Insurance type | |||||
| Medicare/Medicaid | 72 (37%) | 94 (34%) | 210 (46%) | 190 (45%) | 0.04 |
| Blue Cross, Blue Cross PPO | 117 (59%) | 161 (59%) | 201 (44%) | 189 (45%) | 0.08 |
| Other/self-pay | ∗ | 18 (6.6%) | 42 (9.4%) | 39 (9.4%) | 0.97 |
| Median household income quartile | |||||
| 0–25th percentile | 26 (13%) | 72 (27%) | 116 (26%) | 99.4 (24%) | 0.45 |
| 26th–50th percentile (median) | 39 (20%) | 74 (28%) | 121 (27%) | 115.3 (28%) | 0.05 |
| 51st–75th percentile | 64 (33%) | 58 (22%) | 124 (28%) | 112.8 (27%) | 0.37 |
| 76th–100th percentile | 68 (35%) | 59 (23%) | 89 (20%) | 87.4 (21%) | 0.04 |
| Stage III palliation | |||||
| Age at admission (mo), mean | 31.4 | 36.7 | 40.8 | 37.4 | 0.05 |
| Male gender | 179 (65%) | 213 (61%) | 282 (63%) | 318 (67%) | 0.65 |
| Insurance type | |||||
| Medicare/Medicaid | 97 (37%) | 132 (39%) | 193 (43%) | 207 (44%) | 0.004 |
| Blue Cross, Blue Cross PPO | 163 (62%) | 189 (55%) | 221 (49%) | 239 (50%) | 0.04 |
| Other/self-pay | ∗ | 22 (6.3%) | 34 (7.6%) | 29 (6.1%) | 0.72 |
| Median household income quartile | |||||
| 0–25th percentile | 17 (6.7%) | 90 (27%) | 112 (26%) | 114 (24%) | 0.36 |
| 26th–50th percentile (median) | 51 (20%) | 101 (30%) | 116 (27%) | 102 (22%) | 0.31 |
| 51st–75th percentile | 82 (32%) | 83 (24%) | 100 (23%) | 148 (32%) | 0.29 |
| 76th–100th percentile | 111 (42%) | 66 (19%) | 105 (24%) | 105 (22%) | 0.07 |
∗ Estimates based on ≤10 observations were suppressed according to HCUP documentation.
For patients undergoing stage I palliation, birth weight and age at hospital admission remained stable. There was a trend toward an increasing percentage of premature infants undergoing this procedure though not statistically significant (p = 0.07). There was a significant decrease in patient age at time of admission for surgical palliations involving stage II (p = 0.02) patients, whereas stage III (p = 0.05) patients demonstrated a statistically significant increase in patient age over the same time period. For all surgical stages, the majority of procedures were performed in large urban teaching institutions ( Table 3 ).
| 2000 | 2003 | 2006 | 2009 | p Value | |
|---|---|---|---|---|---|
| Stage I palliation | |||||
| Hospital teaching status | |||||
| Teaching | 701 (98%) | 601 (96%) | 729 (96%) | 661 (97%) | 0.20 |
| Hospital region | |||||
| Northeast | 254 (35%) | 137 (21%) | 94 (12%) | 120 (15%) | 0.03 |
| Midwest | 57 (7.9%) | 145 (22%) | 217 (28%) | 187 (24%) | 0.30 |
| South | 230 (32%) | 236 (36%) | 260 (33%) | 257 (33%) | 0.20 |
| West | 180 (25%) | 141 (21%) | 208 (27%) | 216 (28%) | 0.14 |
| Hospital location | |||||
| Urban | 707 (99%) | 615 (98%) | 756 (100%) | 675 (99%) | 0.94 |
| Hospital size | |||||
| Small | 159 (22%) | 107 (17%) | 131 (17%) | 66 (9.7%) | 0.02 |
| Medium | 326 (45%) | 273 (44%) | 232 (31%) | 218 (32%) | 0.34 |
| Large | 232 (32%) | 247 (39%) | 393 (52%) | 395 (58%) | 0.09 |
| Hospital cost (USD) | n/a | $175,206 | $175,826 | $157,938 | <0.001 |
| Stage II palliation | |||||
| Hospital teaching status | |||||
| Teaching | 196 (99%) | 264 (100%) | 439 (90%) | 401 (100%) | 0.18 |
| Hospital region | |||||
| Northeast | 38 (19%) | 73 (27%) | 49 (11%) | 85 (20%) | 0.24 |
| Midwest | 42 (21%) | 84 (31%) | 166 (37%) | 121 (29%) | 0.14 |
| South | 38 (19%) | 34 (12%) | 93 (21%) | 67 (16%) | 0.54 |
| West | 81 (41%) | 83 (30%) | 144 (32%) | 146 (35%) | 0.65 |
| Hospital location | |||||
| Urban | 193 (98%) | 262 (99%) | 446 (100%) | 401 (100%) | 0.55 |
| Hospital size | |||||
| Small | 34 (17%) | 63 (24%) | 88 (20%) | 40 (10%) | 0.21 |
| Medium | 65 (33%) | 108 (41%) | 135 (30%) | 156 (39%) | 0.66 |
| Large | 98 (50%) | 92 (35%) | 222 (50%) | 204 (51%) | 0.53 |
| Hospital Cost (USD) | n/a | $75,005 | $84,754 | $82,113 | <0.001 |
| Stage III palliation | |||||
| Hospital teaching status | |||||
| Teaching | 268 (98%) | 303 (97%) | 419 (95%) | 413 (98%) | 0.20 |
| Hospital region | |||||
| Northeast | 118 (43%) | 67 (19%) | 91 (20%) | 92 (19%) | 0.07 |
| Midwest | 37 (14%) | 115 (33%) | 135 (30%) | 152 (32%) | 0.15 |
| South | 59 (22%) | 87 (25%) | 139 (31%) | 134 (28%) | 0.07 |
| West | 60 (22%) | 80 (23%) | 83 (19%) | 97 (20%) | 0.62 |
| Hospital location | |||||
| Urban | 272 (99%) | 310 (99%) | 439 (100%) | 421 (100%) | 0.15 |
| Hospital size | |||||
| Small | 59 (22%) | 55 (18%) | 90 (21%) | 37 (8.8%) | 0.14 |
| Medium | 128 (47%) | 116 (37%) | 134 (31%) | 119 (28%) | 0.07 |
| Large | 87 (32%) | 141 (45%) | 215 (49%) | 266 (63%) | 0.05 |
| Hospital cost (USD) | n/a | $75,448 | $75,873 | $67,110 | <0.001 |
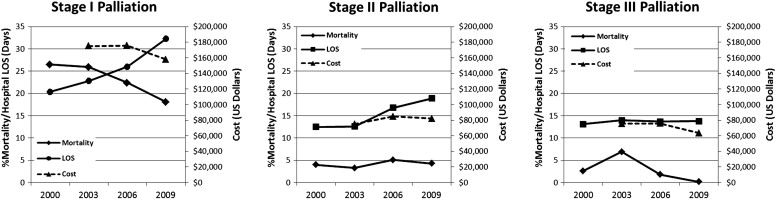
There was a decreasing trend in stage I hospital mortality from 27% in 2000 to 18% in 2009 though not statistically significant (p = 0.07; Figure 1 ). There was a similar but more pronounced decrease in mortality for stage III surgical admissions with a mortality rate of 0.2% in 2009 down from a peak of 6.9% in 2003 (p <0.0001). In comparison to stage I and III surgical admissions, hospital mortality in stage II surgical admissions was stable through the time period (4% in 2000, 4.3% in 2009; p = 0.87). Costs for hospitalizations remained stable for stage I and III between 2003 and 2006, trending down in 2009. Costs for hospitalizations for stage II rose between 2003 and 2006 and trended down slightly in 2009.
For patients undergoing stage I palliation, hospital region in the South (odds ratio [OR] 2.16; 95% confidence interval [CI]: 1.29–3.63; p = <0.01) and West (OR 2.32; 95% CI: 1.39–3.90; p = 0.001) were associated with increased mortality compared with the Northeast ( Table 4 ). More recent surgical year was associated with decreased mortality with a 6% per year decline in mortality per 1-year increment (OR 0.94; 95% CI: 0.90–0.99; p = 0.01), and medium-sized hospitals were associated with reduced mortality compared with large-sized hospitals (OR 0.51; 95% CI: 0.37–0.7). Visits for patients with low birth weight had an almost 10-fold increase in mortality (OR 9.85; 95% CI: 2.75–35.28; p <0.001).
| Stage I | Stage II | Stage III | |||||||
|---|---|---|---|---|---|---|---|---|---|
| (n = 1,719) | (n = 790) | (n = 903) | |||||||
| OR | 95% CI | p Value | OR | 95% CI | p Value | OR | 95% CI | p Value | |
| Age at admission (mo) | 0.76 | 0.76–1.33 | 0.3 | 0.75 | 0.28–2.02 | 0.5719 | 0.60 | 0.40–0.91 | 0.02 |
| Birth weight | |||||||||
| <2,500 g | 9.85 | 2.75–35.28 | <0.001 | not collected | not collected | ||||
| ≥2,500 g | 1.00 | Reference | |||||||
| Insurance type | |||||||||
| Medicare/Medicaid | 1.00 | Reference | 0.00 | Reference | 1.00 | Reference | |||
| Blue Cross, Blue Cross PPO | 0.97 | 0.74–1.26 | 0.8 | 0.71 | 0.22–2.25 | 0.6 | 0.77 | 0.33–1.77 | 0.5 |
| Self-pay/other | 0.98 | 0.62–1.54 | 0.9 | 0.13 | 0.03–0.50 | <0.01 | 0.35 | 0.02–5.27 | 0.4 |
| Income | |||||||||
| 0–25th percentile | 1.00 | Reference | 1.00 | Reference | 1.00 | Reference | |||
| 26th–50th percentile | 1.39 | 0.98–1.97 | 0.07 | 0.32 | 0.08–1.28 | 0.1 | 0.21 | 0.03–1.35 | 0.1 |
| 51st–75th percentile | 0.97 | 0.65–1.46 | 0.9 | 0.53 | 0.18–1.56 | 0.2 | 0.74 | 0.22–2.44 | 0.6 |
| 76th–100th percentile | 1.27 | 0.83–1.93 | 0.3 | 0.21 | 0.04–0.97 | 0.05 | 0.28 | 0.05–1.47 | 0.1 |
| Hospital region | |||||||||
| 1 = Northeast | 1.00 | Reference | 1.00 | Reference | 1.00 | Reference | |||
| 2 = Midwest | 1.25 | 0.66–2.39 | 0.5 | 0.46 | 0.14–1.52 | 0.2 | 2.70 | 0.33–22.12 | 0.4 |
| 3 = South | 2.16 | 1.29–3.63 | <0.01 | 0.73 | 0.26–2.04 | 0.6 | 2.03 | 0.27–15.45 | 0.5 |
| 4 = West | 2.32 | 1.39–3.90 | 0.001 | 0.26 | 0.06–1.04 | 0.06 | 7.12 | 1.41–36.03 | 0.02 |
| Hospital size | |||||||||
| 1 = Large | 1.00 | Reference | 1.00 | Reference | 1.00 | Reference | |||
| 2 = Medium | 0.51 | 0.37–0.70 | <0.0001 | 0.61 | 0.19–2.00 | 0.4 | 1.10 | 0.24–5.02 | 0.9 |
| 3 = Small | 0.93 | 0.61–1.41 | 0.7 | 0.68 | 0.16–2.96 | 0.6 | 1.53 | 0.46–5.12 | 0.5 |
| Year | 0.94 | 0.90–0.99 | 0.01 | 1.01 | 0.89–1.14 | 0.9 | 0.86 | 0.79–0.94 | <0.001 |
Stay updated, free articles. Join our Telegram channel

Full access? Get Clinical Tree


