Special Diagnostic Procedures
Echocardiography
In the book and movie The Hunt for Red October, each side found the other’s submarines underwater by bouncing sound waves off them. The same principle is used in modern medical diagnosis: sound waves of a certain frequency are projected through part of the body. When the sound waves are reflected off certain organs or tissues, these reflections (or echoes) form a pattern that can be recognized. It’s possible to see a fetus in the uterus, outline gallstones, and detect abnormalities in the shape and size of many organs.
Echocardiography uses this technique to outline the structures of the heart. In addition, the echoes give a continuing picture so that the moving, beating heart can be seen and its motion analyzed.
There are two methods of displaying the echocardiogram. The older method, called M-mode display, gives a view through one narrow segment of the heart—the “icepick” view (Fig. 24-1).
Later the two-dimensional (or 2-D) method was developed. With the aid of computers, an image of the heart can be projected as if it were a motion picture (Fig. 24-2).
Speed of blood flow within the heart can be calculated by the Doppler phenomenon: reflected sound waves from red blood cells moving toward and away from a particular spot are recorded and the speed of blood flow through that area can be measured. Blood will move abnormally fast through a narrowed area—such as a stenotic aortic valve—and by measuring the speed above and below the valve, it’s possible to calculate the exact degree of narrowing. Abnormal motion of blood, such as the backward flow when valves leak, can also be detected. The Doppler probe is shown in Figure 24-3.
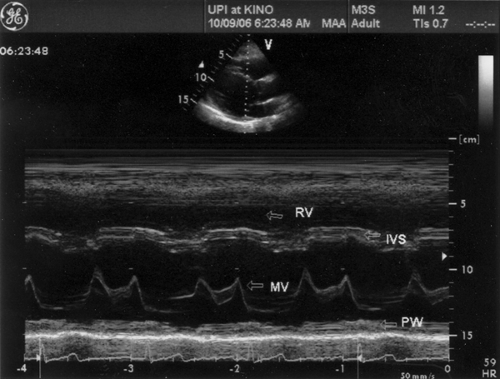 FIGURE 24-1 M-mode echocardiogram. This was the earliest form of echo recording. A narrow beam is directed down through the heart and successive beats are recorded. From the top down: the anterior wall of the right ventricle (RV), the right ventricular cavity, the interventricular septum (IVS), the anterior and posterior leaflets of the mitral valve, and the posterior ventricular wall (PW). (Courtesy of Migvel Acosta, Chief Technologist, heart lab, University/Kino Hospital.) |
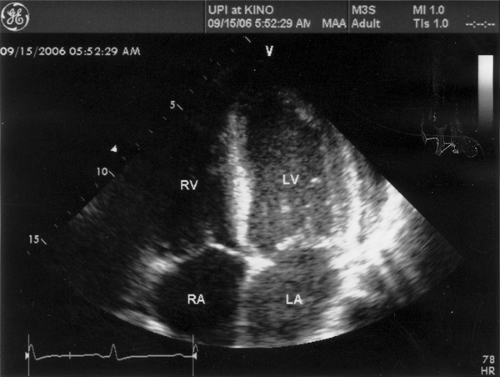 FIGURE 24-2 2-D or two-dimensional echocardiogram. The heart is shown upside down and backward. RV = right ventricle, LV = left ventricle, RA = right atrium, LA = left atrium. The left-sided chambers are clearly defined with a cloudy mass of echo-generating material (Optison) that has been injected in a vein and is now moving through the heart. (Courtesy of Migvel Acosta, Chief Technologist, heart lab, University/Kino Hospital.)
Stay updated, free articles. Join our Telegram channel
Full access? Get Clinical Tree
 Get Clinical Tree app for offline access

|