Although recent studies showed the prognostic value of cardiac magnetic resonance (CMR) parameters especially microvascular obstruction (MO) after reperfused ST-elevation myocardial infarction (STEMI), a study assessing their prognostic significance for long-term follow-up is missing so far. The objective of this study was to determine the prognostic impact of MO on long-term prognosis after reperfused first STEMI in a setting allocating CMR-assessed parameters to hard clinical events only. In 249 patients, CMR was performed after reperfused STEMI, and hereby, left ventricular ejection fraction (LVEF), infarct size (IS), and the amount of MO were quantified. Follow-up (median 6.0 years) was obtained regarding occurrence of major adverse cardiac events (MACE). MACE occurred more often in patients showing presence of MO (MO vs no MO: n = 61 [54%] vs n = 12 [9%], p <0.0001). By multivariate analysis, the extent of MO remained the strongest predictor (p <0.001) for occurrence of MACE and provided incremental prognostic value over clinical variables and LVEF (p = 0.028, c-index increase from 0.723 to 0.817). In conclusion, CMR-assessed MO proves predictive for assessment of 6-year prognosis in patients after reperfused first STEMI and provides incremental prognostic information over clinical variables and LVEF in a setting based on hard end points.
Precise risk stratification after ST-elevation myocardial infarction (STEMI) remains clinically challenging because selection for specific treatment as implantation of cardioverter-defibrillators is crucial for patient’s survival. The established parameter for that respect is left ventricular ejection fraction (LVEF) determined by noninvasive techniques as echocardiography or nuclear studies. Although LVEF proved highly useful in comprehensive trials, risk assessment in clinical practice remains suboptimal, and there is the need for further predictors of outcome after myocardial infarction. With the advent of contrast-enhanced cardiac magnetic resonance (CMR), a highly detailed characterization of the presence and extent of myocardial infarction became possible next to accurate assessment of LVEF and ventricular volumes. First studies gave evidence of an association between CMR-assessed infarct size (IS) and patients’ outcome after STEMI. Especially, microvascular obstruction (MO) provided incremental prognostic information in addition to clinical risk scores and LVEF as shown by recent multicenter studies. However, a study to assess the prognostic significance of MO for long-term follow-up after STEMI is missing so far. The objectives of the present study were, at first, to assess the impact of MO on long-term (6 year) prognosis in patients after a reperfused first STEMI, and secondly, to incorporate a setting which allocates CMR-assessed parameters only to hard clinical events.
Methods
Consecutive patients who presented with a first STEMI at our institution and underwent reperfusion by primary percutaneous coronary intervention were enrolled from July 2003 to July 2007; 249 of them fulfilled inclusion criteria, gave informed consent, and underwent CMR during index hospitalization. Inclusion criteria were the presence of symptoms <12 hours and ST-segment elevation of at least 0.1 mV in ≥2 limb leads or at least 0.2 mV in ≥2 precordial leads. Exclusion criteria were previous myocardial infarction, fibrinolysis before percutaneous coronary intervention, hemodynamic instability, and contraindications to CMR (MR-incompatible implants, severe claustrophobia, allergy to gadolinium, severe renal insufficiency with creatinine clearance <30 ml/min). Medical history was obtained before CMR examination. The protocol was approved by the institutional review committee. All patients gave written informed consent.
Reperfusion of the infarct-related artery was performed by primary percutaneous coronary intervention with routine usage of stents and IIb/IIIa inhibitors. Before percutaneous coronary intervention, all patients received 500 mg of aspirin and heparin (60 U/kg body weight) intravenously. A loading dose of 300 mg of clopidogrel and subsequently 75 mg for 12 months, and aspirin indefinitely, was mandatory. Flow within the infarct-related artery was graded according to the standard Thrombolysis in Myocardial Infarction (TIMI) criteria by an experienced observer blinded to clinical and CMR results. After reperfusion therapy, medical therapy was administered according to current guidelines.
Patients were examined in supine position using a 1.5T scanner (Sonata or Avanto; Siemens, Erlangen, Germany). Imaging was performed during breath-hold and was gated to the electrocardiography. Cine images were acquired in contiguous short-axis views covering the left ventricle from the base to the apex and additional 3 long-axis views using a steady-state free precession sequence (repetition time/echo time, 3.0/1.5 ms; slice thickness, 8 mm; flip angle, 60°). Then, late gadolinium enhancement images were acquired 10 to 15 minutes after injection of 0.15 mmol/kg of gadopentetate dimeglumine (Magnevist; Schering, Berlin, Germany) using a segmented inversion recovery Turbo FLASH sequence (repetition time/echo time, 3.3/1.4 ms; slice thickness, 8 mm; matrix, 128 × 256; field of view, 450 mm; flip angle, 60°for Sonata scanner; and repetition time/echo time, 4.0/1.5 ms; slice thickness, 8 mm; matrix, 176 × 256; field of view, 340 mm; flip angle, 30° for Avanto scanner) in the same views as used for cine studies ( Figure 1 ). Excitation was every second heartbeat, inversion time was individually adjusted to null normal myocardium (typical range 220 to 360 ms).
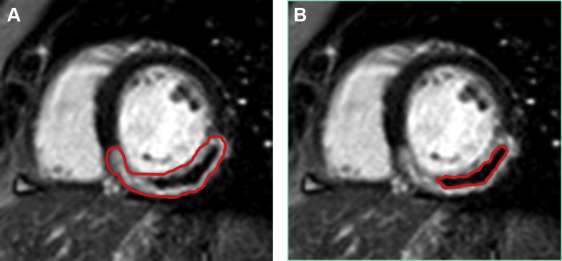
All images were reviewed offline and analyzed using the public domain NIH Image version 1.62 (US. National Institutes of Health; available at rsb.info.nih.gov/nih-image ) program. LVEF and left ventricular mass were determined as previously described. IS and the amount of MO were quantified by planimetry as previously shown. Enhancement was defined using a threshold of 5 standard deviations above the signal intensity of normal myocardium as proposed by current recommendations. MO was considered as an area of low signal intensity surrounded by enhanced myocardium. The extent of MO was included for quantification of IS. The defects were delineated manually, and, the IS, respectively, MO was normalized as a percentage of the total left ventricular mass (percent LV) ( Figure 1 ). Cine and delayed enhancement images were analyzed blinded to each other, and the experienced reader was not aware of clinical and angiographic data.
Patients were followed using a standard questionnaire by telephone contacts and clinical visits regarding occurrence of major adverse cardiac events (MACE). The follow-up interviewer was not aware of clinical and CMR results. Primary end point was a composite of death and admission either for nonfatal myocardial reinfarction or for congestive heart failure. Secondary end points were the individual end points of the composite primary end point. At follow-up, recurrent myocardial infarction was defined as any new ischemic event accompanied by elevated troponin. New-onset heart failure was defined as any congestive heart failure requiring hospital admission. When a patient experienced more than one event, the first one was chosen. Outcome was assessed by a clinical events committee unaware of CMR results.
Continuous data were expressed as mean ± standard deviation and were compared by unpaired t test or Mann-Whitney U test, where appropriate. Proportions were compared by the chi-square statistic; the Fisher’s exact test was used when appropriate. Survival distributions were estimated by the Kaplan-Meier method and compared by the log-rank test. A receiver operating characteristic curve to determine the best cut-off value for prediction of MACE was performed. Hazard ratios with the corresponding 95% confidence intervals were assessed. The association of variables with MACE was analyzed with univariate and stepwise multivariate Cox regression. Only variables with a p value ≤0.05 in univariate Cox models were included in the stepwise process for multivariate regression. The incremental prognostic value of CMR-assessed parameters LVEF, IS, and MO for prognostication of MACE was analyzed with C-statistics. Results of these C-statistics were compared by the method of DeLong et al. Statistical significance was considered for p <0.05. All statistical analyses were conducted with R: A Language and Environment for Statistical Computing version 2.13.0 (R Development Core Team, Vienna, Austria, 2011, available at R-project.org/ ).
Results
In 249 patients, CMR was performed 3.7 ± 1.8 days (range 3 to 7) after reperfused first STEMI.
Baseline characteristics of the patient group, angiographic findings, procedural data, and their relation to the presence of MO are reported in Table 1 .
| Variable | All patients (n = 249) | Microvascular Obstruction | P -value | |
|---|---|---|---|---|
| Absent (n = 137) | Present (n = 112) | |||
| Age (years) | 58.7 ± 11.4 | 59.5 ± 11.7 | 57.7 ± 11.09 | 0.44 |
| Men | 82.4% | 79.5% | 85.7% | 0.44 |
| Hypertension | 71.6% | 66.7% | 77.1% | 0.22 |
| Diabetes mellitus | 21.6% | 10.3% | 34.3% | 0.001 |
| Hypercholesterolemia | 75.7% | 76.9% | 74.3% | 0.86 |
| Familiar history of CAD | 41.9% | 41.0% | 42.9% | 0.99 |
| TIMI risk score | 3 (2-6) | 3 (2-5) | 5 (3-7) | 0.04 |
| Angiographic findings | ||||
| Number of narrowed coronary arteries | 0.03 | |||
| 1 | 48.7% | 59.0% | 37.1% | |
| 2 | 37.8% | 30.8% | 45.7% | |
| 3 | 13.5% | 10.3% | 17.1% | |
| TIMI flow before PCI | 0.42 | |||
| 0 | 56.8% | 59.0% | 54.3% | |
| 1 | 14.9% | 18.0% | 11.4% | |
| 2 | 9.5% | 7.7% | 11.4% | |
| 3 | 18.9% | 15.4% | 22.9% | |
| TIMI flow post PCI | 0.04 | |||
| 0 | 10.8% | 7.7% | 14.3% | |
| 1 | 10.8% | 10.3% | 11.4% | |
| 2 | 10.8% | 5.1% | 17.1% | |
| 3 | 67.6% | 76.9% | 57.1% | |
| Peak creatine kinase (mg/dl) | 3050 ± 2599 | 2066 ± 1975 | 4147 ± 2780 | < 0.0001 |
| Door-to-balloon time (min) | 35 (25-49) | 34 (24-46) | 37 (25-49) | 0.31 |
| ST-segment-resolution (%) | 51 (20-76) | 50 (21-73) | 35 (14-69) | 0.04 |
As for CMR results, mean IS was 15.3 ± 9.8% LV and mean LVEF 45.2 ± 11.4% in the study group. One hundred twelve patients (45%) showed presence of MO, and 137 (55%) showed absence of MO. In MO-positive patients, mean MO size was 5.6 ± 7.3% LV. Patients who showed presence of MO had significantly larger infarcts (MO vs no MO: 20.5 ± 9.5% versus 10.5 ± 7.4% LV, p <0.0001), and more pronounced LVEF reduction (MO vs no MO: 40.1 ± 9.0% vs 49.8 ± 11.5% LV, p <0.0001).
Patients clinical follow-up was conducted at a median of 6.0 years (range 4.1 to 7.6). Seventy-three MACE including 30 deaths, 31 nonfatal reinfarctions, and 22 readmissions due to congestive heart failure occurred. MACE occurred more often in patients showing presence of MO (MO vs no MO: n = 61 [54%] vs n = 12 [9%], p <0.0001). In the patient group showing presence of MO, 26 deaths occurred as opposed to 4 deaths in patients without MO (p <0.0001). There were 27 nonfatal reinfarctions in patients with MO and 4 in patients without presence of MO (p <0.0001). Eighteen patients showing presence of MO and 4 patients without MO were readmitted because of congestive heart failure (p = 0.0006).
Concerning prediction of MACE, univariate and stepwise multivariate Cox regression analysis was performed. CMR parameters MO, IS, and LVEF, next to clinical markers TIMI risk score, peak creatine kinase, gender, and extent of coronary artery disease demonstrated the strongest association; Table 2 lists all univariate predictors of MACE with p ≤0.05. In multivariate analysis, only TIMI risk score (p = 0.04) and MO >1.9% LV (p = 0.002) were established as independent predictors ( Table 2 ). Figure 2 illustrates Kaplan–Meier plots for event-free survival stratified by LVEF, IS and MO, with presence of MO showing the highest level of significance.
Stay updated, free articles. Join our Telegram channel

Full access? Get Clinical Tree


