Pericardial effusion (PE) is a common complication following ST-elevation myocardial infarction (STEMI). However, the frequency and prognostic relevance of PE complicating STEMI are unknown. Aim of this study was to investigate the exact incidence, infarct characteristics, and the prognostic impact of moderate-to-large PEs detected by cardiac magnetic resonance (CMR) in patients with acute reperfused STEMI. In total, 780 patients with STEMI reperfused by angioplasty (<12 hours after symptom onset) were enrolled in this CMR study at 8 centers. CMR was completed in median 3 days after infarction using a standardized protocol. Central core laboratory-masked analysis for the presence of moderate-to-large PE was performed. The primary clinical end point was the occurrence of major adverse cardiac events (MACE) defined as composite of all-cause death, reinfarction, and new congestive heart failure within 12 months after the index event. A moderate-to-large PE was detected in 183 patients (24%). Patients with moderate-to-large PEs had significantly larger infarcts, less myocardial salvage, a larger extent of microvascular obstruction, higher incidence of intramyocardial hemorrhage, and more pronounced left ventricular dysfunction (p <0.001 for all). Significant predictors of a moderate-to-large PE were age, Thrombolysis in Myocardial Infarction flow before percutaneous coronary intervention, and infarct size. MACE rates were significantly higher in the PE group (p = 0.003) and a moderate-to-large PE was identified as a significant independent predictor for MACE (hazard ratio 3.12, 95% confidence interval 1.49 to 6.81; p = 0.003) together with Thrombolysis in Myocardial Infarction risk score and left ventricular ejection fraction. In conclusion, a moderate-to-large PE complicating STEMI is a common finding (almost 25%) and related to more severe infarcts with subsequent significantly increased MACE rates during 1-year follow-up. Consequently, a moderate-to-large PE is a marker of poor outcome in patients with STEMI.
Pericardial effusion (PE) without tamponade is a common complication after myocardial infarction (MI) with reported incidences from 6% to 43% depending on the definition used. Most PEs complicating ST-elevation MI (STEMI) develop within the first week after MI and are mild to moderate in size. Moreover, accumulating evidence indicates that the presence of PE after STEMI is associated with poor prognosis. However, because most previous studies were performed before primary percutaneous coronary intervention (PCI) became clinical routine, the prevalence and prognostic significance of PE complicating STEMI in a contemporary population is unknown. Echocardiography is the first-line modality for evaluation of PE. However, echocardiography is user dependent, often hampered by poor acoustic window, and is limited in its ability to detect focal PEs. Cardiac magnetic resonance (CMR) imaging is superior to echocardiography for the detection of PE and has emerged as the reference standard for the assessment of presence, severity, and extent of PEs. To the best of our knowledge, no study investigated the frequency and prognostic relevance of CMR-detected PEs in patients with STEMI treated by primary PCI. Aim of our study was therefore to investigate the exact incidence, infarct characteristics, and the prognostic impact of CMR-detected PE in patients with acute reperfused STEMI.
Methods
This prospective CMR study was a predefined substudy of the Abciximab Intracoronary versus intravenously Drug Application in STEMI (AIDA STEMI) trial, which compared intravenous versus intracoronary abciximab application in patients with STEMI and did not show a difference in infarct size, reperfusion injury, and clinical outcome between the treatment groups. The detailed design and main results of the trial have previously been published. The study was approved by national regulatory authorities and ethics committees of participating centers. All patients provided written informed consent.
Consecutive patients enrolled in the AIDA STEMI trial at 8 sites were included in the CMR substudy. The sites were chosen on the basis of proven expertise in performing CMR examinations in patients with MI. By protocol, CMR was performed on days 1 to 10 after the index event. Exclusion criteria were the typical contraindications for CMR as described previously together with the detailed scan protocol. CMR images were sent to the CMR core laboratory for blinded assessment. Certified CMR evaluation software was used (cmr 42 ; Circle Cardiovascular Imaging Inc, Calgary, Alberta, Canada), and all analyses were done according to standard definitions as previously described.
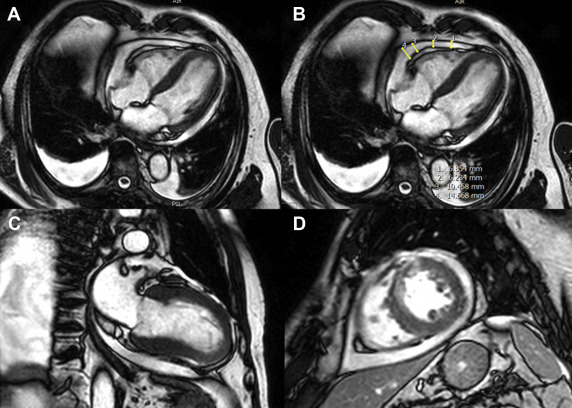
A moderate-to-large PE was defined as a collection of fluid of ≥5 mm in the end-diastolic phase in the short-axis and corresponding 2- and 4-chamber views of the cine steady state free precision sequences ( Figure 1 ). The CMR core laboratory is highly experienced in CMR postinfarction acquisition and postprocessing with excellent reproducibility and low interobserver and intraobserver variability.
The primary clinical end point major adverse cardiovascular event (MACE) was a composite of all-cause death, reinfarction, and new congestive heart failure within 1 year after infarction, using outcome definitions described previously. All components of the combined clinical end point were adjudicated by a clinical end point committee, blinded to the patient’s assigned treatment, on the basis of data provided by the clinical trial sites. To avoid double counting of patients with more than 1 event, every patient could be counted only once for the primary clinical end point. Consequently, for those subjects who had more than 1 type of event at the same time, the more severe event was counted according to a hierarchical order (death > reinfarction > congestive heart failure).
Baseline patient characteristics, procedural details, and CMR findings are described according to the presence or absence of a moderate-to-large PE. Data for continuous variables are presented as medians with interquartile range (IQR). Categorical variables are presented as frequencies and percentages. Differences between groups were assessed by Fisher’s exact and by the Wilcoxon rank-sum test for categorical and continuous data, respectively. To identify predictors for a moderate-to-large PE and MACE, stepwise multivariate logistic and Cox regression analyses were performed, respectively, after univariate preselection of candidate predictors. The inclusion criterion for stepwise multivariate analysis was a p <0.05 in univariate analysis. For univariate preselection, all variables of Tables 1 and 2 were considered. To improve the ratio of events per variable, the Thrombolysis in Myocardial Infarction (TIMI) risk score and not its single variables was considered for Cox regression analysis. Because the myocardial salvage index accounts for infarct size by its inclusion in the formula for calculation of myocardial salvage, we also discarded the myocardial salvage index. Hazard ratios (HR) and odds ratios (OR) with 95% confidence intervals (CI) were calculated for univariate and multivariate analyses as appropriate. Rates for MACE and all-cause mortality were plotted and compared by means of Kaplan–Meier curves and log-rank test, respectively. A 2-tailed p value <0.05 was defined as statistically significant. SPSS version 20.0 was used for statistical analyses.
| Variable | Total study | Pericardial effusion | P | |
|---|---|---|---|---|
| N=780 | <5 mm n=597 | ≥5 mm n=183 | ||
| Age (years) | 62 (51-71) | 61 (51-70) | 64 (53-74) | 0.005 |
| Men | 594/780 (76%) | 455/597 (76%) | 139/183 (76%) | >0.99 |
| Current smoker | 336/713 (47%) | 280/555 (50%) | 56/158 (35%) | <0.001 |
| Hypertension ∗ | 530/778 (68%) | 398/595 (67%) | 132/183 (72%) | 0.20 |
| Hypercholesterolemia † | 297/772 (38%) | 218/590 (37%) | 79/182 (43%) | 0.14 |
| Diabetes mellitus | 156/777 (20%) | 110/594 (19%) | 46/183 (25%) | 0.06 |
| Body mass index (kg/m 2 ) | 27.4 (24.9-30.3) | 27.4 (24.8-30.3) | 27.1 (24.9-30.7) | 0.96 |
| Previous infarction | 47/780 (6%) | 41/597 (7%) | 6/183 (3%) | 0.08 |
| Anterior infarction | 358/745 (48%) | 259/567 (46%) | 99/178 (56%) | 0.03 |
| Times | ||||
| Symptom-onset to PCI hospital admission (minutes) | 180 (109-310) | 180 (105-310) | 184 (114-309) | 0.71 |
| Door-to-balloon-time (minutes) | 30 (22-42) | 30 (22-43) | 29 (22-40) | 0.40 |
| Reperfusion >3h | 6/777 (1%) | 5/594 (1%) | 1/183 (1%) | >0.99 |
| Killip-class on admission | 0.08 | |||
| I | 686/780 (88%) | 533/597 (89%) | 153/183 (84%) | |
| II | 59/780 (8%) | 40/597 (7%) | 19/183 (10%) | |
| III | 19/780 (2%) | 11/597 (2%) | 8/183 (4%) | |
| IV | 16/780 (2%) | 13/597 (2%) | 3/183 (2%) | |
| Number narrowed coronary artery vessels | 0.88 | |||
| 1 | 413/780 (53%) | 318/597 (53%) | 95/183 (52%) | |
| 2 | 222/780 (28%) | 170/597 (29%) | 52/183 (28%) | |
| 3 | 144/780 (18%) | 108/597 (18%) | 36/183 (20%) | |
| Infarct related artery | <0.001 | |||
| Left anterior descending | 342/780 (44%) | 246/597 (41%) | 96/183 (52%) | |
| Left circumflex | 92/780 (12%) | 62/597 (10%) | 30/183 (16%) | |
| Right | 339/780 (43%) | 282/597 (47%) | 57/183 (31%) | |
| Left main | 5/780 (1%) | 5/597 (1%) | 0/183 (0%) | |
| Bypass graft | 2/780 (0%) | 2/597 (0%) | 0/183 (0%) | |
| TIMI-flow before PCI | 0.09 | |||
| TIMI-flow 0 | 435/780 (56%) | 321/597 (54%) | 114/183 (62%) | |
| TIMI-flow I | 103/780 (13%) | 77/597 (13%) | 26/183 (14%) | |
| TIMI-flow II | 127/780 (16%) | 103/597 (17%) | 24/183 (13%) | |
| TIMI-flow III | 115/780 (15%) | 96/597 (16%) | 19/183 (10%) | |
| Stent implanted | 763/778 (98%) | 583/595 (98%) | 180/183 (98%) | >0.99 |
| Thrombectomy | 187/780 (24%) | 148/597 (25%) | 39/183 (21%) | 0.37 |
| Intraaortic balloon pump | 34/780 (4%) | 21/597 (4%) | 13/183 (7%) | 0.06 |
| TIMI-flow after PCI | 0.09 | |||
| TIMI-flow 0 | 12/780 (2%) | 9/597 (2%) | 3/183 (2%) | |
| TIMI-flow I | 19/780 (2%) | 12/597 (2%) | 7/183 (4%) | |
| TIMI-flow II | 59/780 (8%) | 39/597 (7%) | 20/183 (11%) | |
| TIMI-flow III | 689/780 (88%) | 537/597 (90%) | 152/183 (84%) | |
| TIMI risk score | 3 (2-5) | 3 (2-5) | 4 (2-5) | 0.02 |
| Peak CK (μmol/l×s) | 26 (12-45) | 25 (11-43) | 31 (17-55) | 0.001 |
| ST-segment resolution after 90 min (%) | 54 (21-77) | 57 (21-78) | 48 (25-76) | 0.57 |
| Concomitant medications | ||||
| ß-blockers | 745/778 (96%) | 566/596 (95%) | 179/182 (98%) | 0.06 |
| ACE-inhibitors/AT-1-antagonist | 739/778 (95%) | 564/596 (95%) | 175/182 (96%) | 0.56 |
| Aspirin | 780/780 (100%) | 597/597 (100%) | 183/183 (100%) | >0.99 |
| Clopidogrel, prasugrel or both | 760/760 (100%) | 584/584 (100%) | 176/176 (100%) | >0.99 |
| Statins | 740/778 (95%) | 562/596 (94%) | 178/182 (98%) | 0.07 |
| Aldosterone antagonist | 91/778 (12%) | 67/596 (11%) | 24/182 (13%) | 0.51 |
| Completion of abciximab | 739/780 (95%) | 567/597 (95%) | 172/183 (94%) | >0.99 |
∗ Hypertension was diagnosed if patients were on antihypertensive treatment or had ≥3 systolic blood pressure values >140 mm Hg on at least two different days.
† Hypercholesterolemia was diagnosed if patients were on cholesterol lowering medication or their serum total cholesterol was ≥200 mg/dl.
| Characteristic | Total study | Pericardial effusion | P | |
|---|---|---|---|---|
| (n=780) | <5 mm (n=597) | ≥5 mm (n=183) | ||
| Area at risk (%LV) | 35 (25-48) | 34 (24-47) | 39 (28-49) | 0.01 |
| Infarct size (%LV) | 17 (8-25) | 15 (7-24) | 21 (15-29) | <0.001 |
| Myocardial salvage index | 51 (33-69) | 54 (35-75) | 44 (23-59) | <0.001 |
| Late MO (%LV) | 0.0 (0.0-1.7) | 0.0 (0.0-1.4) | 0.9 (0.0-2.9) | <0.001 |
| Hypointense core (%LV) | 0.0 (0.0-1.7) | 0.0 (0.0-1.2) | 0.0 (0.0-3.4) | <0.001 |
| Hypointense core present | 238/689 (35%) | 167/528 (32%) | 71/161 (44%) | 0.004 |
| LV ejection fraction (%) | 50 (43-58) | 51 (44-58) | 48 (41-55) | <0.001 |
| LV enddiastolic volume (ml) | 146 (120-173) | 146 (120-173) | 146 (123-172) | 0.79 |
| LV endsystolic volume (ml) | 72 (54-91) | 72 (54-89) | 75 (56-99) | 0.03 |
Stay updated, free articles. Join our Telegram channel

Full access? Get Clinical Tree


