3 Sensing and Detection
 Electrograms
Surface Electrocardiogram vs. Intracardiac Electrogram
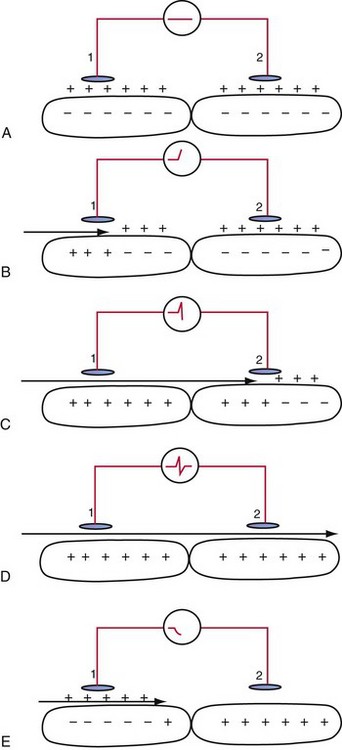
An electrogram (EGM) is a graphic display of the potential difference between two points in space over time. During the upstroke of a myocardial action potential, the inside of the cell abruptly changes from its resting negative potential (with respect to the outside of the cell) to a neutral or slightly positive potential. After about 250 to 400 milliseconds (msec), the cell membrane is then repolarized, with the inside of the cell returning to its resting, negatively charged state. Figure 3-1 illustrates how an EGM is recorded between two electrodes in contact with the myocardium.
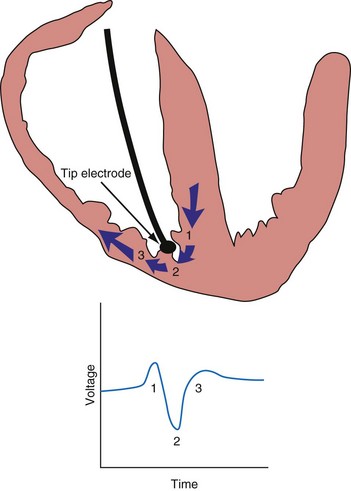
The electrocardiogram (ECG) is recorded from two electrodes on the surface of the body at some distance from the heart. The typical amplitude of its QRS complex is about 1 millivolt (mV). The locations of the two electrodes determine the vectorial “viewpoint” from which the electrical activity of the entire heart is observed from the body surface. In contrast, the ventricular endocardial unipolar EGM typically is 5 to 20 mV in amplitude when recorded from a small electrode on the tip of a lead placed in direct contact with the apex of the right ventricle (Fig. 3-2). The second electrode needed to record this unipolar EGM is the pacemaker or ICD metal “can,” which is located some distance from the heart. The location of this distant second electrode, sometimes called the “indifferent electrode,” has a much smaller effect on the signal’s properties, although it may record noncardiac electric potentials (e.g., from pectoral muscle). The ECG records electrical activity from the entire heart, whereas the EGM records only local wavefronts of depolarization and repolarization. The EGM depends on the viability of approximately 1 or 2 cm3 of myocardium immediately under the tip electrode,1,2 as depicted in Figure 3-2.
Electrode Systems
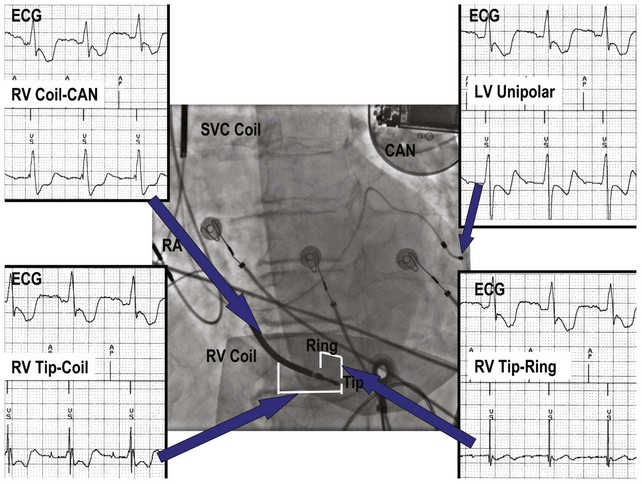
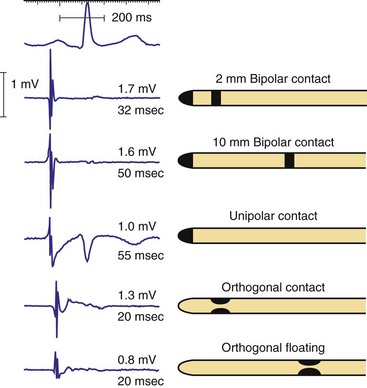
Figure 3-3 contrasts endocardial unipolar (tip-to-can), bipolar (tip-to-ring), and integrated bipolar (tip-to-coil) electrode systems, and Figure 3-4 shows representative examples. Epicardial electrode systems may be either unipolar (tip-to-can) or bipolar (tip-to-tip). These different electrode configurations have EGMs with similar R-wave amplitudes and slew rates, provided that the interelectrode spacing is at least 10 mm, as is true of almost all commercial pacemaker and defibrillator leads. Because they are more likely to oversense than bipolar EGMs, unipolar electrode systems are contraindicated for ICDs and are used infrequently for modern pacemakers. ICD integrated bipolar electrodes sense between the right ventricular tip electrode and right ventricular high-voltage coil, with sensing characteristics closer to the bipolar than the unipolar configuration. Compared with true bipolar electrodes, integrated ICD bipolar electrodes are more likely to oversense myopotentials and electromagnetic interference (EMI).3,4 In one study, oversensing occurred in 40% of patients with integrated bipolar sensing, compared with 8% of patients with true bipolar systems.4
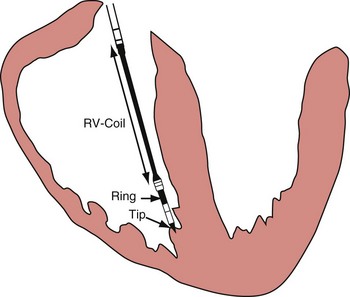
Figure 3-3 The three practical endocardial electrode configurations used by most pacemakers and ICDs.
The distant and indifferent or “can” electrode is not shown because it is out of the field of view. The unipolar configuration used in Figure 3-1 to explain EGM formation simply records the signal between the tip electrode and the can. The tip electrode can be an active-fixation screw or a small-surface-area tip electrode with various geometries. This unipolar configuration is subject to considerable noise and interference signals and is not suitable for ICDs. The bipolar configuration uses the Tip and Ring electrodes shown in this figure. The interelectrode spacing is typically 12 to 15 mm, and the ring electrode may or may not make contact with the endocardium. The integrated bipolar configuration uses the Tip and RV-Coil electrodes shown in the figure. EGMs recorded from bipolar and integrated bipolar configurations are very similar, and one less conductor is needed for the integrated bipolar configuration. The main disadvantages of the integrated bipolar configuration are susceptibility to diaphragmatic myopotentials, undesired atrial EGMs in small hearts, and slower postshock recovery times caused by electrode polarization. RV, Right ventricular.
Amplitude, Slew Rate, and Waveshape
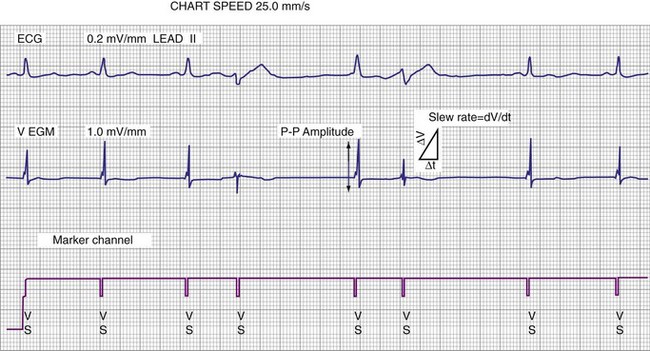
The largest and steepest deflection on the local EGM, called the intrinsic deflection, occurs when the wavefront of depolarization passes the small-tip electrode. The EGM amplitude traditionally is defined as the peak-to-peak amplitude of the intrinsic deflection (measured in mV), as shown in Figure 3-5. The duration of a ventricular EGM usually is less than that of the QRS of the surface ECG, because the EGM is a local signal. The amplitude of an atrial electrogram (AEGM) or ventricular electrogram (VEGM) is determined primarily by the excitable tissue near the tip electrode and therefore is usually similar for unipolar and bipolar signals. Typical amplitudes are 5 to 30 mV for VEGMs and 1.5 to 6 mV for AEGMs.1,2,5
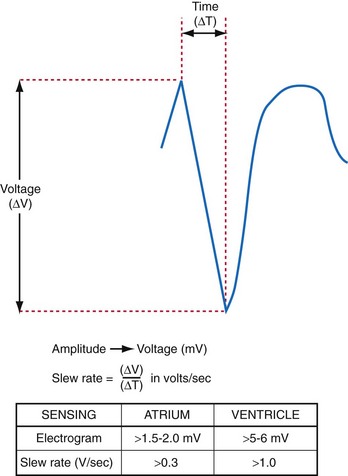
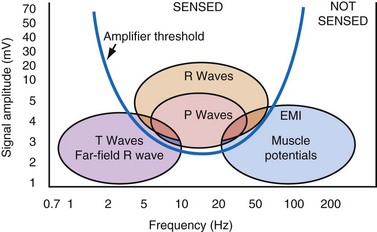
The maximum slope of the intrinsic deflection is the slew rate, measured in volts per second, which represents the maximum rate of change of EGM voltage. Mathematically, it is the first derivative of the voltage, dV/dt, so it depends on both the amplitude and the duration of the EGM, and it provides a crude representation of the frequency content. The frequency content of ventricular and atrial EGMs is similar and in the range of 5 to 50 Hz. T waves and far-field R waves have lower frequency content, whereas most myopotentials and EMI have higher frequency content (Fig. 3-6). Typical values for slew rates are 2 to 3 V/sec for VEGMs and 1 to 2 V/sec for AEGMs.3,4 Usually, an EGM with acceptable amplitude also has an acceptable minimum slew rate (>1 V/sec for VEGMs, >0.3 V/sec for AEGMs). EGMs with very low amplitude will not be sensed, regardless of the slew rate.
Increasing the size of the tip electrode in the range of 2 to 10 millimeters (mm) has minimal effect on atrial EGM amplitude but increases EGM duration (Fig. 3-7). For short ventricular bipolar interelectrode spacing of 5 mm or less, the R-wave amplitude decreases, because the difference between the two unipolar EGMs from each electrode causes cancellation in the net bipolar signal. The slew rate increases, because the time between arrival of the wavefront at the two electrodes decreases more than the EGM amplitude. When two electrodes are widely separated, as in early Y-adapted cardiac resynchronization electrode systems, two distinct intrinsic deflections may be recorded on the EGM—one representing right ventricular (RV) activation and the other left ventricular (LV) activation. The interval between these deflections is determined by the conduction delay between the ventricles near the two electrodes.
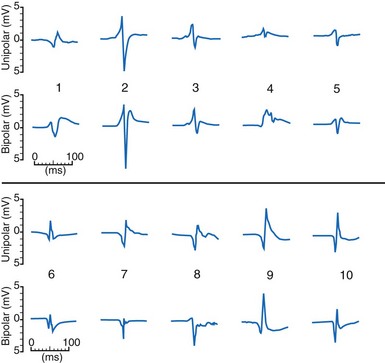
The waveshapes of EGMs are quite variable (Fig. 3-8), probably because geometry of the trabecular endocardium adjacent to the tip electrode is complex. In one study at pacemaker lead implantation, 58% of unipolar EGMs were biphasic, with an initial upstroke followed by a roughly equal downstroke; 30% were predominantly monophasic negative, and 12% were predominantly monophasic positive.1
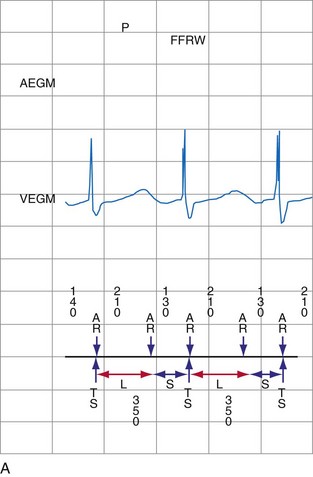
The ventricular depolarization recorded on the atrial electrode is referred to as the far-field R wave (FFRW). Oversensing of the FFRW confounds interpretation of the atrial rhythm. The amplitude of the FFRW depends on the location of the atrial electrode. It is greatest near the septum, intermediate in the right atrial appendage, and least on the right atrial free wall. Even if the FFRW has comparable amplitude to the P wave, its slew rate usually is much lower. In one series, the mean slew rate was 1.2 V/sec for AEGMs and 0.13 V/sec for FFRWs.1
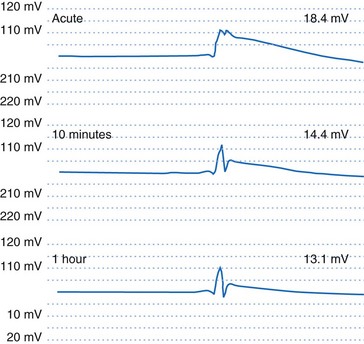
If an active-fixation, screw-in tip electrode is successfully attached to the myocardium, the acute VEGM has a current of injury, with an elevated ST segment (Fig. 3-9) that is usually greatly reduced within 10 minutes after electrode fixation. During this 10-minute period, the EGM amplitude and slew rate usually do not change despite changes in waveshape, but the pacing threshold decreases by an average of 40%.2
Acute to Chronic Changes and Fixation
The amplitude and slew rate of intracardiac EGMs typically decline during the first several days to weeks after lead implantation and then increase to chronic values that are slightly lower than those measured at implantation.6 The initial decrease in EGM amplitude is caused by the inflammatory response and edema at the electrode-tissue interface. This gradually resolves and is followed by development of a small, inexcitable fibrotic zone surrounding the electrode tip (Fig. 3-10). This inflammation and fibrotic tissue effectively increases the distance between the surface of the electrode and excitable myocardium that generates the EGM signal. Although chronic EGM amplitudes usually are reduced by less than 10% compared with acute amplitudes, chronic slew rates are reduced by 30% to 40%.7
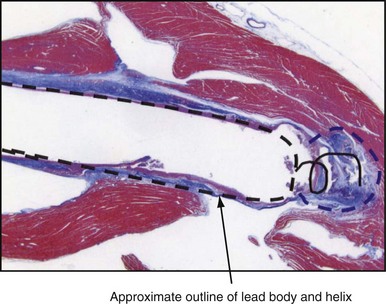
The large dotted line shows where the lead body was located, and the colored staining shows a thin, fibrotic sheath around the lead body. The approximate location of the helical screw-tip electrode is shown by the solid coiled line. The oval shape (dotted line) shows the size of the fibrotic capsule that formed around the helical extended-tip electrode. Most of the tissue outside the dotted lines stained red, indicating that it was active myocardium capable of conducting depolarizations. The tip region of this electrode is similar to that of the tip electrode in Figure 3-1, so propagation of depolarization wavefronts must travel around the tip electrode, in tissue largely out of the field of view on the right side of this figure.
The method of lead tip stabilization, active screw-in or passive tines, has had no significant effect on sensing characteristics in most studies.8,9 Steroid-eluting electrodes reduce chronic pacing thresholds substantially, but also have no significant effects on sensing.10–13
Metabolic, Ischemic, Aging, and Drug Effects
The effects of metabolic abnormalities and drugs on pacing thresholds are well described. Much less information is available concerning their effects on EGMs and sensing. Factors that reduce EGM amplitude, slow conduction velocity, or diminish slew rate may produce either oversensing or undersensing. By prolonging the intracardiac EGM duration beyond blanking periods, ischemia or antiarrhythmic drugs can produce double-counting of the QRS complex.14 Similarly, drugs that prolong the PR or QT interval beyond the refractory period may result in oversensing.15,16
Undersensing may result from reduction in EGM amplitude or slew rate after myocardial infarction at the electrode-tissue interface, from drug and electrolyte effects,15,16 or from progression of conduction system disease. Acute ischemia causes ST-segment changes that can be detected on VEGMs. Monitoring of EGM ST-segment shifts has been proposed as a method for monitoring ischemia for pacemakers and ICDs.17 The likelihood of recording abnormal AEGMs (defined as ≥100 msec in duration or having ≥8 fragmented deflections) correlates with age of the patient (r = 0.34; P < .0005).18
Exercise, Respiratory, and Postural Effects
The effect of exercise on the AEGM amplitude and slew rate is variable. Some studies have reported statistically significant decreases in amplitude that average 10% to 20% but may reach 40% in some patients.19,20 Other studies did not find significant changes between rest and exercise.21,22 Decreases in AEGM amplitude were not caused by atrial rate alone or by beta blockade.23 VDD/R lead studies with “floating” atrial electrodes showed particularly large decreases with exercise.24,25 Decreases in AEGM amplitude with lead maturation support the programming of a large safety margin for sensing at implantation to offset effects of lead maturation.
P-wave amplitude increases significantly during full inspiration, during full expiration, and with erect posture.22 Respiratory variation averaged 9.7% for unipolar AEGMs and 11.5% for bipolar AEGMs.25,26 The effect of respiration on VEGMs was less, especially with the unipolar configuration.26
Ventricular Electrograms during Premature Ventricular Complexes, Ventricular Tachycardia, and Ventricular Fibrillation
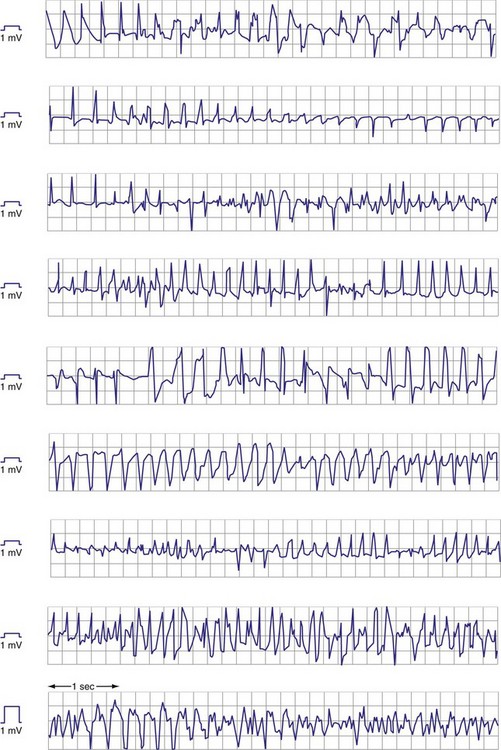
Premature ventricular complexes (PVCs) may have lower-amplitude R waves than sinus-rhythm R waves, as shown in Figure 3-11, but the reverse may also be true. For monomorphic ventricular tachycardia (VT), mean amplitude decreased only slightly from values in sinus rhythm—14% for epicardial EGMs and 5% for endocardial EGMs.27 In contrast, EGM amplitudes during ventricular fibrillation (VF) decreased by 25% for epicardial and 41% for endocardial EGMs. More importantly, EGMs in VF often have low, highly variable, and rapidly changing amplitudes and slew rates. Figure 3-12 shows endocardial spontaneous VF EGMs from different patients, illustrating variability in intrinsic deflections, amplitudes, slew rates, and morphologies. In a study of induced VF reproducibility, 50% of the variability was caused by interpatient differences and the other 50% occurred among repeated episodes in the same patient.28 In another study, the VEGM amplitude in VF was 1 mV or less in at least one VF episode in 29% of patients.27 If VF lasts for minutes, the amplitude and slew rate of the EGMs decrease.
Atrial Electrograms during Rhythms Other Than Sinus
Atrial activation from ectopic sites or atrial arrhythmias can alter the amplitude, frequency content, slew rate, and morphology of the AEGM. Retrograde atrial activation during ventricular pacing reduces AEGM amplitude and slew rate by up to 50%.29 These EGM changes are more pronounced in the high right atrium than in the right atrial appendage or low right atrium.30 The frequency content of the AEGM is not significantly altered by retrograde atrial activation.31 Analysis of EGM turning-point morphology or the first-differential coefficient of slew rate has been used to discriminate sinus EGMs from those recorded during retrograde and ectopic atrial activation in small groups of patients.32
Atrial EGMs during atrial fibrillation (AF) are characterized by extreme temporal and spatial variability. EGMs tend to be most organized in the trabeculated right atrial appendage and more disorganized in the smooth right atrium or coronary sinus.33–35 Thus electrode spacing and positioning of atrial leads influence EGM characteristics during AF36–38 and may cause inconsistent diagnosis of AF based on rate criteria.
The amplitude of chronic, unipolar pacemaker EGMs was 40% less in AF than in sinus rhythm.39 A comparison of acute AEGM amplitudes recorded with temporary pacing catheters showed that the mean sinus-rhythm EGM amplitude decreased only slightly in atrial flutter but decreased by about 50% in AF.35 Antiarrhythmic drugs may also interfere with sensing during AF by reducing atrial rate, median frequency, and EGM amplitude.40
Subcutaneous Electrocardiography
The subcutaneous ECG is similar to the surface ECG because the two subcutaneous electrodes are sufficiently distant from the heart that they record electrical activity from the entire heart. As with the surface ECG, the amplitude of subcutaneous ECG signals usually is 1 mV or less. Simultaneous recordings of subcutaneous ECG signals and surface ECG signals from electrodes placed directly over the subcutaneous locations have similar amplitude and signal-to-noise ratio.41 Practical implantation considerations usually limit the subcutaneous electrode separation distance to 4 to 8 cm, compared with the typical surface ECG limb lead electrode separation of 40 to 60 cm.
The orientation of the two subcutaneous electrodes relative to the heart can affect the amplitude of the signal recorded.42 Mapping studies on the chest skin with 4-cm electrode spacing in the range used by implantable loop recorders (ILRs) show larger intrinsic QRS amplitudes of 0.5 ± 0.1 mV for vertical orientation in the left parasternal zone and for horizontal orientation near the apex of the heart. Subcutaneous ECGs are used to detect arrhythmias in ILRs, to obviate the need for surface ECG electrodes during follow-up of pacemakers and ICDs, and to detect VT/VF in an ICD without intravascular electrodes.
 Sensing
General Concepts
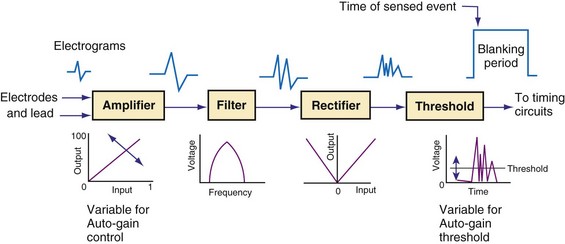
Figure 3-13 shows the primary functional operations of sensing systems used by pacemakers and ICDs. The raw signal passes from the leads to the connector, through hermetic feedthroughs with high-frequency filters and high-voltage protection circuitry, before reaching the sensing amplifier. After the signal is amplified, a band-pass filter processes it to reduce T waves, myopotentials, and EMI (filtering). Then, it is rectified to nullify effects of signal polarity (rectification). Finally, it is compared with the sensing-threshold voltage. At the instant the processed signal exceeds the sensing-threshold voltage, a sensed event is declared to the timing circuits and indicated by a marker pulse on the programmer marker channel. The sense amplifier in the same chamber is turned off or “blanked” for a short blanking period (20-250 msec) after each spontaneous depolarization or pacing stimulus, to prevent a single depolarization resulting in multiple sensed events. In the refractory period that follows the blanking period, the sense amplifier remains enabled. Sensed events occurring in refractory periods do not alter pacemaker timing cycles but may be sensed for tachyarrhythmia detection algorithms.
Blanking and Refractory Periods
Blanking periods and refractory periods are used to prevent undesirable behavior caused by oversensing or double-counting of cardiac activity (Figs. 3-14 and 3-15). The specifications of blanking/refractory periods have substantial impact on ICD sensing and pacing functions (Fig. 3-16). Same-chamber blanking/refractory periods after sensed events reduce double-counting of intrinsic cardiac depolarizations that may result in escape pacing at a rate slower than the programmed lower rate in pacemakers or inappropriate detection of VF in ICDs. After paced events, the same-chamber blanking/refractory periods are typically longer and prevent oversensing of the pacing artifact and evoked response. The blanking/refractory periods in the ventricle after atrial sensed or paced events and in the atrium after ventricular sensed or paced events are called cross-chamber blanking/refractory periods. Cross-chamber blanking periods help to prevent oversensing of the pacing artifact after a paced event in the opposite chamber.
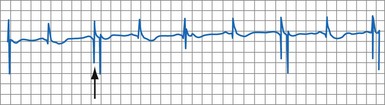
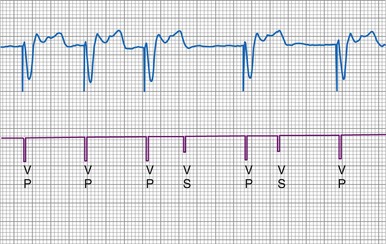
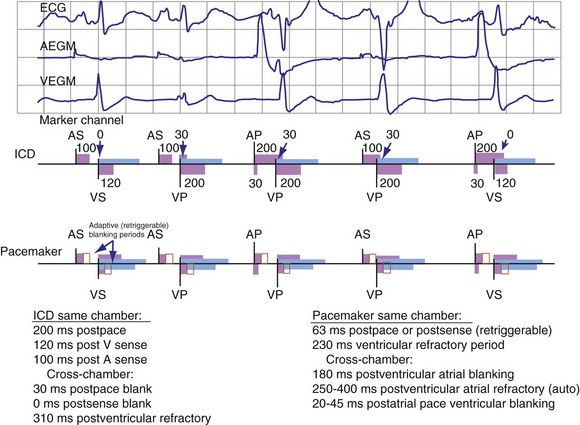
Figure 3-16 Basic blanking and refractory periods for DDDR mode (Medtronic Marquis DR ICD and EnPulse DR pacemakers).
Implantable cardioverter-defibrillators that require tachyarrhythmia detection typically have shorter blanking and refractory periods than standard pacemakers, so that short cardiac cycles can be sensed reliably. As shown in the bottom marker diagrams of Figure 3-16, blanking periods may be adaptively extended based on noise-sampling windows (30-60 msec) if suprathreshold activity (due to cardiac or extracardiac sources such as EMI) is identified on the EGM immediately after a sensed event. If noise is seen in consecutive windows after a sensed event, the blanking period is “retriggered” for that beat to avoid double-counting or continuous oversensing. This operation may result in paradoxical undersensing of the cardiac rhythm when more sensitive sensing levels are programmed if noise is oversensed.43,44
The duration of the total atrial refractory period (TARP), equal to the atrioventricular (AV) delay plus the PVARP, in DDD pacing modes limits atrial tracking of the atrium at high sinus rates without affecting atrial sensing, as shown in Figure 3-17. Because the AV delay of most dual-chamber pacemakers shortens in response to increasing atrial rates or sensor input, the TARP also shortens. Several manufacturers now offer dual-chamber pacemakers that shorten the PVARP with increasing atrial or sensor-indicated rates, further reducing the TARP during exercise. The result of these newer algorithms is that the programmed upper tracking rate can be safely increased while providing protection at lower heart rates from initiation of pacemaker-mediated tachycardia caused by retrograde conduction.
Sensing Thresholds in Pacemakers
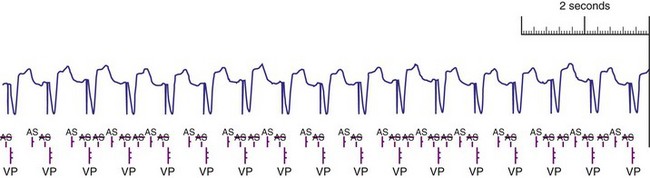
Unipolar sensing thresholds typically are set higher (less sensitive) than bipolar sensing thresholds to reduce oversensing of far-field cardiac and extracardiac signals that can lead to inappropriate pacemaker inhibition or tracking. Newer pacemakers automatically adjust the sensitivity setting to adapt to changes in EGM amplitude over time. Typically, these functions operate to modify sensing thresholds based on a series of 10 to 20 ventricular beats. One such algorithm employs two simultaneous sensing levels: the programmed sensitivity (inner target) and a value twice the programmed value (outer target) (Fig. 3-18).45 Sensed EGMs exceeding both target values decrease the sensitivity. Signals exceeding only the inner target increase the sensitivity. In this manner, a 2 : 1 sensing margin is maintained. Rapid, automated sensitivity adjustments may be desired when EGM amplitudes can be expected to change over a brief period, such as beat-to-beat variations from respiration, body position changes, or fluctuating EGM morphologies during AF.46
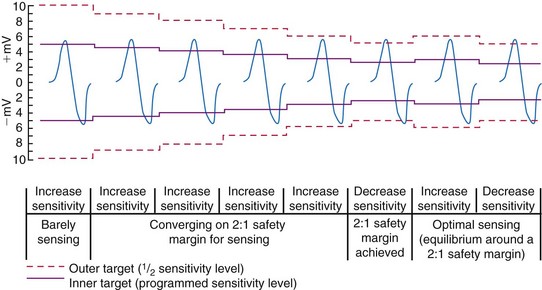
Figure 3-18 Autosensing algorithm to maintain a 2 : 1 sensing safety margin.
(From Castro A, Liebold A, Vincente J, et al: Evaluation of autosensing as an automatic means of maintaining a 2:1 sensing safety margin in an implanted pacemaker. Autosensing Investigation Team. Pacing Clin Electrophysiol 19:1708-1713, 1996.)
Far-field R-wave oversensing can be minimized by (1) selecting an atrial lead with a closely spaced bipolar electrode pair (≤10 mm), (2) choosing an implantation location that yields an FFRW/P-wave ratio of less than 0.5,47 (3) titrating programmed sensitivity to reject FFRWs without undersensing P waves and low-amplitude AF, and (4) using PVAB.
Ventricular Sensing in Ventricular ICDs
Automatic Adjustment of Sensitivity
Adjustment of Sensitivity in Normal Rhythm
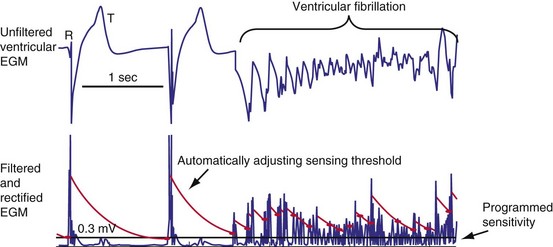
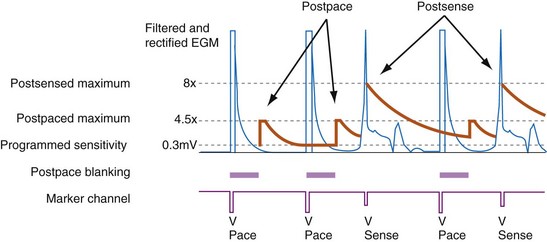
All ICDs automatically adjust sensitivity in relation to the amplitude of each sensed R wave (Fig. 3-19). At the end of the blanking period after each sensed ventricular event, the sensing threshold is set to a high value. It then decreases with time until a minimum value is reached. Compared with a fixed sensing threshold, automatic adjustment of sensitivity increases the likelihood of sensing low-amplitude and varying EGMs, while minimizing the likelihood of T-wave oversensing.
The methods of the different manufacturers for automatic adjustment of sensitivity perform similarly after small R waves but differently after large R waves. Figure 3-20 shows that after large R waves, the Boston Scientific ICDs increase the sensing floor. In the Cognis/Teligen family, the sensing floor is set to one-eighth the amplitude of the measured R wave if that value is greater than the programmed sensitivity. This prevents T-wave oversensing in the setting of large R waves and reduces oversensing of low-amplitude noncardiac signals (e.g., diaphragmatic myopotentials, EMI). However, it may increase the risk of undersensing during rare episodes of VF with highly variable EGM amplitude.48
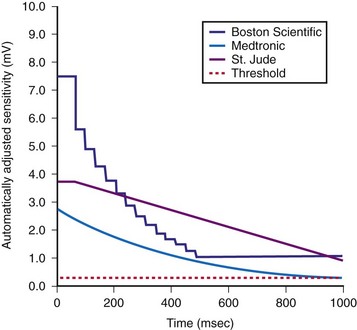
The programmed sensing threshold is approximately 0.3 mV. After sensed ventricular events, Medtronic ICDs reset the sensing threshold to 8 to 10 times the programmed sensitivity, up to a maximum of 75% of the sensed R wave. The value of Auto-Adjusting Sensitivity then decays exponentially from the end of the (sense) blanking period, with a time constant of 450 msec, until it reaches the programmed (maximum) sensitivity. At the nominal sensitivity of 0.3 mV, there is little difference between the sensitivity curves of Medtronic ICDs after large and small spontaneous R waves. If the R wave is large, the entire Auto-Adjusting Sensitivity curve can be altered substantially by changing the programmed value of maximum sensitivity (see Fig. 3-19). At nominal settings, the St. Jude Threshold Start begins at 62.5% of the measured R wave for values between 3 and 6 mV. If the R-wave amplitude is greater than 6 mV or less than 3 mV, the Threshold Start is set to 62.5% of these values (3.75 mV and 1.875 mV, respectively). The sensing threshold remains constant for a Decay Delay period of 60 msec and then decays linearly with a slope of 3 mV/sec. Both the Threshold Start percent and the Decay Delay are programmable, over the range of 50% to 75% and 0 to 220 msec, respectively (see Fig. 3-21). Boston Scientific Cognis-Telegin ICDs set the starting threshold to 75% of sensed R waves with a maximum limit of 3/2 · Peak Running Average. Sensitivity then decays using digital steps, each seven-eighths the amplitude of the previous step. For sensed events, the duration of the first step is 65 msec, and the duration of subsequent steps is 35 msec. This results in a sensitivity of one-half the peak R wave in about 170 msec. (See text for further details.) After a paced ventricular event, all ICDs also adjust sensitivity dynamically, starting at the end of the (pace) blanking period, but the threshold starts at a more sensitive setting.
(Modified from Swerdlow C, Friedman P: Advanced ICD troubleshooting. Part I. Pacing Clin Electrophysiol 28:1322-1346, 2005.)
Postpacing Automatic Adjustment of Sensitivity
After ventricular pacing, all ICDs set ventricular sensitivity to a highly sensitive value to prevent pacing during VF. The sensitivity threshold then decays to the programmed sensitivity level (Fig. 3-21). Thus ICDs are especially vulnerable to oversensing of low-amplitude signals late in diastole during pacing, when the amplifier sensitivity or gain is maximal. Clinically, the most important manifestation is the oversensing of diaphragmatic myopotentials.3
Ventricular Blanking Periods
Short Same-Chamber Blanking Periods and R-wave Double-Counting
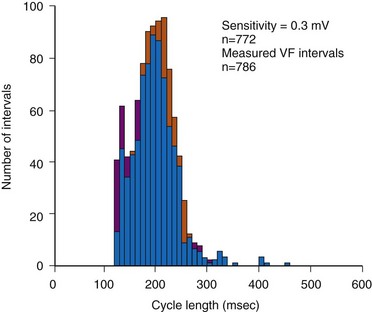
In adults who are not taking antiarrhythmic drugs, inter-EGM intervals for filtered EGMs in VF vary from about 130 to 300 msec, with a peak near 200 msec (Fig. 3-22). Therefore, fixed or nominal blanking ICD periods after ventricular sensed events range from 120 to 135 msec. R-wave double-counting occurs if the duration of the sensing EGM exceeds the ventricular blanking period.
Cross-Chamber Blanking Periods and Undersensing of VT/VF
Under most conditions, ICDs apply only the minimum cross-chamber ventricular blanking required to prevent “crosstalk” resulting from an atrial pacing stimulus. During high-rate atrial or dual-chamber pacing, ventricular sensing may be restricted to short periods of the cardiac cycle because of the combined effects of ventricular blanking after ventricular events and cross-chamber ventricular blanking after atrial pacing. If a sufficient fraction of the cardiac cycle is blanked, systematic undersensing of VT or VF may occur. When pacing and blanking events occur at intervals that are multiples of a VT cycle length, ventricular complexes may be repeatedly undersensed, delaying or preventing detection.52–54 This occurs most often with rate-smoothing algorithms.
“Sensing” Other Ventricular Electrograms
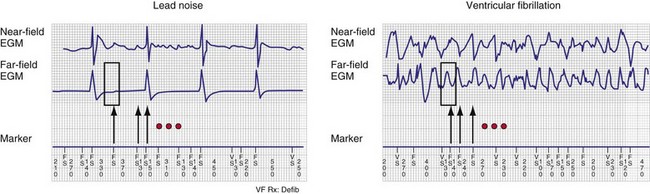
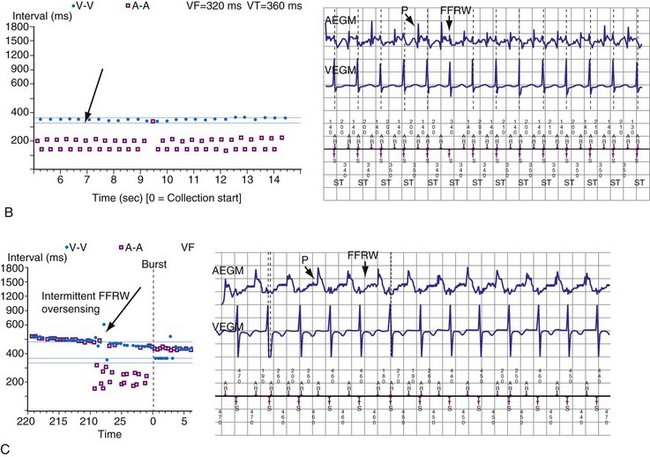
Automatic analysis of the far-field EGM has also been proposed as a method to identify oversensing in ICDs resulting from lead fracture or sensing-lead connection problem. In one approach, the peak-peak far-field EGM amplitude is measured in a small window centered around each sensed event (on near-field channel) to discriminate rapid oversensing from true VT/VF. Oversensing is identified when sensed events on the near-field channel correspond to isoelectric periods on the far-field channel.55,56 In true VF, isoelectric periods are rare on the far-field channel (Fig. 3-23).
Evaluating Sensing of Ventricular Fibrillation at Implantation
Increasing interest in implanting ICDs without assessing defibrillation efficacy has focused attention on the extent to which adequacy of VF sensing can be determined from EGMs recorded in baseline rhythm. Although the statistical correlation between R-wave amplitude in VF and baseline rhythm is weak,57,58 two studies reported that sensing of VF is adequate with nominal sensitivities near 0.3 mV if the baseline R wave is sufficiently large (≥5 mV or ≥7 mV).59 Rarely, clinically significant undersensing of VF or polymorphic VT may occur despite adequate sinus-rhythm R waves.48,60 In these cases, undersensing occurs because auto-adjusting sensitivity criteria respond inadequately to variations in R-wave amplitude, rather than consistently low-amplitude R waves. The reproducibility of this phenomenon is unknown, as is its predicted extent at implantation.
Therefore, it is uncertain whether clinically appropriate testing at implantation can detect this infrequent cause of undersensing. During ICD implant with true bipolar sensing and current digital sensing amplifiers, clinically significant undersensing of VF is rare and unrelated to sinus-rhythm R-wave amplitude.61 Undersensing of spontaneous VT/VF in the VF zone is similarly rare. Reliable sensing of VF cannot be predicted from baseline EGMs if the baseline ventricular rhythm is paced. Sensitivity is programmed to a less sensitive value than nominal (e.g., to avoid T-wave oversensing), or patients have other implanted electronic ICDs, such as pacemakers, cardiac contractility modulation devices, or transcutaneous electrical nerve stimulation (TENS) units, that could cause device-device interactions.
Postshock Sensing
Postshock sensing is critical for redetection of VF after unsuccessful shocks and for accurate detection of episode termination. Electroporation, the process by which strong electric fields create microscopic holes in the cardiac cell membranes, has been proposed as the mechanism for postshock distortion of EGMs recorded from high-voltage electrodes.62 Because EGMs of dedicated bipolar sensing electrodes are minimally affected by shocks,63 they became standard for early epicardial ICDs. For transvenous ICDs, postshock sensing recovers more rapidly with true bipolar sensing configurations than with integrated bipolar sensing.64,65 This is a minor issue for current integrated bipolar leads with a pacing tip electrode–to–distal coil spacing of approximately 12 mm.66
Atrial Sensing in Dual-Chamber ICDs and Atrial ICDs
Postventricular Atrial Blanking and Rejection of Far-Field R Waves
To prevent oversensing of FFRWs, older dual-chamber ICDs had fixed PVAB periods, similar to those in pacemakers (Fig. 3-24). With a fixed blanking period, the blanked proportion of the cardiac cycle increases with the ventricular rate. Atrial undersensing caused by PVAB causes underestimation of the atrial rate during rapidly conducted atrial flutter or AF, resulting in inappropriate detection of VT67 (Fig. 3-24, lower panel). Without PVAB, however, atrial oversensing of FFRWs could cause overestimation of the atrial rate during tachycardias with a 1 : 1 AV relationship.68 This may result in either inappropriate rejection of VT as SVT, if FFRWs are counted consistently as atrial EGMs, or inappropriate detection of SVT as VT, if FFRWs are counted inconsistently.69
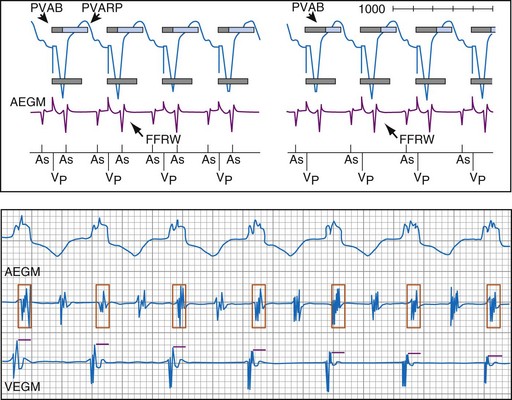
Medtronic ICDs also reject FFRWs algorithmically by identifying a specific pattern of atrial and ventricular events that fulfill specific criteria (Fig. 3-25). Intermittent sensing of FFRWs or frequent premature atrial events may disrupt this pattern, resulting in misclassification of a tachycardia. Therefore, it is preferable to reject FFRWs after sensed ventricular events by decreasing atrial sensitivity, if this can be done without undersensing of AF. Atrial sensitivity can be reduced to 0.45 mV with a low risk of undersensing AF. Less sensitive values should be programmed only if the likelihood of rapidly conducted AF is low. FFRW oversensing that occurs only after paced ventricular events (when auto-adjusting atrial sensitivity is maximal) does not cause inappropriate detection of SVT as VT, but it may cause inappropriate mode switching and can contribute to inappropriate detection of AF or atrial flutter.
Medtronic ICDs (starting with Entrust) and Boston Scientific ICDs (starting with Vitality) may use brief atrial blanking or a period of reduced, automatically-adjusting sensitivity (or both) to reject FFRWs without preventing detection of AF (Fig. 3-26). St. Jude ICDs and Medtronic ICDs starting with Entrust provide programmable atrial blanking after sensed ventricular events to individualize the trade-off between oversensing of FFRWs and undersensing of AEGMs in AF. St. Jude ICDs also provide programmable atrial sensing Threshold Start and Decay Delay, corresponding to the same features in the ventricular channel.
Stay updated, free articles. Join our Telegram channel

Full access? Get Clinical Tree


