Although accurate and thorough medical history taking and physical examination are crucial for diagnosing peripheral arterial disease (PAD), the limitations of clinical assessment necessitate adjunctive imaging techniques that improve the accuracy of the diagnosis and quantification of PAD. Vascular ultrasound provides a valuable tool in the assessment of various peripheral vascular beds. Despite the advances in computed tomography (CT) and magnetic resonance (MR) angiographic techniques, vascular ultrasound still represents the initial test of choice based on its noninvasive nature, accuracy, validated values, and wide availability. Beyond screening for and diagnosing PAD, imaging modalities, including ultrasound, provide essential information regarding the level and extent of the disease as well as helping plan the appropriate treatment. Moreover, noninvasive testing aids in the assessment of the success and durability of therapies. The accuracy of noninvasive tests in the diagnosis, evaluation, and follow-up monitoring of PAD has resulted in the significant reduction of the need for invasive angiography studies, with considerable savings for the health care system without compromising quality of care. The purpose of this chapter is to review the role of vascular ultrasound and its utility in the diagnosis of PAD in various vascular beds.
MODALITIES OF VASCULAR ULTRASOUND IMAGING
Ultrasound refers to sound waves with a frequency above the audible range (i.e., >20,000 cycles/sec). In clinical practice, ultrasound is generated by a piezoelectric crystal within a transducer. This ultrasound beam travels through the tissue and is reflected back to the transducer. Based on differences in the acoustic properties of the arterial wall layers and components of atherosclerotic plaque, there is heterogeneity in the reflection of the ultrasound waves, allowing the reconstruction of an image that displays the anatomic information based on different shades of gray scale (also called B-mode or brightness imaging). The resolution of the gray-scale image permits a rough evaluation of the vessel (i.e., vessel size, presence of atheroma/ hematoma/aneurysm) but does not provide an accurate assessment of the severity of a stenosis within the vessel.
The ability to sample the change in frequency of the transmitted versus the received ultrasound waves (i.e., Doppler ultrasound) allows the additional assessment of blood flow velocity within the vessel. Color Doppler refers to the display technique that uses color to facilitate quick assessment of this Doppler information, allowing one to recognize the direction of flow within a vessel. By convention red and blue colors indicate blood flowing toward and away from the transducer, respectively. Turbulent flow is typically indicated by shades of green or a mosaic appearance.
Duplex ultrasound imaging combines B-mode imaging and Doppler coding of velocity shifts with pulse-wave/continuous-wave ultrasonography, and therefore, provides detailed examination of both the anatomic characteristics and the functional significance of an arterial stenosis. By superimposing the color Doppler coding on the B-mode images, the location and severity of stenosis can be identified. The combination of these modalities has significantly improved the sensitivity and specificity of ultrasound imaging in detecting hemodynamically significant stenoses against the traditional gold standard for defining stenosis severity of digital subtraction angiography (with a diameter stenosis ≥ 50% considered the cutoff that defines a significant lesion).
Duplex ultrasonography has a number of practical advantages in the assessment of PAD. In addition to providing both anatomic and functional information, it is noninvasive, does not require the administration of iodinated contrast, does not expose the patient to radiation, is relatively inexpensive, is widely available (even at smaller medical centers and outpatient facilities), and is applicable in patients with claustrophobia or previously implanted devices or metal artifacts. Some limitations to this technique do exist. Since ultrasound waves cannot penetrate bone, it should not be used to image vessels within body structures (e.g., intracranial portion of carotid or vertebral artery). In addition, ultrasound penetrates gas poorly, making imaging of intra-abdominal and intra-pelvic vessels challenging, particularly in obese patients. The spatial resolution of ultrasound is also limited, making examination of smaller caliber vessels difficult (e.g., tibial vessels). Despite these limitations, Duplex ultrasound has become a valuable tool in the evaluation of patients with PAD, and in the assessment of patients following surgical and percutaneous revascularization procedures. What follows is a summary of the specific use of Duplex ultrasound in the assessment of the primary peripheral vascular territories.
THE LOWER EXTREMITY
Noninvasive evaluation of PAD of the lower extremity is traditionally achieved by multiple modalities (see Chapters 2 and 4). The Doppler and ultrasound examinations of the lower extremity are performed in the supine position. Transducers of variable frequencies are used depending on the depth of the arterial segment being examined (2 to 3 MHz for iliac arteries and 5 to 7 MHz for femoral and more distal arteries). The examination starts by identifying various arteries and arterial segments on two-dimensional (2D) or B-mode imaging. Although some degree of detail of the arterial wall and presence of plaque can be obtained, the resolution is usually not adequate to accurately define stenosis severity. Doppler signals are then obtained from these segments, with the resultant velocities and waveforms providing diagnostic information regarding flow and severity of stenosis. Color coding of the Doppler flow facilitates the examination of specific arterial segments (Fig. 3.1).
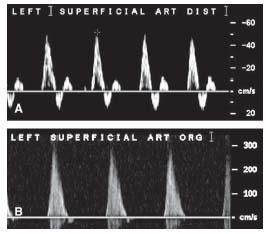
The normal Doppler peripheral arterial waveform consists of three components: rapid forward flow during systole, transient flow reversal in late systole, and a smaller forward flow phase during diastole. Hence the waveform is described as triphasic (Fig. 3.2A). The presence of a normal arterial waveform generally excludes the presence of significant arterial disease (≥ 50% stenosis). With mild disease, and as the artery becomes stiffer, the short late systolic flow reversal is blunted, resulting in a biphasic waveform. With more advanced disease, the flow velocity distal to the lesion is reduced and the small diastolic forward flow is blunted as well resulting in a monophasic waveform (Fig. 3.2B). In addition, the spectrum of flow velocities within the vessel is increased, resulting in “spectral broadening” or filling in of the Doppler waveform (1).
The peak systolic velocity (PSV) is measured from the Doppler waveform at the lesion site (i.e., intrastenotic) and at a normal appearing segment proximal to the lesion (i.e., prestenotic). At the lesion site, PSV increases to a degree proportional to the stenosis severity. Although the PSV at the lesion site does correlate with the severity of stenosis, the sensitivity and specificity of this variable alone are modest due to the interindividual variation in blood flow velocities. The sensitivity and specificity are improved by using the variable termed the “systolic velocity ratio” (SVR) or “peak velocity ratio” (PVR), which is the ratio of the maximum PSV at the lesion site to the maximum PSV proximal to the lesion. In most laboratories, a PVR/SVR ratio ≥ 2 is used to indicate a significant stenosis. In most clinical trials of femoropopliteal artery stenting, a PVR/SVR of ≥ 2.5 is used to adjudicate the presence of significant restenosis.
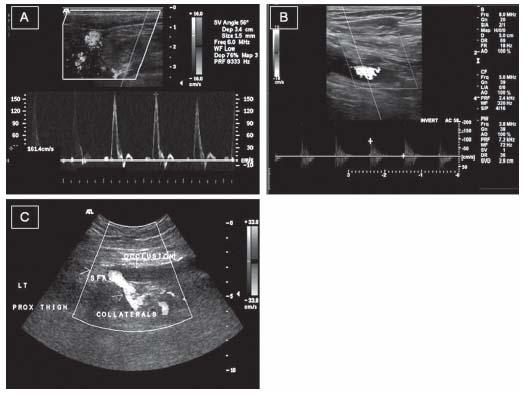
Therefore, a significant lesion can be identified by the morphology of the waveform, the degree of increase in PSV relative to a normal proximal segment, and the appearance of flow turbulence on color Doppler. Accordingly, a simplified approach for quantifying the severity of arterial disease has been adopted by most clinicians (2–5). Doubling of the PSV at the lesion level, loss of flow reversal, and turbulence are signs of a significant stenosis (i.e., >50% diameter stenosis). With milder stenoses (50% diameter stenosis), the PSV is increased but to a lesser degree and the flow-reversal component of the waveform is preserved. When the arterial segment is totally occluded, no Doppler signal can be obtained and color coding demonstrates the absence of flow in the lumen (Fig. 3.3). Attempts to further categorize a given stenosis as 50%, 50% to 75%, and 75% to 99% have been successfully reported in the literature, although have not been widely adopted (6,7).
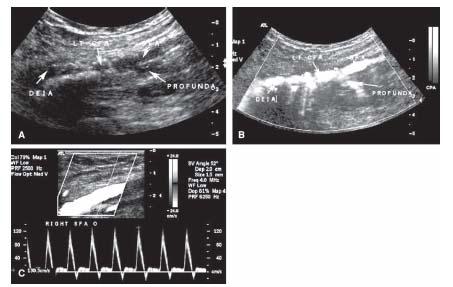
Figure 3.1 • Duplex ultrasonography of the common femoral artery (CFA) bifurcation. A: B-mode ultrasound image showing limited detail of the arterial lumen and wall. B: Color power image from the same site clearly showing the lumen of the DEIA, the CFA, and the proximal portions of the SFA and profunda femoral arteries. C: Routine color Doppler of the CFA bifurcation facilitating sampling of Doppler waveform from the SFA. DEIA, distal external iliac artery; SFA, superficial femoral artery.
Figure 3.2 • Doppler velocity patterns in normal and diseased peripheral arteries. A: Normal triphasic arterial waveform demonstrating the characteristic systolic rapid forward upstroke followed by late systolic flow reversal. There is minimal diastolic blood flow as compared with low-resistance vascular beds such as the internal carotid and renal arteries. B: Monophasic arterial waveform with elevated peak systolic flow velocity indicating presence of significant disease. The late systolic flow reversal and early forward diastolic flow are both blunted leading to a monophasic wave.
A meta-analysis of 16 studies showed the sensitivity and specificity of Duplex ultrasound to be 86% and 97% in aortoiliac disease and 80% and 96% in femoropopliteal disease, respectively. The sensitivity and specificity for infragenicular arterial disease were slightly lower at 83% and 84%, respectively (8).
However, it is prudent to be aware of the limitations of the technique. Lower extremity Duplex ultrasound examinations can be time-consuming, even in experienced hands (typically take 30 to 60 minutes). The frequency of incomplete studies can be significant (estimates vary from 4% to 60%) and is typically due to failure to insonate the pelvic segments, the presence of severely calcified vessel segments that cause acoustic shadowing, and the occurrence of slow flow downstream from occlusive disease (9). It is important to maintain an angle of interrogation 60 degrees during acquisition of flow velocity data to avoid obtaining spurious velocities.
THE UPPER EXTREMITY
The evaluation of the upper extremity by ultrasonography is similar to that of the lower extremity in terms of velocity cutoffs. However, because of the superficial anatomy of the arm arteries, most of the arteries distal to the clavicle can be imaged using high-frequency probes ranging from 8 to 15 MHz. Contrary to the lower extremity, atherosclerotic disease is very rare distal to the subclavian artery, except in patients with diabetes mellitus and end-stage renal disease. On the other hand, various vasculitides such as thromboangitis obliterans, scleroderma, CREST syndrome, and mixed connective tissue disease are known to have specific propensity for the small and medium-sized arteries of the upper extremity.
Subclavian artery disease is easily detected and evaluated by conventional testing and duplex scanning. Measuring the blood pressures in both arms is a useful screen, and measuring segmental pressures along the length of the arm will typically localize the diseased segment to the subclavian artery (and innominate artery on the right side). Although the origin of the left subclavian artery below the clavicle is not accessible for Doppler duplex imaging, all of the right subclavian artery and the remaining sections of the left are typically amenable. Duplex imaging of the subclavian artery provides the same information as that described with lower limb arterial imaging. The Doppler waveforms obtained from a normal subclavian artery are identical to that described earlier for lower limb arteries (i.e., triphasic). Guidelines for estimating the severity of subclavian obstructive lesions based on peak systolic velocities are similar to those used for the lower limbs. It is important to note that the systolic flow reversal phase of the Doppler signal obtained from brachial, ulnar, or radial arteries is absent in up to 50% of healthy individuals. Otherwise, qualitative changes in the waveform (e.g., spectral broadening, monophasic morphology) infer similar conclusions regarding the hemodynamic significance of obstructive disease. Palmar arch flow and digital arterial flow are best evaluated using Doppler. The contribution of the ulnar and radial arteries to palmar arch flow may be assessed using the Doppler device with sequential occlusion of the arteries.
THE CEREBROVASCULAR CIRCULATION
The majority of patients with cerebrovascular disease are asymptomatic. Physical examination is usually not reliable enough to identify most cases of occult carotid disease. Ultrasound imaging has become the most commonly used imaging modality for this indication due to its noninvasive nature, accuracy, and wide availability.
The available criteria for defining carotid disease were originally based on angiographic criteria. Among the major randomized trials reported in the 1990s that studied the role of endarterectomy in the treatment of carotid artery disease (i.e., North American Symptomatic Carotid Endarterectomy Trial (NASCET) (10), European Carotid Surgery Trial (ESCT) (11), and Endarterectomy for Asymptomatic Carotid Artery Disease Study (12)) nonuniform criteria for grading carotid artery disease were used (Fig. 3.4). As a result, a 50% and 70% stenosis based on the NASCET criteria was equivalent to a 65% and 82% stenosis, respectively, using the ECST criteria (13). Despite the differences, all provide similar prognostic information. Medicare/Medicaid and other reimbursement bodies have adopted the NASCET criteria since it appears to be the most reliable and reproducible.
Figure 3.3 • Arterial Duplex examination (Doppler velocity and B-mode ultrasound) patterns in normal and diseased peripheral arteries. After identifying the arterial segments to be examined, color Doppler is superimposed on the 2D image. Doppler signals are obtained from the lumen. A: A normal artery with laminar flow and a triphasic wave. B: A diseased segment with turbulence demonstrated by the mosaic appearance on the color flow. A Doppler sample distal to the lesion demonstrates reduced velocity and a monophasic wave. C: A totally occluded superficial femoral artery with no evidence of flow as assessed by color Doppler in the occluded segment and the collateral flow around the occluded segment of the artery.
The Carotid Duplex Examination
The patient is placed in the supine position, turning the neck away from the side of the examination. Transducers with frequencies of 5 to 7.5 MHz are most commonly used. Initially, the common carotid artery (CCA) is identified at the base of the neck and then traced cephalad to identify the bifurcation and both internal and external carotid arteries (ICA and ECA).
After the initial scan for orientation, the CCA, carotid bulb, and ICA are then examined more closely, using B-mode or gray-scale imaging in both the longitudinal and the transverse planes. Doppler waveforms are obtained from all the arterial segments; the PSV and end-diastolic velocity (EDV) at each site are recorded. Doppler color coding may identify segments with flow turbulence, which facilitates the identification of segments with the highest velocities (14). It is important to sweep the Doppler through the entire vessel so as not to miss a high-velocity jet.
Normal Doppler Velocity Patterns
The ICA and ECA must be identified early on in the examination process. The ICA is usually larger in size, has no branches in the neck, and courses posteriorly toward the mastoid process. Most importantly, the ICA has a low-resistance Doppler signature since it feeds a low-resistance vascular bed in the brain. The characteristic flow pattern shows high forward flow velocity during systole with continuing forward flow during diastole at a lower velocity (Fig. 3.5A). The diastolic flow is therefore above the baseline and no flow reversal is seen.
The ECA, on the other hand, supplies a high-resistance peripheral vascular bed in the neck and face. Its typical waveform has a high-velocity systolic forward flow, followed by a prominent dicrotic notch with possible late systolic flow reversal, and minimal low velocity forward diastolic flow (Fig. 3.5B). However, the most accurate way to discriminate the external from the internal carotid artery is to perform a temporal tap. Tapping one’s finger over the superficial temporal artery (just anterior to the external auditory meatus) produces a characteristic appearance indicating that the Doppler signal is being sampled from the ECA. As the temporal artery is a branch of the ECA, velocity deflections caused by the tapping should be seen on the ECA waveform (Fig. 3.5B) (14,15).
Physiologically, approximately 80% of the CCA flow is directed to the brain; therefore, the normal Doppler waveform from the CCA has characteristics of both the ICA and the ECA flow (Fig. 3.5C). A Doppler waveform from the CCA that has the appearance of that from the ECA usually indicates the presence of an ipsilateral ICA occlusion.
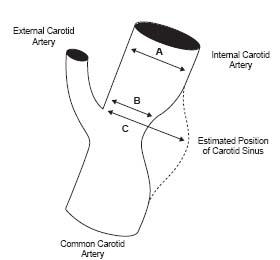
Figure 3.4 • Illustration of the methodology used to define the severity of internal carotid artery stenosis in the NASCET and ECST trials. According to the NASCET criteria, the reference diameter is measured in the internal carotid artery distal to the diseased segment. Thus, the degree of stenosis is measured as (A – B)/A. In the ESCT trial, investigators extrapolated the border of the angiogram to account for the normal dilatation at the carotid sinus and calculated the percent stenosis as (C – B)/C.
Gray-Scale Imaging
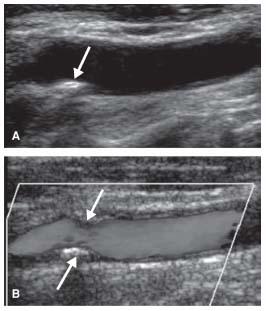
The initial part of the Duplex examination of the carotid arteries is usually spent surveying the arterial segments by B-mode imaging. In clinical settings, the extent and severity of plaque are presented in descriptive or semiquantitative terms. For example, plaques may be described as extending from the CCA to the proximal third of the ICA and may be further labeled as mild, moderate, or severe. Furthermore, atherosclerosis may be circumferential or localized. As will be discussed later, it is generally possible to use the grayscale image of the arterial wall and plaque in conjunction with color-coded flow in the lumen to have a rough estimate of the degree of diameter reduction (e.g., more or less than 50%, near-total or total occlusion) (16,17) (Fig. 3.6).
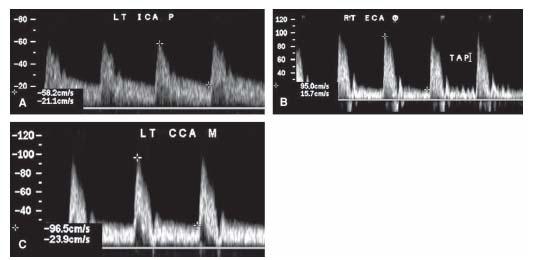
Figure 3.5 • Doppler waveforms form the carotid artery. A: Internal carotid artery flow demonstrating the characteristic low-resistance flow pattern with significant continuous diastolic flow. B: External carotid artery flow pattern demonstrating typical high-resistance vascular bed flow pattern with minimal diastolic blood flow. Note the typical effect of tapping on the superficial temporal artery on the Doppler waveform. C: Normal common carotid waveform. Common carotid artery waveform is usually a low-resistance wave since 80% of the blood flow ends in the internal carotid artery.
Figure 3.6 • B-mode image (A) and color Doppler (B) of the common carotid artery showing localized echogenic plaque producing mild degree of stenosis (arrows).
Echogenicity of the plaque has been proposed as an indicator of plaque composition. Low echogenicity suggests a high content of lipid. Some lipid-laden plaques may be of such low echogenicity that they may not be visualized on gray-scale imaging. They are identified as a flow void on color imaging. Marked echogenicity with shadowing suggests calcification. The shadowing may be sufficiently extensive to preclude Doppler interrogation of the arterial segment under the area of calcification. Plaques predominantly composed of fibrous tissue will have an intermediate echogenicity comparable to surrounding muscular tissue but less echogenic than the arterial adventitia (16,18).
When the echogenicity of the plaque is variable, it is described as heterogenous. This is possibly caused by intraplaque hemorrhage and/or necrosis (19). Some studies have suggested that heterogenous plaques and intraplaque hemorrhage identified by gray-scale imaging are more frequently encountered in patients with clinical evidence of cerebral ischemia (20). Although surface ulceration of the plaque as detected by 2D ultrasound has been suggested as a risk factor for cerebral ischemic events (21), the data are inconsistent, and the reproducibility of this ultrasonographic finding is moderate (19,22).
Doppler Criteria for ICA Stenosis Severity
Doppler velocities provide validated and quantitative methods of grading carotid stenosis. The most common phenotypic finding is spectral broadening caused by turbulent flow at and just distal to the stenotic segment. The primary measurement is the ICA PSV, which represents the cornerstone for grading carotid stenosis. However, the ICA EDV and the carotid index (defined as the ratio of the PSV in the ICA and the PSV in the CCA) are recommended to define the severity of carotid stenosis when technical or clinical concerns raise questions that ICA PSV may not represent the actual severity of disease (23).
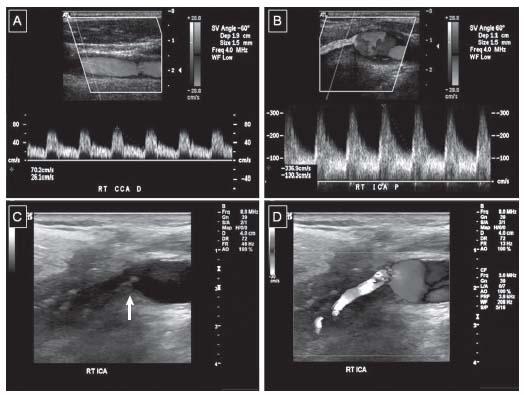
The rationale for using these measurements is dependent on two pathophysiologic facts. First, the velocity of flow increases within a stenotic arterial segment, compared with the velocity of flow in a more proximal and relatively disease free lumen. Although not linear, this relationship is proportional, such that certain ranges of flow velocities may be used to estimate the degree of diameter reduction. This applies to both the PSV and the EDV. Second, the atherosclerosis of the carotid arteries predominantly affects the carotid bifurcation, at the junction of the CCA and the ICA, and the proximal portion of the ICA. Normally, with laminar flow, there is no difference between CCA and ICA flow velocity. As the stenosis at the bifurcation increases in severity, the velocity in the ICA at the site of the stenosis increases but not that of the CCA velocity, which results in a higher ICA/CCA PSV ratio (Fig. 3.7).
Others have also examined the ICA/CCA EDV ratio, as well as the severity of spectral broadening in the ICA Doppler signal, which indicates more turbulent flow and is hence considered a sign of more severe stenosis.
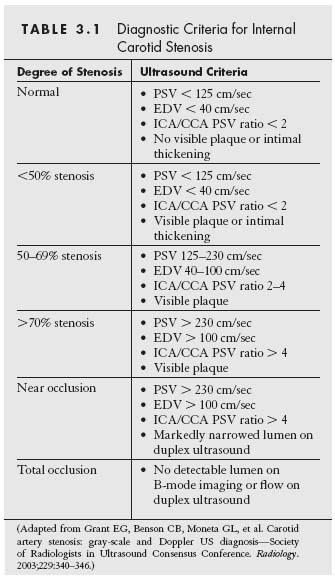
Several sets of criteria have been proposed by leading vascular laboratories. The criteria most commonly followed are those proposed by Strandness (24) and Zwiebel (25). The Society of Radiologists in Ultrasound proposed a consensus set of criteria, based on the large body of evidence accumulated over the last two decades. A consensus statement by the “Society of Radiologists in Ultrasound Conference” has been adopted by the majority of vascular laboratories. The consensus statement’s classification of carotid artery stenosis criteria is listed in Table 3.1. The criteria utilize both PSV and EDV cutoff values in addition to the ICA/CCA PSV ratio and take into account findings on B-mode imaging, particularly when the diagnosis of near occlusion or complete occlusion is being contemplated. It is important to exhaust all ultrasound techniques before diagnosing a total occlusion. Total occlusion is confirmed when there is no detectable patent lumen on the gray-scale image and no flow by spectral, power, and color Doppler (Fig. 3.8) (23).
The sensitivity and specificity of these criteria in diagnosing carotid stenosis vary depending on the PSV cutoffs used and can achieve 100% specificity and 96% sensitivity by adjusting the velocity according to the clinical situation (26). A meta-analysis of 41 studies found that the sensitivity and specificity of carotid duplex ultrasound for detecting a stenosis in the 70% to 99% range by angiography are 89% and 84%, respectively. The sensitivity and specificity of Doppler for detecting less severe stenoses (i.e., 50% to 69% range) are much lower (27). However, the diminished accuracy in detecting stenoses in the 50% to 69% range has no significant clinical implication in asymptomatic patients since these patients are rarely considered for revascularization.
Despite the publication of these criteria for defining lesion severity, it is critical for each laboratory to establish and validate its own criteria. The aforementioned sources of variability, both in the angiogram and in the duplex assessment, cannot be overemphasized. The published criteria are a starting point that is fine tuned after internal quality control and correlation with CT and MR angiography, invasive angiography, and feedback following surgical endarterectomy. Therefore, physicians caring for patients with carotid disease should be familiar with the laboratory standards and criteria used to make the diagnosis. It is also imperative that angiographers and surgeons provide feedback to the vascular laboratory, in a continuous effort to improve the accuracy of reporting.
Figure 3.7 • Duplex examination of a diseased internal carotid artery. A: Mid common carotid artery demonstrating normal flow pattern and velocity. B: Proximal internal carotid artery flow demonstrating the elevated velocities consistent with proximal stenosis. The mosaic color flow reflects turbulence of flow in the stenotic segment. The peak systolic velocity is 337 cm/sec and the end diastolic velocity is 130 cm/sec consistent with >70% stenosis. The degree of stenosis is also confirmed by the ICA/CCA PSV ratio which is 4.8 consistent with >70% stenosis. C: B-mode image of the carotid bifurcation demonstrating complex plaque at the site of stenosis (arrow). D: Superimposed color Doppler at the carotid bifurcation confirming the complex plaque to be the cause of the mosaic color pattern and flow disturbance.
Caveats and Special Disease Subsets
The typical Doppler velocity thresholds used to define stenosis severity can lead to under- or overestimation of lesion severity in a number of conditions that ultrasound operators and interpreters need to be familiar with. Some of the more common conditions are described below.
CONTRALATERAL ICA OCCLUSION
In these cases, there is increased flow in the patent ICA and the vertebral arteries, to maintain adequate cerebral arterial perfusion. With the increased flow, the Doppler velocities in the patent ICA are elevated, giving the false impression of obstructive disease. The exact degree to which the ICA flow velocity increases in this setting is difficult to ascertain but may be dependent on the adequacy of the Circle of Willis, the contribution of vertebral flow, and the presence or absence of scar tissue in the distribution of the occluded ICA. Several investigators have modified existing Doppler cutoff values to define lesion severity within a patent ICA in the presence of a contralateral occlusion. A PSV of ≥ 140 cm/sec and EDV 140 cm/sec were suggested as more accurate criteria to define a stenosis of 50–79%. Thresholds of PSV > 140 cm/sec and EDV > 140 cm/sec were proposed to define a stenosis between 80% and 99% (28). Other proposed criteria in this setting use a slightly higher threshold of EDV (155 cm/sec) to distinguish stenoses in the 50% to 79% from stenoses in the 80% to 99% range (29). Both of these adjusted Doppler criteria sets claim to have approximately 97% accuracy.
In order to determine how much of the increase in PSV is due to stenosis of the ICA and how much is due to compensatory flow, it may be useful to compare the velocities in the CCA. If there is a significant increase in the CCA velocities contralateral to an occluded ICA, then compensatory flow is contributing to the high velocity in the contralateral ICA. In patients with bilateral 80% to 99% stenoses who are undergoing carotid endarterectomy or stenting on one side, it is important to recheck the duplex ultrasound on the contralateral side soon after revascularization, to be certain that the stenosis is real and not due to compensatory flow (30).
Stay updated, free articles. Join our Telegram channel

Full access? Get Clinical Tree


