Fig. 51.1
Cross sectional B-mode image showing the widest diameter of the residual aneurysm sac, outer wall to outer wall measurement. (1) anterior/posterior and (2) longitudinal measurement
It is imperative that the measurements be made perpendicular to the aorta, not transverse to the body. Patients often have a severely angulated aorta, and adjusting the transducer to be perpendicular or orthogonal to the aorta is crucial in order to obtain accurate measurements, even if this requires imaging in an oblique plane to the body (Fig. 51.2).
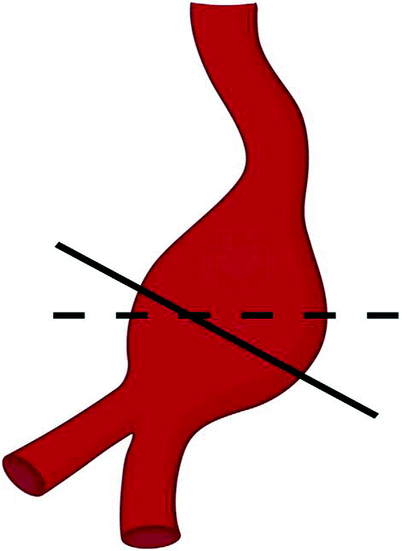
Fig. 51.2
Transducer placement must be perpendicular to the aorta
The residual aneurysm sac should also be examined for areas of echolucency or motion/pulsation in the excluded lumen as that may represent an endoleak (Figs. 51.3 and 51.4).
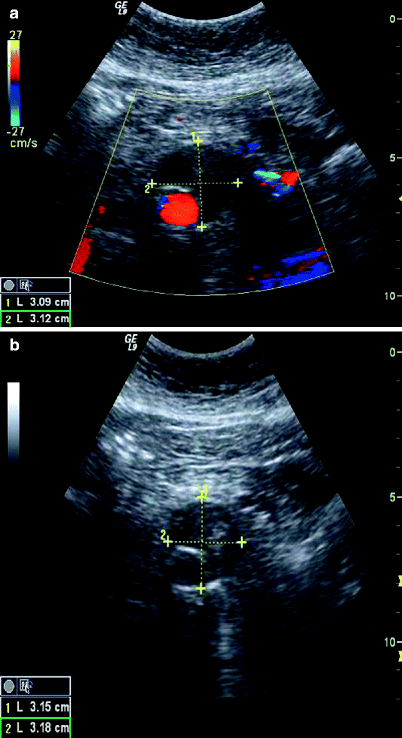
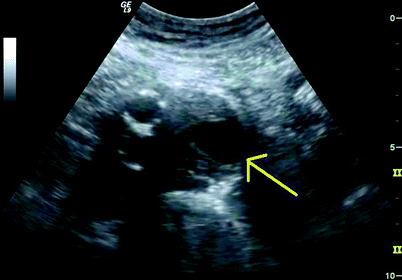
Fig. 51.3
(a) Color Doppler, (b) B-mode; Cross-sectional view of residual aneurysm sac showing that the aneurysm has collapsed down around the stent
Fig. 51.4
Cross sectional B-mode image of the residual aneurysm sac showing areas of echolucency (arrow)
Color and pulsed wave Doppler is next used to obtain a cross sectional color image of the aneurysm sac demonstrating color filling of the stent graft to demonstrate patency (Fig. 51.5).
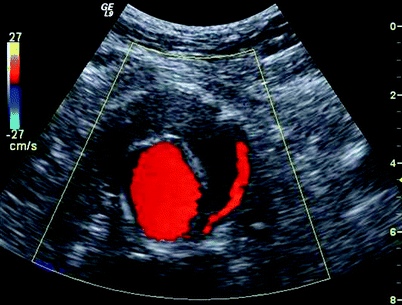
Fig. 51.5
Cross sectional color image of the aneurysm sac demonstrating color filling of the stent graft to demonstrate patency
PW spectral waveforms from the body of the graft should be recorded through each limb of the stent graft to show patency (Fig. 51.6). This is then followed by assessment for any twisting, kinking, or deformity of the graft (Figs. 51.7 and 51.8).
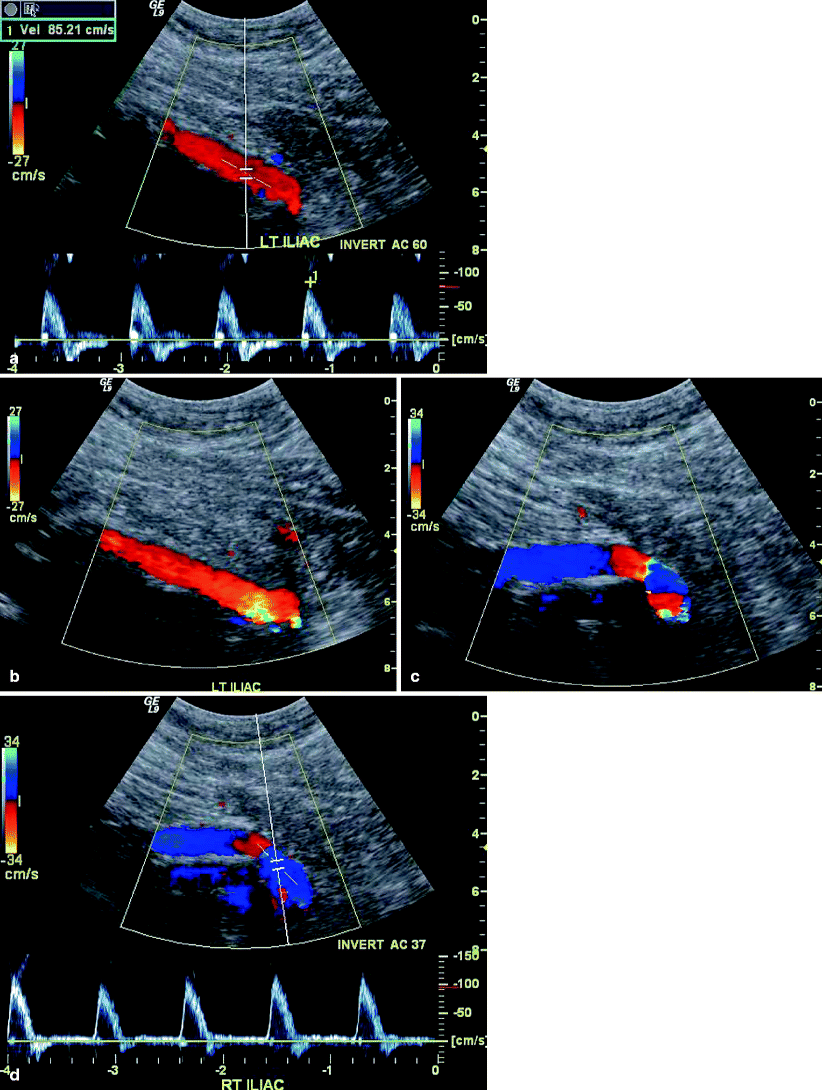
Fig. 51.6
(a) left iliac limb color and spectral Doppler signal, (b) Color Doppler image left iliac limb, (c) Color Doppler image right iliac limb, (d) Color and spectral Doppler image right iliac limb; Color Doppler and PW Doppler waveforms through each limb of the stent graft to show patency
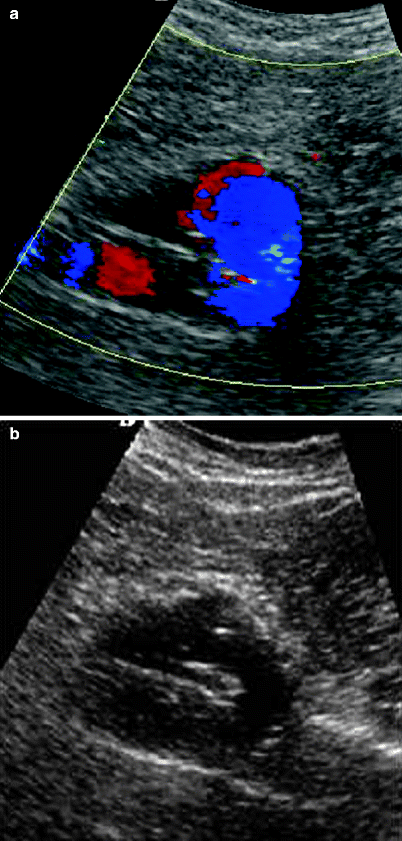
Fig. 51.7
(a, b) Both color Doppler and B-mode images shows a detachment and kinking of left limb of the stent graft (Type I endoleak)
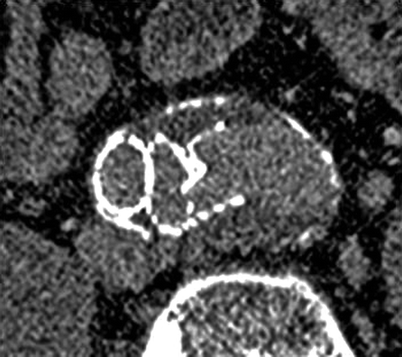
Fig. 51.8
Corresponding CT images of the detached left iliac limb
Color and spectral Doppler is also used to assess the attachment/fixation sites with special attention to the detection of any flow outside the lumen of the graft (Fig. 51.9), which would indicate an endoleak.
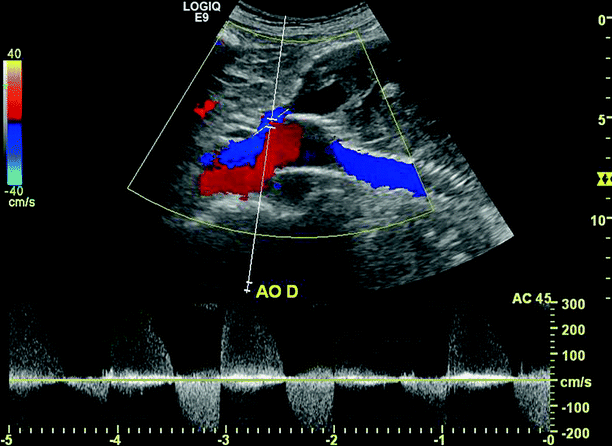
Fig. 51.9
Color and PW spectral Doppler image showing a Type 1 endoleak at the proximal fixation sites
The aneurysm sac should be examined throughout in both sagittal and transverse planes to detect flow outside the endografts that may represent an endoleak (Fig. 51.10). Special attention should be directed to hypoechoic areas and the absence of flow confirmed by Doppler.
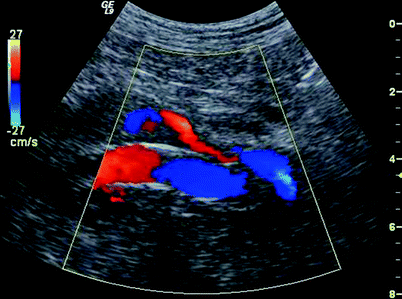
Fig. 51.10
Color Doppler image showing a Type 1 endoleak at the left iliac limb distal fixation sites
The Doppler image of patent aneurysm sac branches (i.e., lumbar, inferior mesenteric artery, internal iliac artery) should be particularly noted, and flow direction should be documented.
PW spectral waveforms should be recorded from any region of extra graft flow detected within the aneurysm sac and from aortic side branches (document direction and source of flow.) To and fro Doppler signals typically identify the origin of the branch flow in type II endoleaks. (Figs. 51.11, 51.12 and 51.13). That characteristic may not be present, however, in cases when leaks enter and exit the sac through different branches.
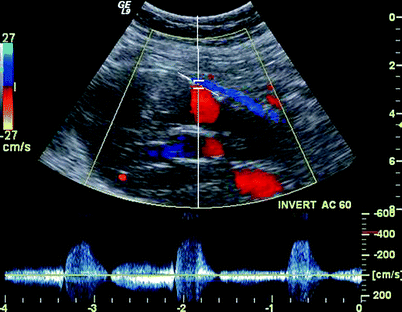
Fig. 51.11
Color and PW spectral Doppler image showing a Type II endoleak with reversed flow through the IMA
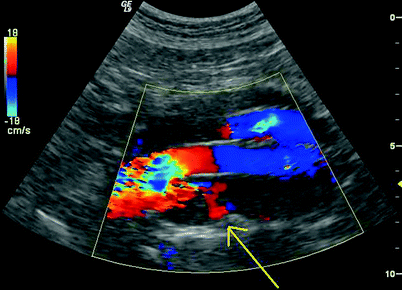
Fig. 51.12
Color Doppler image showing a Type II endoleak with reversed flow through a posterior lumbar branch (arrow)
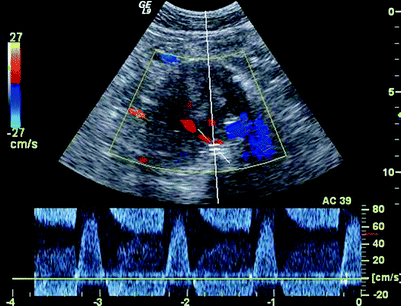
Fig. 51.13
To and Fro Doppler signal at the origin of a posterior lumbar leak, systole (inflow) and diastole (outflow)
Artifactual pulsatile color may be present if the color sensitivity settings are high. With a low color setting, the scanner will prioritize the movement as blood flow versus pulsatile movement of the adjacent graft. Other imaging artifact can occur with abdominal bowel gas or atherosclerotic calcification of the aortal wall.
Nevertheless, a Doppler waveform will differentiate true perigraft flow from color artifact. A true endoleak will be identified in both longitudinal and transverse views, which may help differentiate it from an artifact.
Surveillance Policy Changes
The following is a summary of the evolution of our surveillance policy over the years. In 2003, a new follow-up schedule for EVAR surveillance was initiated for selected patients treated at the University of Pittsburgh Medical Center (UPMC). Annual duplex scanning as the sole imaging modality was offered as early as 1 year post-EVAR for those patients with a collapsed aneurysm sac <4 cm in diameter. This policy was expanded 1 year later to include patients with significant shrinkage of the aneurysm sac to any size, or a stable aneurysm without enlargement for 2 years whether a Type II endoleak was present or not. Patients with contrast allergy or significant renal insufficiency (serum creatinine >2) were switched at earlier intervals depending on aneurysm size and presence or absence of endoleaks. Diameter measurements were defined as the minor axis of the largest axial slice on CT. A significant shrinkage was considered to be a minimum of 5 mm from the baseline 1-month CT. A stable aneurysm was defined as an aneurysm with <3 mm increase in diameter from baseline. Patients with enlargement of the sac by ≥3 mm from the baseline CT were not considered for switching. Most patients underwent duplex scanning to complement the CT scan when the decision to switch the patient was made. All patients with suboptimal studies secondary to anatomy or body habitus were not switched to duplex scanning surveillance.
By the time of our last review, 184 patients (159 males) were switched to duplex scanning surveillance between 2003 and 2006 [13]. All duplex scanning examinations were technically satisfactory for determination of aneurysm size and presence of an endoleak. The mean follow up on duplex scanning was only 24 ± 13 months (range 1–4 years). Initial follow up of these patients included X-rays and CT 1 month after EVAR, 6 months (for patients on investigational protocols), 12 months, and yearly thereafter 13. Following commercial release of each graft, the 6-month follow up was discontinued because of the low incidence of adverse events detected [34].
Following our timeline changes in policy, the duplex scanning follow-up schedule was initiated 34 ± 24 months after EVAR (range 1–112 months). The mean aneurysm diameter at baseline was 54 ± 8 mm and had decreased to 40 ± 11 mm before the decision to implement duplex-scanning-only surveillance. Three new endoleaks were diagnosed during the duplex-only surveillance, only one presenting with sac enlargement. All prompted CT evaluation: one Type II endoleak with stable sac size that could not be identified on the CT obtained 3 months later, and two distal Type I endoleaks that required limb extension. No patient had a clinical adverse event during the period of observation No ruptures or graft occlusions were noted [13]. These findings demonstrated to us the safety of using Duplex scanning as a replacement modality for CT in the FU of EVAR.
Since these changes were adopted slowly over time, we evaluated how many patients would be suited for the switch and how early after EVAR it could be implemented, based on our current criteria. The clinical and follow-up imaging records of 200 consecutive patients with available imaging, treated in 2004 and 2005 were reviewed, demonstrating that 97% of patients are eligible for duplex-scanning-only surveillance by 3 years after EVAR. This finding is quite encouraging as it suggests that the majority of patients can be followed with US only surveillance post-EVAR.
Stay updated, free articles. Join our Telegram channel

Full access? Get Clinical Tree


