Cardiovascular disease (CVD) is a systemic process involving multiple vascular beds and includes coronary heart disease (CHD), ischemic cerebrovascular disease (ICVD), and peripheral arterial disease (PAD). All these manifestations are associated with an increased risk of subsequent myocardial infarction, stroke, and death. Guideline-directed medical therapy is recommended for all patients with CVD. In a cohort of US veterans, we identified 1,242,015 patients with CVD receiving care in 130 Veterans Affairs facilities from October 1, 2013 to September 30, 2014. CVD included diagnoses of CHD, PAD, or ICVD. We assessed the frequency of risk factor optimization and the use of guideline-directed medical therapy in patients with CHD, PAD alone, ICVD alone, and PAD + ICVD groups. A composite of 4 measures (blood pressure <140/90 mm Hg, A1c <7% in diabetics, statin use, and antiplatelet use in eligible patients), termed optimal medical therapy (OMT) was compared among groups. Multivariate logistic regression was performed with CHD as the referent category. CHD comprised 989,380 (79.7%), PAD alone 70,404 (5.7%), ICVD alone 163,730 (13.2%), and PAD + ICVD 18,501 (1.5%) of the cohort. Overall, only 36% received OMT with adjusted odds ratios of 0.54 (95% CI 0.53 to 0.55), 0.77 (0.76 to 0.78), and 0.97 (0.94 to 1.00) for patients with PAD alone, ICVD alone, and PAD + ICVD, respectively, compared with patients with CHD. In conclusion, OMT was low in all groups. Patients with PAD alone and ICVD alone were less likely to receive OMT than those with CHD and PAD + ICVD.
Previous studies have suggested that patients with peripheral arterial disease (PAD) or ischemic cerebrovascular disease (ICVD) are less likely to receive antiplatelet therapy, statin therapy, and have lower rates of blood pressure (BP) control than those with coronary heart disease (CHD). Control of diabetes mellitus in patients with PAD or ICVD compared with CHD has not been reported. Guideline-directed medical therapy and risk factor optimization has also not been evaluated in patients with concomitant PAD and ICVD. We aimed to study the receipt of guideline-directed medical therapy and risk factor optimization in patients with PAD alone, ICVD alone, as well as concomitant PAD and ICVD compared with patients with CHD in a large contemporary national cohort of veterans from the Veterans Affairs health care system.
Methods
Using the Department of Veterans Affairs (VA) clinical data warehouse, we identified veterans with cardiovascular disease (CVD) who had a primary care clinic visit in the VA system from October 1, 2013 to September 30, 2014. Data were included from 130 VA facilities and their associated community-based outpatient clinics. An index visit was defined as the most recent primary care visit during the study period. CVD was defined as a history of CHD, PAD, or ICVD and was identified using International Classification of Diseases, Ninth Revision, Clinical Modification (ICD-9-CM) diagnoses and procedure or Current Procedural Terminology codes ( Supplementary Table 1 ) using validated method. We included patients with at least 2 outpatient or 1 inpatient diagnosis code for unstable angina, myocardial infarction, percutaneous coronary intervention, or coronary artery bypass grafting.
Patients were divided into 4 groups: CHD, PAD alone, ICVD alone, and PAD + ICVD. Patients with CHD who had concomitant PAD and/or ICVD were classified into the CHD group. Based on previous reports, we also used exclusion criteria to improve specificity for the diagnosis of PAD ( Supplementary Table 2 ). Patients with metastatic cancers and those receiving hospice care were excluded from our cohort.
We assessed patient demographics, laboratory data, and vital signs. Systolic and diastolic BP values in mm of mercury (mm Hg) were obtained at the time of the index primary care visit. In those with diabetes, we evaluated glycated hemoglobin (A1c) levels (%) at the index visit. Diabetes was identified if any of the following were documented: 2 outpatient ICD-9-CM or 1 inpatient ICD-9-CM diagnosis code indicating diabetes ( Supplementary Table 1 ), filled prescriptions for diabetes management, any fasting glucose >126 mg/dl, A1c >6.5%, or at least 2 outpatient blood glucose readings >200 mg/dl on 2 different days.
Using VA pharmacy data sources, we identified those who received any statin prescription within 100 days before or 14 days after their index visit. Atorvastatin, fluvastatin, lovastatin, pravastatin, rosuvastatin, simvastatin, and pitavastatin were included. Pharmacy data sources were also used to identify patients receiving antiplatelet therapy, including aspirin, clopidogrel, prasugrel, ticagrelor, or dipyridamole. Patients receiving aspirin outside the VA were identified using the non-VA medication field in the medical record. Patients receiving concomitant anticoagulation with warfarin or direct thrombin inhibitors (rivaroxaban, apixaban, or dabigatran) were excluded from the analysis of antiplatelet therapy.
We first compared patient, facility, provider, and system-of-care characteristics among the 4 groups using analysis of variance for continuous variables and the chi-square test for categorical variables. To assess the impact of illness burden on receipt of therapy, we calculated a mean diagnostic cost group relative risk score (RRS) for each patient. Diagnostic cost group RRS is a ratio of the predicted cost to the mean cost and has been used as a measure of illness burden. For example, a patient with an RRS of 2 is expected to be twice as costly, with an illness burden twice as high as an “average” patient.
For each group, 4 measures were assessed: (1) hypertension control (BP <140/90 mm Hg); (2) glycemic control (A1c <7.0% among diabetic patients); (3) use of statin therapy, and (4) use of antiplatelet therapy. The composite of all 4 measures, termed optimal medical therapy (OMT), was our primary outcome. Frequency of receipt of each measure was calculated by dividing the number of patients in each category achieving the measure by the total number of patients eligible for the measure. We assessed the frequency of OMT and each individual measure in the 4 groups and comparison among groups was performed using the chi-square test.
Multivariate hierarchical logistic regression was performed to determine whether PAD alone, ICVD alone, or PAD + ICVD was associated with a lower or higher likelihood of receipt of OMT or its components compared with CHD. Covariates used for adjustment included age, gender, race (whites vs others), a history of hypertension, diagnostic cost group RRS (continuous), receipt of care at a teaching versus nonteaching facility, patient assignment to a physician versus nonphysician primary care provider, number of primary care provider (PCP) visits within 1 year before the index visit, and provider panel size. For BP <140/90 mm Hg, results were also adjusted for proportion of days covered with antihypertensive medication (a marker of medication adherence). We also adjusted our analyses for clustering of patients at the facility level in our regression models using generalized linear latent and mixed models.
Because the VA system stipulates a target A1c in diabetic patients of <9% as a performance measure, we performed sensitivity analysis with A1c <9% as the outcome in patients with diabetes in each of the 4 groups. We also evaluated the use of high-intensity statin therapy in our study cohort based on their most recent statin fill. High-intensity statin therapy was defined as daily statin intensity associated with ≥50% low-density lipoprotein cholesterol (LDL-C) reduction (atorvastatin 40 to 80 mg/day or rosuvastatin 20 to 40 mg/day).
We conducted the analyses with SAS, version 9.1.3 (SAS Institute Inc, Cary, North Carolina) and Stata (StataCorp), version 11 (College Station, Texas). The protocol was approved by the Institutional Review Boards at Baylor College of Medicine and the Michael E. DeBakey VA Medical Center.
Results
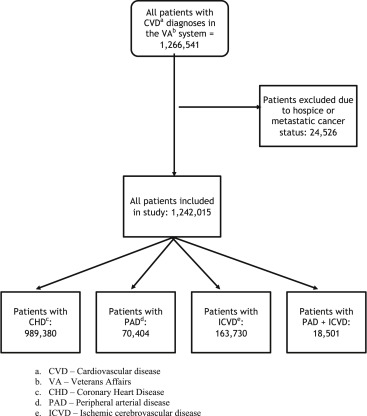
The study flow diagram is shown in Figure 1 . Our final cohort included 1,242,015 veterans with CVD. Of this group, 989,380 (79.7%) had CHD, 70,404 (5.7%) had PAD alone, 163,730 (13.2%) had ICVD alone, and 18,501 (1.5%) had PAD + ICVD. For analysis of glycemic control (A1c <7%), 561,769 patients (45.2%) with diabetes were evaluated. In the antiplatelet analysis, 175,727 patients (14.2%) taking anticoagulant medications (warfarin, rivaroxaban, apixaban, and dabigatran) were excluded.
Baseline characteristics of patients in each group are summarized in Table 1 with mean age >70 years, >95% patients being men and over 70% being white. Over 70% were seen by a physician provider. The PAD + ICVD group had the highest mean diagnostic cost group RRS of 2.46 and highest number of primary care visits (5.48 visits) in 12 months before the index visit. Patients with CHD had better ; PCP = primary care provider-C control with 74.9% of patients with LDL-C <100 mg/dl than other groups.
| Variable | CHD (n = 989,380) | PAD (n = 70,404) | ICVD (n = 163,730) | PAD + ICVD (n = 18,501) | p-Value |
|---|---|---|---|---|---|
| Age (years, mean/SD) | 72.3 ± 10.5 | 70.3 ± 10.6 | 70.4 ± 11.6 | 72.2 ± 9.8 | <0.0001 |
| Men | 973403 (98.4%) | 68824 (97.8%) | 156513 (95.6%) | 18079 (97.7%) | <0.0001 |
| White | 772830 (78.1%) | 51257 (72.8%) | 116199 (71.0%) | 14213 (76.8%) | <0.0001 |
| Black | 96543 (9.8%) | 11422 (16.2%) | 28735 (17.6%) | 2616 (14.1%) | <0.0001 |
| Other | 22328 (2.3%) | 1454 (2.1%) | 3934 (2.4%) | 355 (1.9%) | <0.0001 |
| Unknown | 97679 (9.9%) | 6271 (8.9%) | 14862 (9.1%) | 1317 (7.1%) | 0.002 |
| Diagnostic cost group RRS, mean ± SD | 1.91 ± 2.96 | 1.96 ± 2.83 | 1.95 ± 2.72 | 2.46 ± 3.39 | <0.0001 |
| Receiving care from a physician provider | 746596 (75.5%) | 52811 (75.0%) | 123778 (75.6%) | 14036 (75.9%) | 0.099 |
| Receiving care at a teaching facility | 387403 (39.2%) | 28531 (40.5%) | 69475 (42.4%) | 8083 (43.7%) | <0.0001 |
| Number of PCP visits in 12 months prior to the index primary care visit, mean ± SD | 4.68 ± 5.23 | 4.82 ± 5.06 | 4.82 ± 5.06 | 5.48 ± 5.39 | <0.0001 |
| Diabetes mellitus | 461465 (46.6%) | 31165 (44.3%) | 60913 (37.2%) | 8226 (44.5%) | <0.0001 |
| Hypertension | 812939 (82.2%) | 57533 (81.7%) | 133983 (81.8%) | 16479 (89.1%) | <0.0001 |
| Index LDL-C (mg/dL), mean ± SD | 84.7 ± 31.9 | 92.4 ± 32.9 | 92.6 ± 32.9 | 88.9 ± 32.3 | <0.0001 |
| Index LDL-C < 100 mg/dL | 633549 (74.9%) | 39151 (64.6%) | 89086 (64.5%) | 11183 (69.4%) | <0.0001 |
| Receiving non-statin lipid lowering agent | 109211 (11.0%) | 5311 (7.5%) | 10786 (6.6%) | 1578 (8.5%) | <0.0001 |
Of the risk factors studied, glycemic control (A1C <7%) was poorest among the individual measures studied. The largest disparity between groups was in antiplatelet use. Patients with PAD alone were least likely to receive OMT and the individual measures. Patients with PAD alone, ICVD alone, and PAD + ICVD were overall less likely to receive OMT compared with patients with CHD (24.4%, 31.5%, 37.0%, respectively, vs 37.5%; p <0.0001; Table 2 ).
| Measure | CHD (n = 989,380) ∗ | PAD Alone (n = 70,404) | ICVD Alone (n = 163,730) | PAD + ICVD (n = 18,501) | p-Value |
|---|---|---|---|---|---|
| BP <140/90 mm Hg | 79.8% | 75.6% | 76.5% | 73.5% | 0.07 |
| Statin use | 71.5% | 59.1% | 62.3% | 73.3% | <0.0001 |
| A1c < 7.0% among diabetics | 50% | 49.4% | 54.4% | 53.1% | <0.0001 |
| Antiplatelet use | 84.4% | 66.0% | 75.5% | 84.6% | 0.04 |
| Composite (optimal medical therapy † | 37.5% | 24.4% | 31.5% | 37.0% | <0.0001 |
∗ Patient with PAD or ICVD or PAD + ICVD with concomitant CHD included in the CHD category.
† Composite of hypertension control (BP <140/90 mm Hg), statin use, antiplatelet use, and diabetes control (A1c <7.0%) in diabetics.
After adjustment, patients with PAD alone and ICVD alone were less likely to receive OMT, hypertension control, statin therapy, and antiplatelet therapy, compared with patients with CHD. Patients with PAD + ICVD were equally likely to receive OMT, statin therapy, and antiplatelet therapy, compared with patients with CHD. However, patients with ICVD alone and those with PAD + ICVD were more likely to achieve glycemic control compared with patients with CHD ( Table 3 ).
| Outcome | CHD (n = 989,380) ∗ | PAD Alone (n = 70,404) | ICVD Alone (n = 163,730) | PAD + ICVD (n = 18,501) | |||
|---|---|---|---|---|---|---|---|
| Ref | Unadjusted OR (95% CI) | Adjusted OR (95% CI) † | Unadjusted OR (95% CI) | Adjusted OR (95% CI) † | Unadjusted OR (95% CI) | Adjusted OR (95% CI) † | |
| BP <140/90 mm Hg | Ref | 0.77 (0.75-0.78) | 0.78 (0.76-0.79) | 0.81 (0.80-0.82) | 0.82 (0.81-0.83) | 0.70 (0.68-0.73) | 0.74 (0.72-0.77) |
| Statin use | Ref | 0.65 (0.64-0.66) | 0.53 (0.53-0.54) | 0.69 (0.68-0.70) | 0.63 (0.63-0.64) | 1.10 (1.06-1.13) | 0.98 (0.95-1.02) |
| A1c <7.0 among diabetics | Ref | 1.08 (1.06-1.10) | 1.00 (0.98-1.03) | 1.40 (1.38-1.42) | 1.22 (1.20-1.24) | 1.19 (1.14-1.23) | 1.14 (1.09-1.19) |
| Antiplatelet use | Ref | 0.36 (0.35-0.36) | 0.34 (0.34-0.35) | 0.57 (0.56-0.57) | 0.60 (0.59-0.61) | 1.01 (0.97-1.06) | 0.95 (0.91-1.00) |
| Composite (optimal medical therapy) ‡ | Ref | 0.54 (0.53-0.55) | 0.54 (0.53-0.55) | 0.76 (0.76-0.77) | 0.77 (0.76-0.78) | 0.98 (0.95-1.01) | 0.97 (0.94-1.00) |
∗ Patient with PAD or ICVD or PAD + ICVD with concomitant CHD were included in the CHD category.
† Adjusted for age, gender, race (whites vs others), a history of hypertension, diagnostic cost group relative risk score (continuous) of patients, teaching versus nonteaching facility, physician versus nonphysician provider, number of PCP visits 1 year before, provider panel size and clustering at the level of the facility. For BP <140/90 mm Hg, results were also adjusted for proportion of days covered with antihypertensive medication. Analyses were further adjusted for clustering of patients at the facility level.
‡ Composite of hypertension control (BP <140/90 mm Hg), statin use, antiplatelet use, and diabetes control (A1c <7.0% in diabetics).
We also performed sensitivity analyses ( Supplementary Table 3a and 3b ) with a higher A1c threshold of <9% and found that glycemic control increased from approximately 50% to 90% in all groups. We also evaluated high-intensity statin therapy use and found that 37.0% of patients in our overall cohort were receiving appropriate high-intensity statin therapy with the highest frequency noted in patients with CHD (39.8%) and lowest in patients with PAD alone (23.2%; Supplementary Table 3a ).
Stay updated, free articles. Join our Telegram channel

Full access? Get Clinical Tree


