FIGURE 24.1. Arteriogram of atherosclerotic renal artery stenosis. The lesions are located in the proximal right and left renal artery segments and are associated with significant aortic involvement. There is poststenotic dilatation distal to the left renal artery lesion.
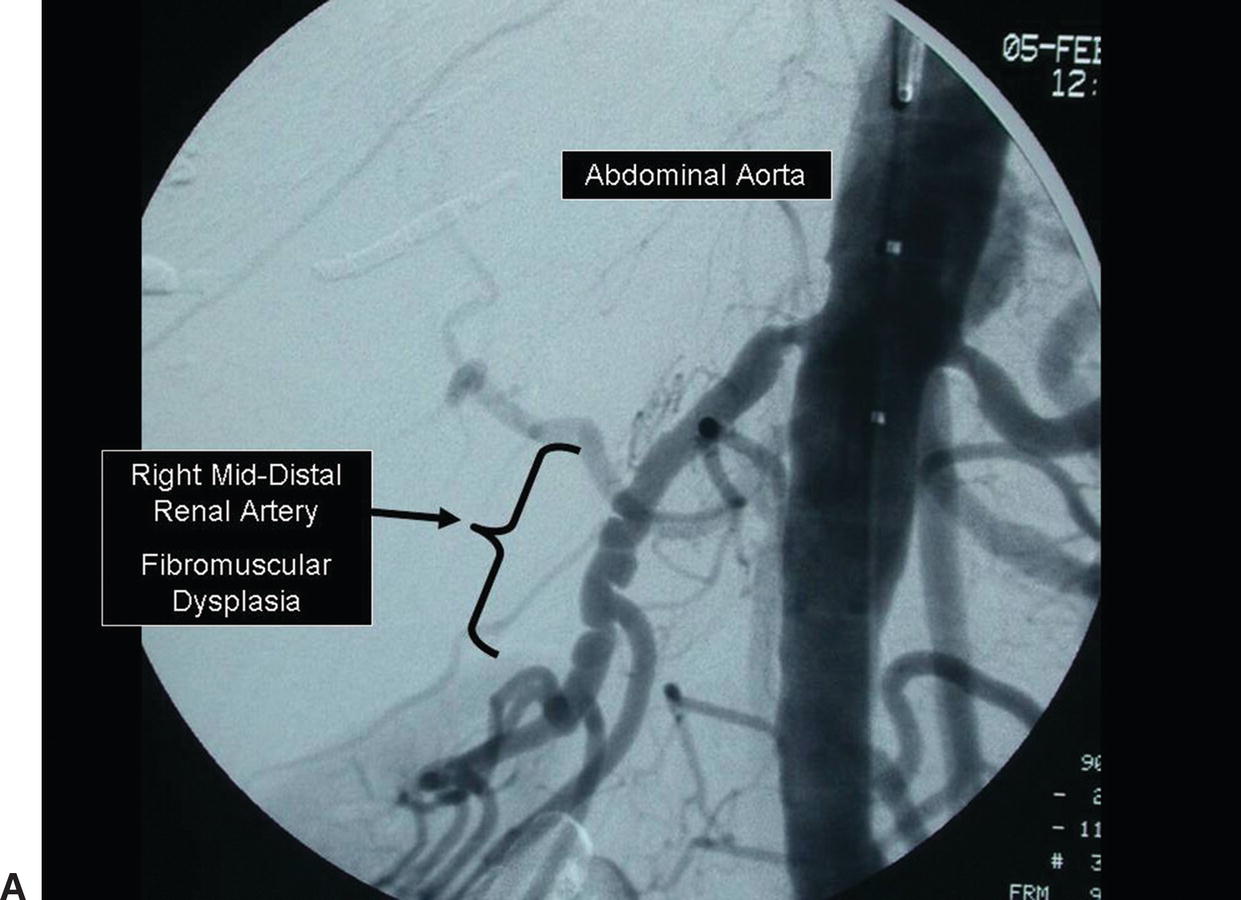
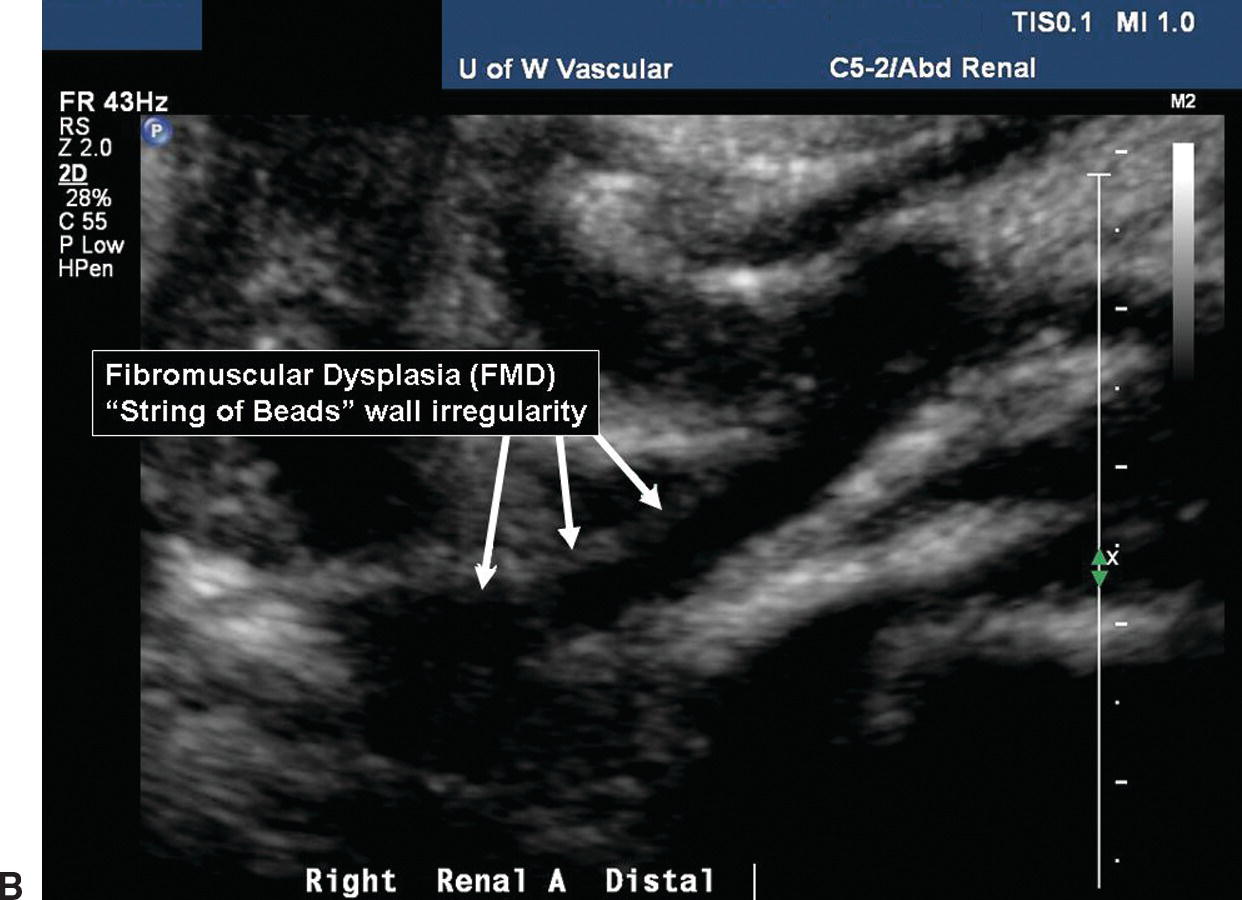
FIGURE 24.2. A,Arteriogram of renal artery fibromuscular dysplasia (FMD). The “string-of-beads” lesion involves the middle and distal segments of the renal artery. B,B-mode image of FMD in a distal renal artery.
Occlusive disease of the renal arteries may result in hypertension or ischemic nephropathy. Hypertension affects about 50 million individuals in the United States, and the proportion with a renovascular etiology is in the range of 1% to 6%.2,3 However, the prevalence of renovascular hypertension in patients with severe hypertension (diastolic blood pressure >105 mm Hg) may be as high as 30% to 40%.4 Ischemic nephropathy can be defined as a progressive decline in renal function secondary to global renal ischemia. It has been estimated that 60,000 to 120,000 patients in the United States have azotemia on this basis, and ischemic nephropathy may account for 5% to 15% of the patients who develop end-stage renal disease each year and require renal replacement therapy.5,6
Because many patients are found to have unilateral or bilateral renal artery stenosis without severe hypertension or renal insufficiency, it is clear that not all renal artery lesions are physiologically or clinically significant. Therefore, diagnostic tests must address both the anatomy and the physiology of renovascular disease.
DIAGNOSTIC EVALUATION FOR RENOVASCULAR DISEASE
The purpose of diagnostic testing in patients with suspected renal artery stenosis is to identify those individuals most likely to benefit from renal artery interventions for management of hypertension or renal insufficiency. Severe hypertension occurring in children or young adults is particularly likely to be renovascular in origin, although the etiology in these cases would be nonatherosclerotic. Other general features that suggest the presence of renovascular hypertension rather than essential hypertension are sudden onset of hypertension, an abdominal bruit, resistance to standard antihypertensive therapy with multiple medications, an atrophic kidney or size discrepancy between the two kidneys, flash pulmonary edema, and acute azotemia during treatment with angiotensin-converting enzyme inhibitors or angiotensin receptor blockers. Although these features can be used to increase the positive yield of screening tests, they do not have sufficient discriminative value to exclude patients from further diagnostic evaluation. Therefore, the principal criterion for renal artery disease screening remains the severity of hypertension, particularly the diastolic component.
Establishing a diagnosis of renovascular hypertension or ischemic nephropathy is especially complicated because these conditions involve physiologic as well as anatomic abnormalities. Historically, a variety of screening tests have been used for this purpose. Peripheral plasma renin assays, rapid-sequence intravenous pyelography, and isotope renography have all been tried, but they lack sufficient sensitivity to serve as reliable screening tests.7 Captopril renal scintigraphy is based on the pathophysiology of renovascular hypertension, and it has been advocated as a screening test.8 Contrast arteriography remains the “gold standard” for the anatomic diagnosis of renal artery disease, but it is unsuitable for use as a screening test owing to its high cost and invasive nature. The potential nephrotoxicity of radiographic contrast is another factor that has limited the use of arteriography in patients with renal artery disease and renal insufficiency.
Computed tomography angiography (CTA) and magnetic resonance angiography (MRA) are also being used to image the renal arteries. Although sensitivities and specificities of greater than 90% have been reported for detection of main renal artery stenosis by CTA, this approach may not be suitable for many patients because it requires relatively large volumes of iodinated contrast.9,10 Calcification in atherosclerotic plaques interferes with arterial imaging by CTA, and accessory renal arteries may not be reliably identified.11 MRA does not require injection of iodinated contrast and can produce images that appear similar to those of standard arteriograms. Gadolinium is a noniodinated contrast agent that improves the quality of MRA images and enhances the ability to identify accessory renal arteries. Excellent sensitivities and specificities have been reported for imaging of main renal artery stenoses by MRA, but the resolution in the smaller distal renal artery branches may not be optimal.12,13 The main disadvantage of MRA is that it may overestimate the severity of stenosis and produce false-positive results. As with all magnetic resonance studies, the test cannot be performed on patients with pacemakers or other metal devices. It is now recognized that there is an association between nephrogenic systemic fibrosis (NSF) and the use of gadolinium-based contrast agents in patients with renal insufficiency, with reported prevalences of up to 18%.14,15 Therefore, these contrast agents should be avoided in patients with abnormal renal function, particularly those with severe renal insufficiency and patients requiring hemodialysis.
When a hemodynamically significant renal artery stenosis is found, functional studies may be indicated to determine whether the lesion is truly responsible for the clinical findings. This can be accomplished by either renal vein renin determinations or split renal function studies. However, both of these methods are complex and invasive. The most commonly used approach is to measure the renin concentration in blood sampled from each renal vein to detect unilateral renin hypersecretion. The test is considered positive if there is a ratio of at least 1.5 to 1.0 when the stenotic and nonstenotic sides are compared. Split renal function studies are infrequently used and require cystoscopy with ureteral catheterization to measure urine flow and urinary concentration from each kidney. Unfortunately, these functional studies have numerous sources for error, and the results are not uniformly reliable, particularly in the presence of bilateral renal artery disease or renal artery stenosis involving a solitary kidney.5
Duplex ultrasound scanning was developed in the 1970s as a direct noninvasive method for evaluating the extracranial carotid arteries. Subsequent advances in ultrasound technology, particularly the availability of improved B-mode imaging systems, color-flow Doppler imaging, and lower-frequency ultrasound transducers, have extended the applications of duplex scanning to the more complex and deeply located vessels of the abdomen. Duplex scanning is currently the only method available in the noninvasive vascular laboratory for evaluating the renal arteries.
DUPLEX SCANNING TECHNIQUE
The principal challenge in renal duplex scanning is to locate the arteries and obtain satisfactory pulsed Doppler spectral waveforms using a favorable angle of insonation. Renal arteries are especially difficult to examine because of their small size, deep location, and variable anatomy. The effects of respiratory motion and overlying bowel gas can also limit the success of renal duplex scanning. Whereas some renal duplex examinations can be performed in 30 to 45 minutes, evaluating the entire renovascular system can be time consuming, and it is preferable to allow up to 1 hour for a routine renal duplex scan.
The general principles of renal duplex scanning are identical to those for other arterial sites that supply low-resistance vascular beds. The renal arteries are visualized by B-mode and color-flow imaging, the pulsed Doppler sample volume is placed within the vessels, and spectral waveform analysis is used to characterize the flow patterns and classify the severity of disease. A localized flow disturbance with a high-velocity jet indicates the presence of a high-grade stenosis. In addition to the renal artery evaluation, the renal veins and renal parenchyma are also evaluated as described in the following sections.
Equipment
Ultrasound evaluation of the aorta, renal arteries, renal veins, and kidneys requires a low-frequency, 2.5- to 3.0-MHz phased array or curved linear transducer to obtain adequate depth penetration. Color-flow imaging is extremely helpful when performing abdominal vascular duplex examinations, in order to help define anatomic relationships and identify blood vessels. In addition, it can be beneficial to have a stretcher that has a reverse Trendelenburg (feet-down) position, which will sometimes drop the bowel out of the scan plane and improve visualization of the deeper structures.
Patient Preparation
The main barrier to a successful abdominal duplex examination is bowel gas, so the focus of patient preparation is on efforts to minimize this problem. To maximize patient comfort and for optimal technical results, renal artery duplex examinations should be scheduled in the morning, preferably before 10:00 am. Whenever possible, have the patient fast for about 8 hours before the examination. If the study is scheduled as a first appointment in the morning, a low-residue diet on the day before the study and fasting after midnight are usually adequate. Smoking and gum chewing should be discouraged on the morning of the examination. Some laboratories employ additional methods such as a full bowel preparation (laxatives and enemas) or use of over-the-counter medicines containing simethicone. However, the effectiveness of these measures compared with fasting alone has not been proved.
Because the majority of patients take oral medications, they should be instructed to take these medications with small sips of water as directed. If food is recommended with the medication, or if the patient is diabetic, she or he should eat low-residue food in small amounts. About 5% of examinations will be incomplete because of bowel gas, depth of vessels, respiratory motion, or lack of patient cooperation. If the patient is not well prepared as outlined previously, a repeat scan after optimal preparation should be considered.
Examination Protocol
The renal duplex examination is always bilateral, unless a limited study is specifically requested. Some indications for a unilateral or limited renal duplex scan are known absence of a kidney (congenital or surgical), previously documented occlusion of a renal artery, and follow-up of a unilateral renal artery intervention. Position the patient on the examining table in the supine position with his or her arms resting comfortably at his or her side. The position of the technologist is equally important and somewhat unique for the renal duplex examination. Abdominal vascular scanning requires a significant amount of pressure with the transducer, and using proper ergonomic technique will reduce distractions due to shoulder, arm, wrist, and hand discomfort (Figs. 24.3 and 24.4). If visualization is poor owing to abdominal gas, firm downward pressure on the transducer into the abdomen will often disperse the gas and bring the vasculature closer to the transducer for enhanced image quality. However, it is important to be aware of the amount of pressure applied and the patient’s comfort level.
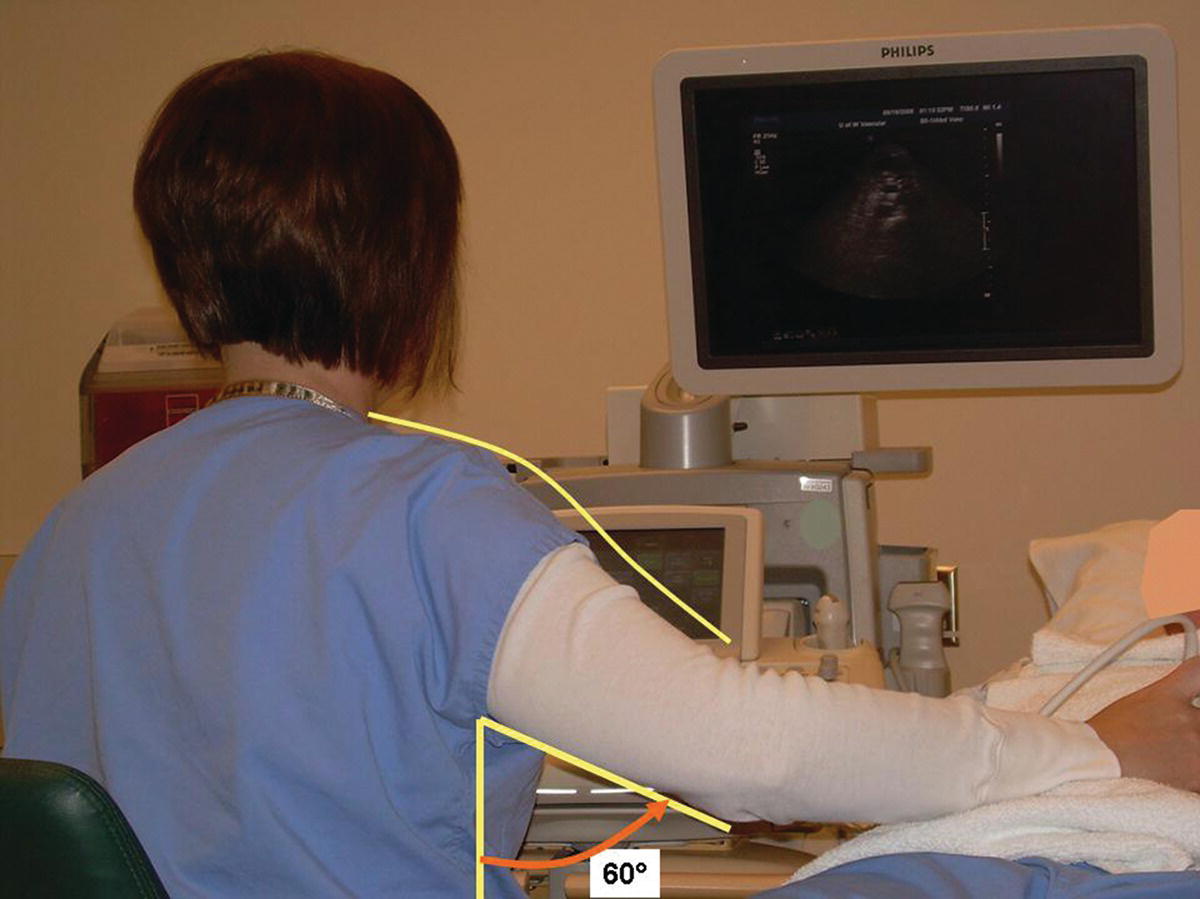
FIGURE 24.3. An ergonomically incorrect position for a technologist performing a renal artery duplex evaluation. The scanning arm is elevated at the shoulder and positioned away from the body.
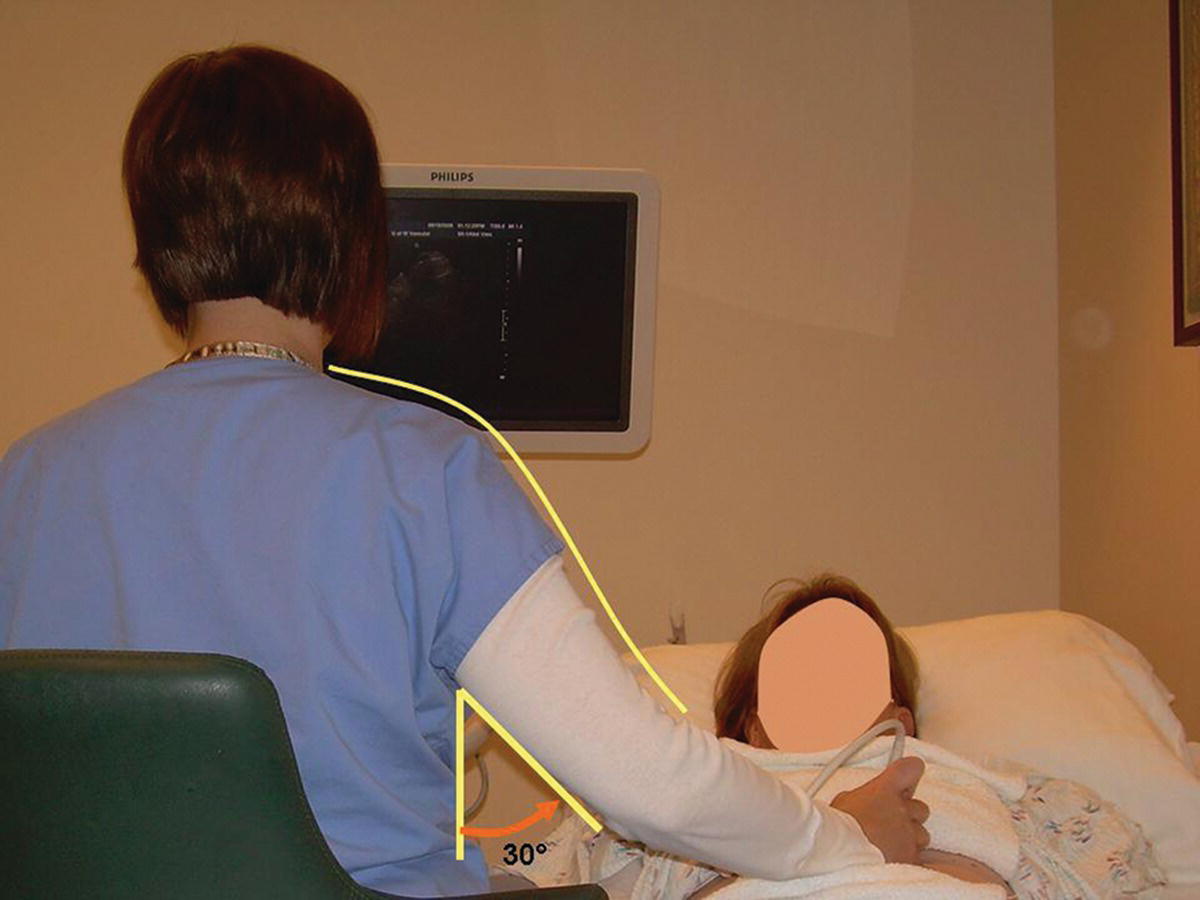
FIGURE 24.4. An ergonomically correct position for performing a renal artery duplex evaluation. The scanning arm is relaxed at the shoulder and held closer to the body (see Fig. 24.3).
When patient respirations are rapid or deep, excessive motion of the kidney and renal artery may occur. If the patient is able to cooperate and is not in respiratory distress, instruct her or him to take in a deep breath and either hold it or let it out part way and then hold it. This causes the kidney to move inferiorly for better visualization and provides a short time interval for recording more optimal images and spectral waveforms.
Abdominal Aorta and Branches
Starting in the midline, place the transducer in the subxiphoid position and visualize the proximal abdominal aorta and inferior vena cava (IVC) in the transverse plane. If bowel gas prevents imaging of the abdominal aorta from the midline, slide the transducer laterally to either side and angle back toward the midline to obtain better visualization. The spine lies immediately posterior to the aorta, providing a highly reflective echo interface and anatomic landmark (Fig. 24.5). When the transverse colon obscures visualization of the proximal abdominal aorta, slide the transducer superiorly onto the xiphoid process, increase the image depth, and use gentle pressure with the transducer. Often the proximal abdominal aorta and the celiac and superior mesenteric artery (SMA) origins can be visualized using this approach.
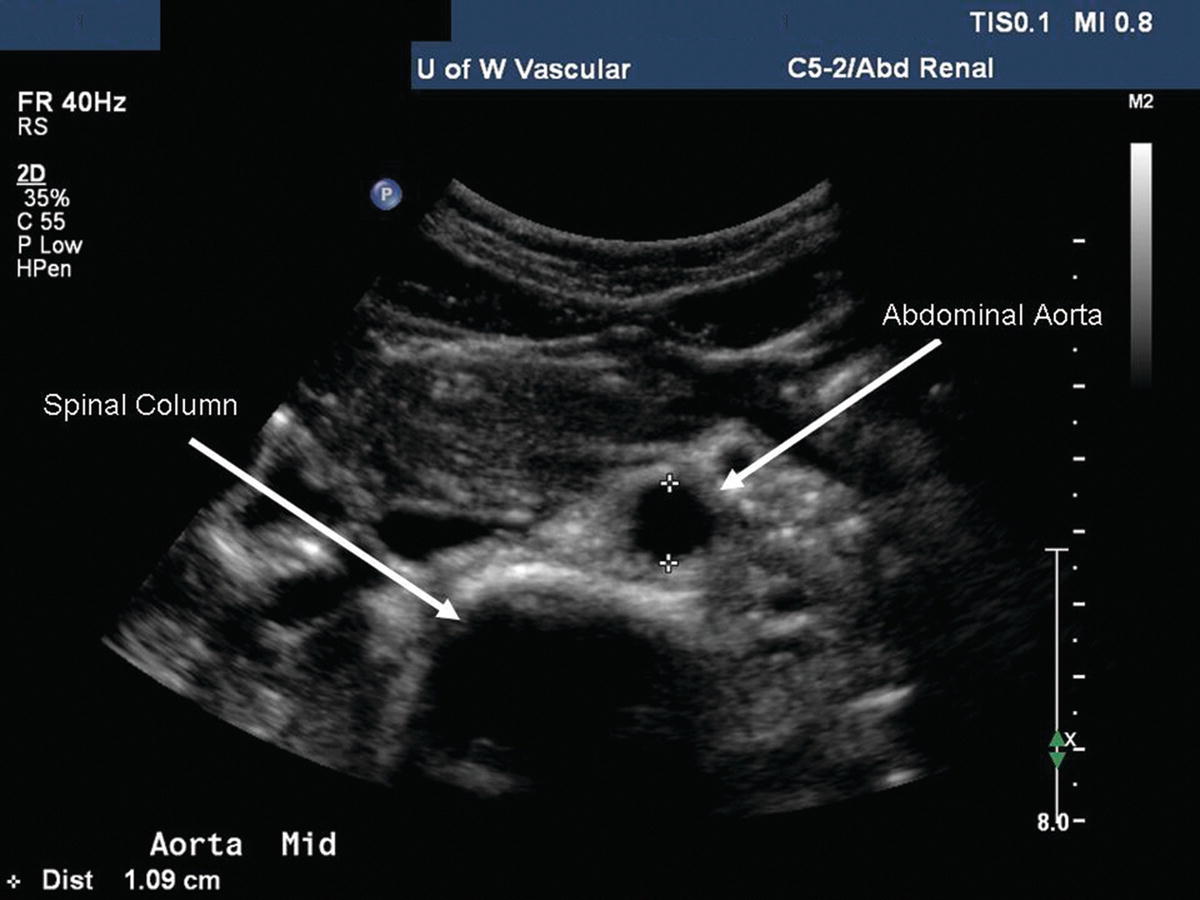
FIGURE 24.5. B-mode image of the abdominal aorta in transverse orientation. The spine is visualized posterior to the aorta providing a highly reflective echo interface (at about 5.0 cm depth) with acoustic shadowing.
Obtain diameter measurements of the proximal abdominal aorta at the level of the celiac and SMA origins. Continue scanning the aorta inferiorly until the bifurcation into the common iliac arteries is identified, measuring the aorta at the mid-(infrarenal) segment and again at the distal segment just above the iliac artery origins. Keep in mind that the aorta tapers, becoming smaller in diameter distally. If there is evidence of occlusive or aneurysmal disease in the abdominal aorta, evaluate it at this time. Perform Doppler evaluation of the aorta with the vessel in a longitudinal view, moving the pulsed Doppler sample volume along the length of the vessel. Use a small (1.5- to 2.0-mm) sample volume size and a 60-degree angle of insonation. Record a Doppler spectral waveform at the level of proximal (suprarenal), mid- (infrarenal), and distal (just superior to the bifurcation) abdominal aorta. Evaluate any areas of suspected abnormality with pulsed Doppler and document with spectral waveforms as appropriate. It is important to obtain a Doppler peak systolic velocity (PSV) in the abdominal aorta at the level of the SMA origin for use in calculating the renal-to-aortic ratio (RAR). Aortic PSVs are typically in the range of 80 to 100 cm/s at this level, although higher velocities are often observed in young normal individuals. The spectral waveform in the suprarenal aorta usually shows forward flow throughout diastole (low-resistance pattern); below the level of the renal arteries, a reverse flow component is present and there is less flow in diastole (high-resistance pattern). These changes in the aortic flow pattern are related to the normal low vascular resistance of the kidneys (Fig. 24.6).
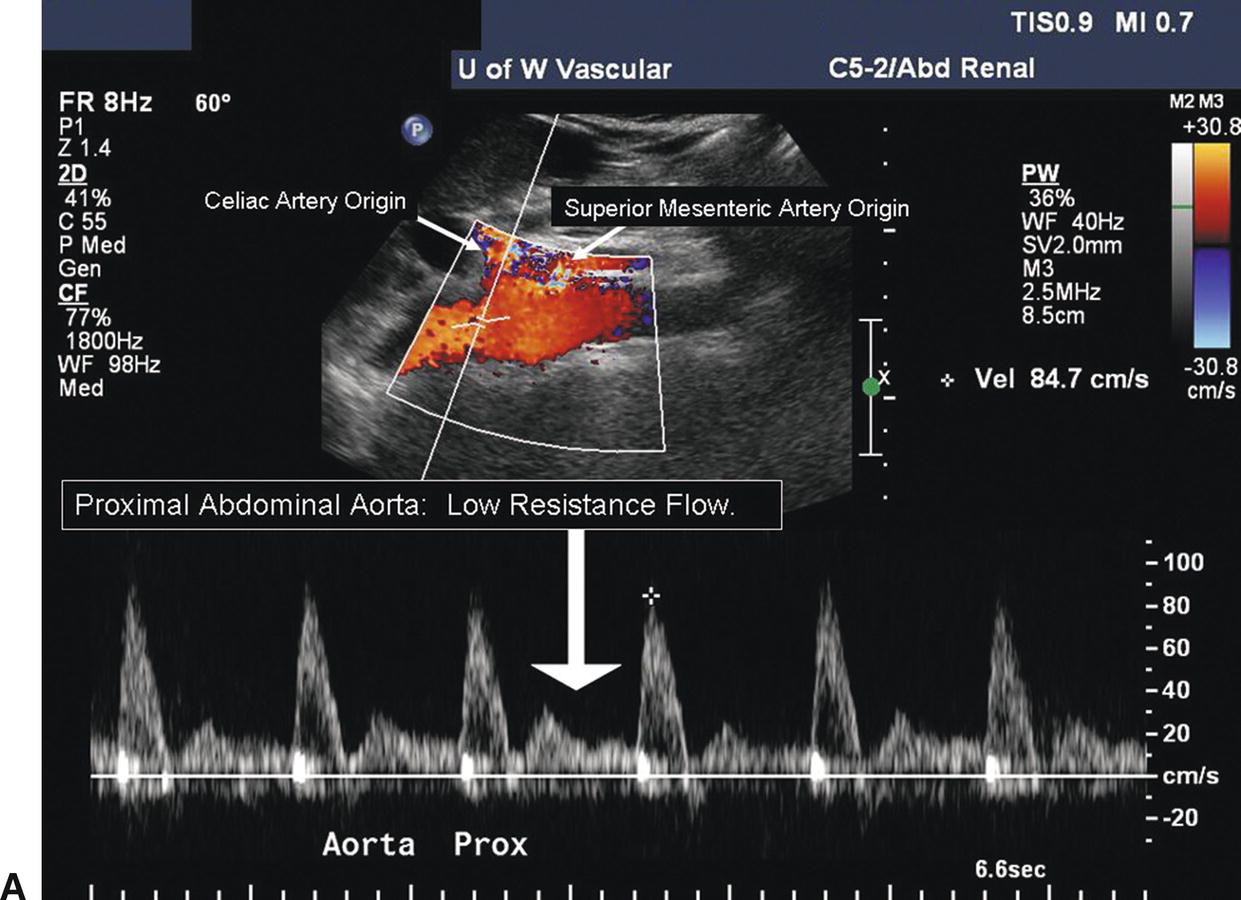
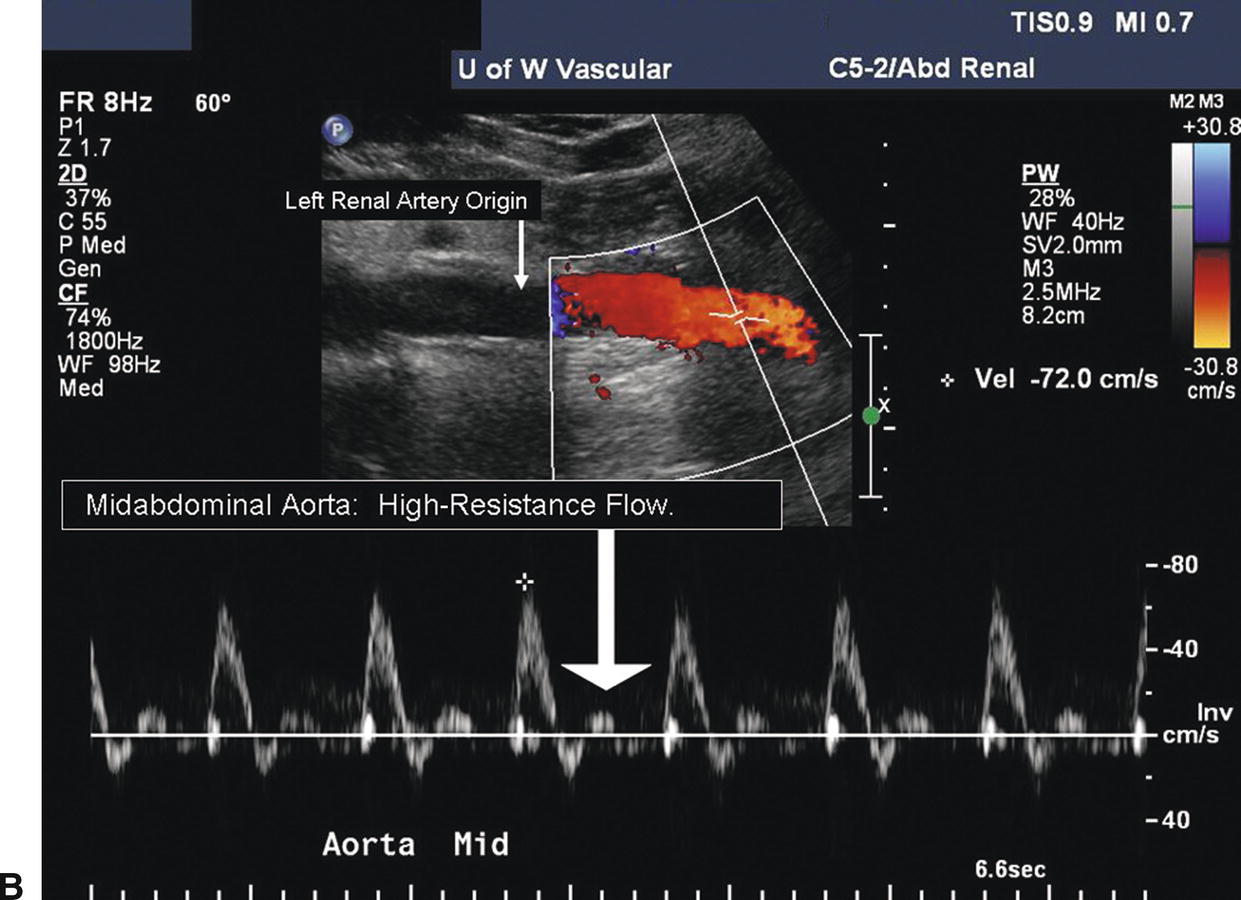
FIGURE 24.6. A,Duplex image demonstrates low-resistance spectral waveform contour in the abdominal aorta proximal to the renal artery origins. The Doppler sample volume is located at the level of the celiac and superior mesenteric artery origins. Forward flow is present throughout the cardiac cycle (arrow).) B,High-resistance spectral waveform in the abdominal aorta distal to the renal artery origins. The Doppler sample volume is in the midabdominal aorta, distal to the level of the left renal artery origin. The flow pattern is triphasic with a reverse-flow component and a final brief forward-flow phase (arrow).
After the abdominal aorta has been evaluated, return the transducer to the subxiphoid position with a transverse orientation and scan inferiorly until the first major branch of the abdominal aorta is identified. This will be the celiac artery originating from the anterior surface of the aorta just below the diaphragm. The SMA is the second major branch of the abdominal aorta and is located anteriorly about 1.0 to 2.0 cm below the celiac artery. A longitudinal view of the upper abdominal aorta often shows the origins of the celiac artery and SMA (Fig. 24.7A). A transverse view of the celiac artery is shown in Figure 24.7B. When viewed in a transverse plane, the SMA is a small round structure anterior to the abdominal aorta. At approximately the level of the renal artery origins, the SMA is separated from the aorta by the left renal vein, as shown in Figure 24.8.
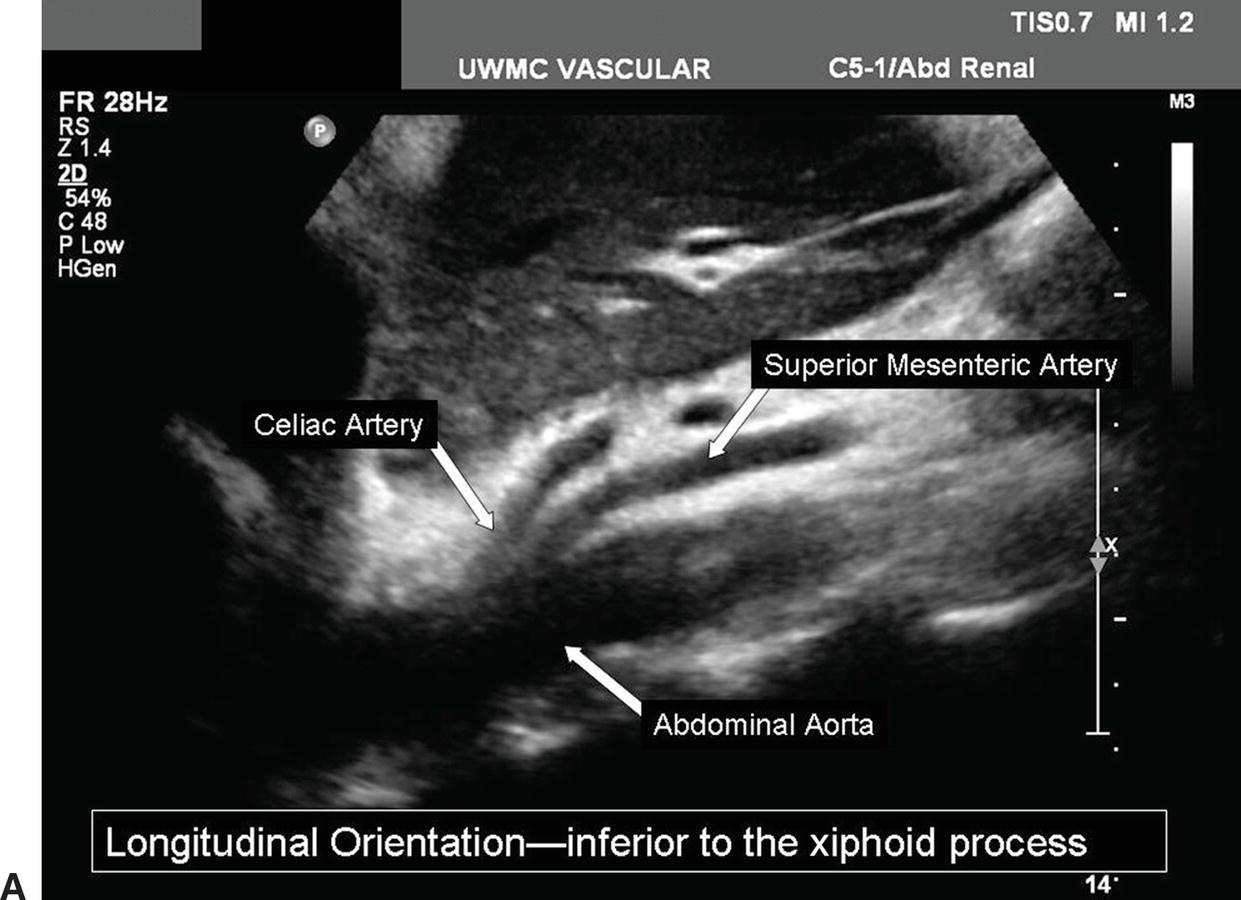
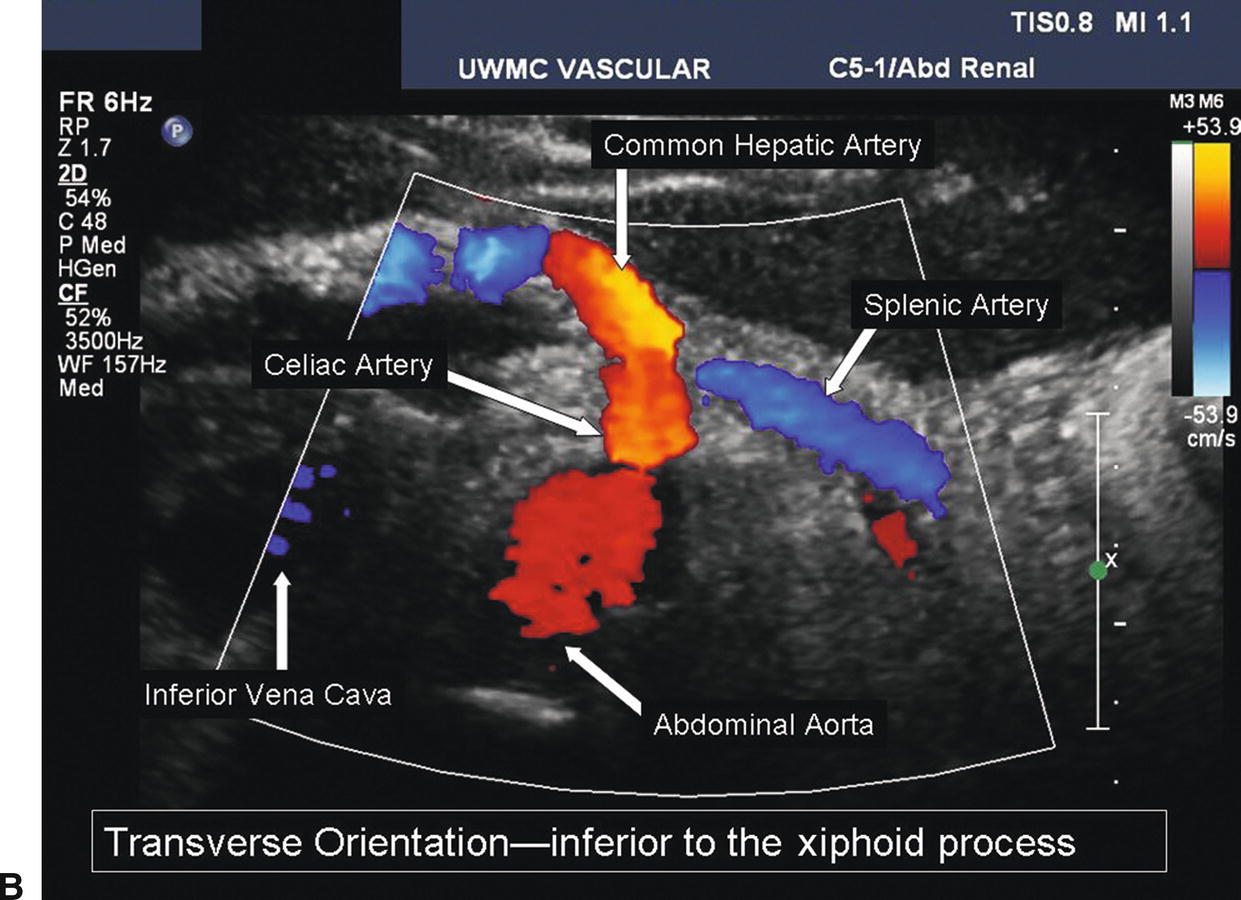
FIGURE 24.7. A,Longitudinal B-mode image of the proximal abdominal aorta shows the origins of the celiac and superior mesenteric arteries. B, Transverse duplex image of the abdominal aorta and the celiac artery, including the common hepatic and splenic artery branches.
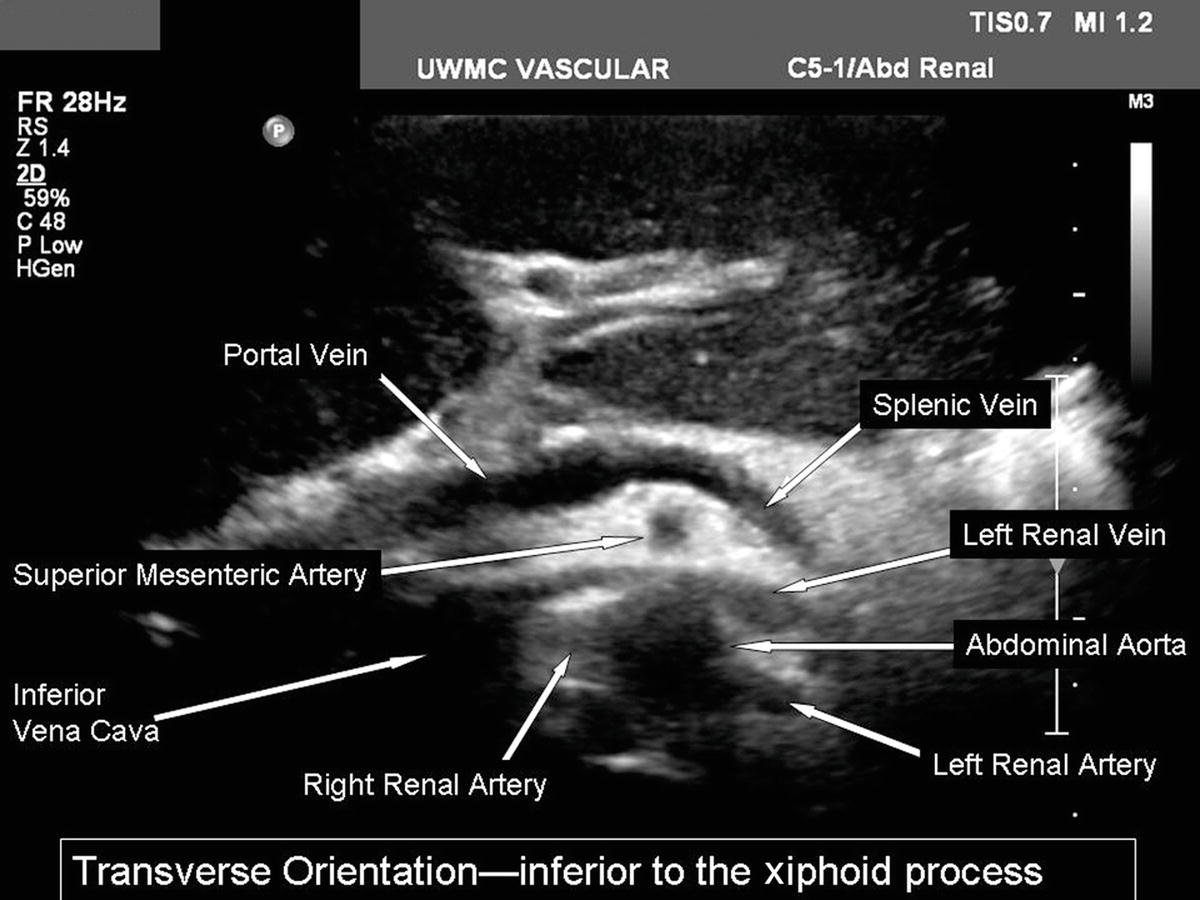
FIGURE 24.8. Transverse B-mode image of the structures at the level of the renal arteries. The left renal vein is seen running between the superior mesenteric artery and the aorta.
The inferior mesenteric artery (IMA) is the third and last anterior unpaired branch of the abdominal aorta and originates between the level of the renal arteries and the aortic bifurcation. The IMA is smaller than the celiac artery and SMA and runs inferiorly from the aorta and to the patient’s left. Whereas it is not necessary to scan the mesenteric arteries in detail during a renal duplex examination unless there is a specific indication, the celiac artery and SMA are relatively constant in location and provide helpful anatomic landmarks for finding the origins of the renal arteries. If a color Doppler bruit or aliasing is noted in the mesenteric arteries, it may be clinically useful to evaluate these vessels.
Renal Arteries and Veins
The renal arteries usually arise from the aorta just distal to the level of the SMA, although their location is variable. The right renal artery tends to originate from the lateral aspect of the aorta at about the 10-o’clock position in a transverse view, and it runs posterior to the IVC (retrocaval) toward the right kidney. The left renal artery arises from the lateral or posterolateral aspect of the aorta (the 3- or 4-o’clock position). These relationships are illustrated in Figure 24.9.
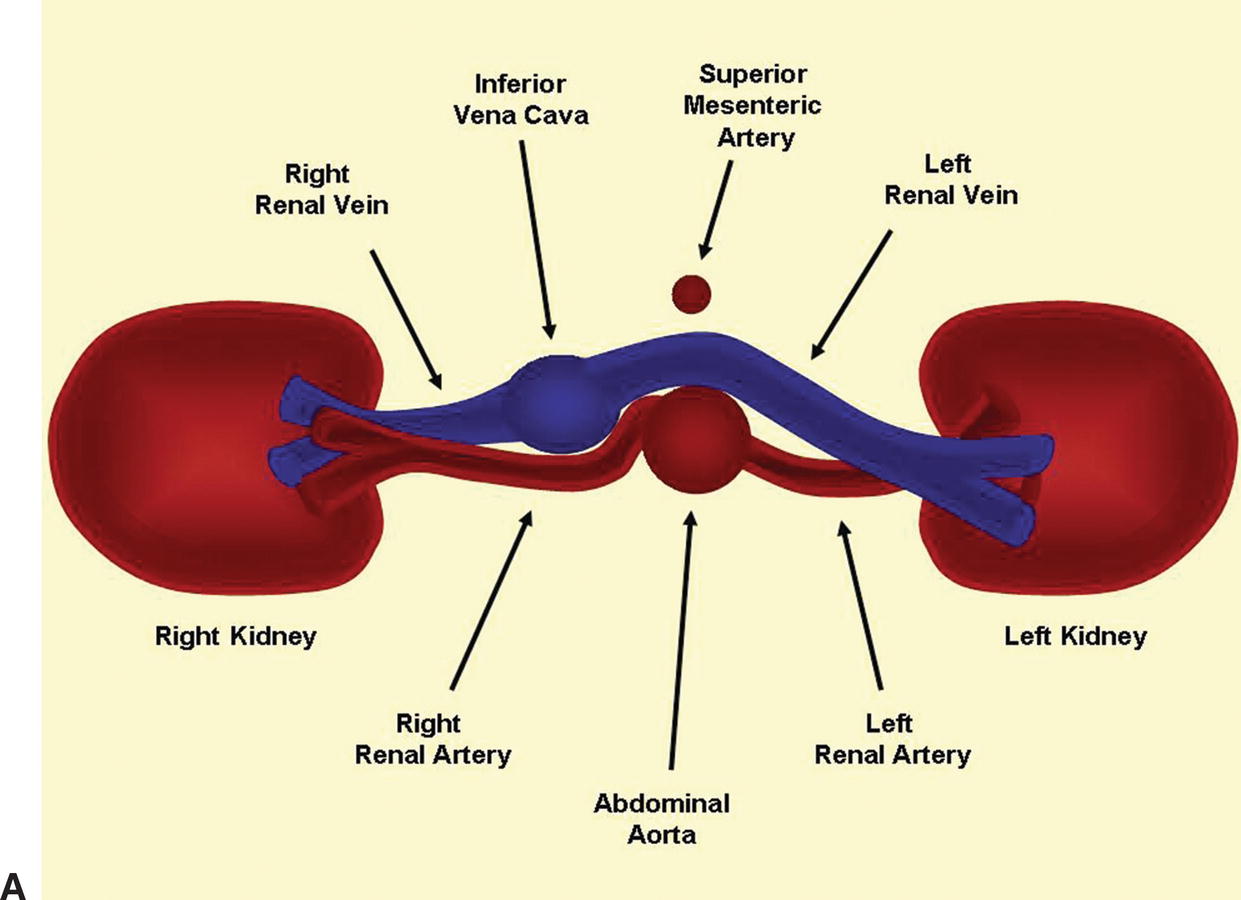
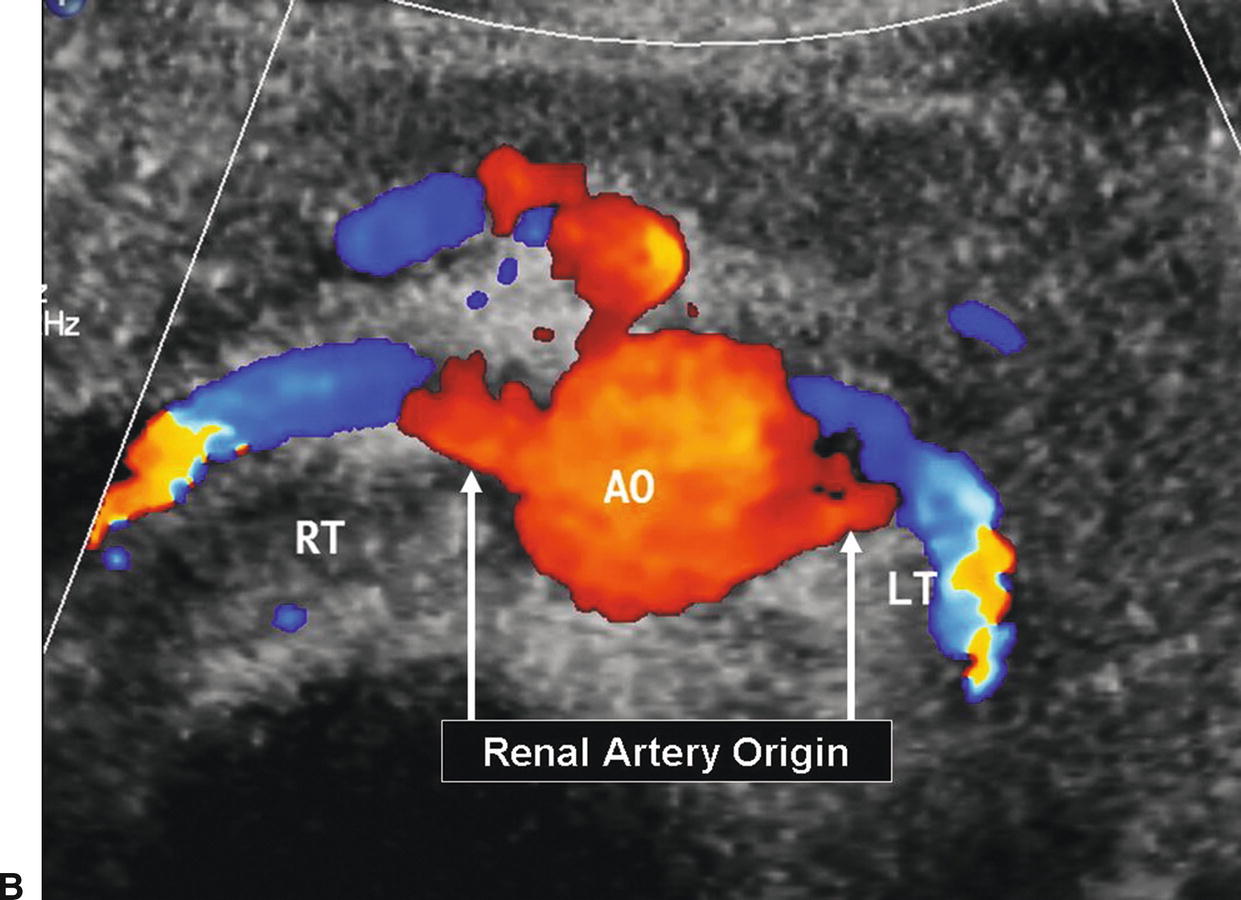
FIGURE 24.9. A, Cross-sectional diagram shows the typical relationships of the renal artery origins to the aorta, inferior vena cava, and renal veins. B, Corresponding transverse color-flow image of the abdominal aorta (AO), with the origins of the right (RT) and left (LT) renal arteries.
Both renal arteries lie posterior to their companion renal veins. Once they have been located with B-mode and color-flow imaging, evaluate the renal arteries throughout their length using a small (2.0-mm) pulsed Doppler sample volume. Sweeping the sample volume from the abdominal aorta directly into the renal artery is valuable, because atherosclerotic renal artery lesions are typically continuous with aortic plaque and involve the renal artery ostium (Fig. 24.10). Spectral waveforms are obtained at the origin and the proximal, middle, and distal portions of the right and left renal arteries (Fig. 24.11). Give special attention to any focal abnormalities such as high-velocity jets or aneurysmal changes. Figure 24.12 demonstrates the unusual appearance of a renal artery aneurysm. It is important to document the highest flow velocity in each renal artery, along with any flow disturbance distally (Fig. 24.13). The distal renal artery may be difficult to visualize with the patient in a supine position, and a lateral decubitus or lateral posterior oblique position may provide better ultrasound access. It is helpful to roll the patient onto his or her side when using the flank approach. An example of insonating the origin of the renal artery from a flank approach is shown in Figure 24.14. After evaluating the main renal arteries, attempt to locate and evaluate accessory renal arteries, which are present in up to 17% of kidneys (Fig. 24.15).16 A relatively common location for an accessory renal artery is arising from the right lateral aspect of the aorta around the level of the IMA and running anterior to the IVC to the inferior pole of the right kidney.
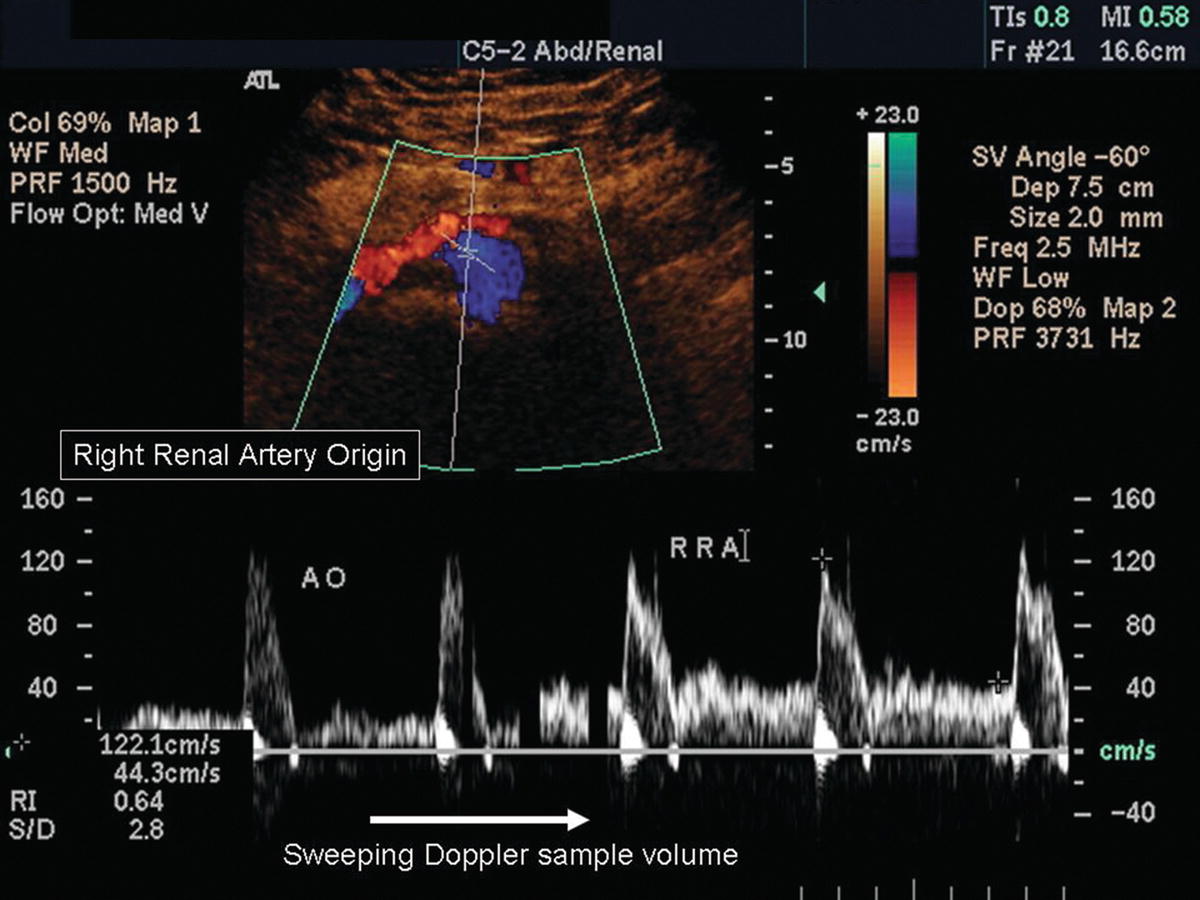
FIGURE 24.10. Spectral waveforms from the abdominal aorta and right renal artery. The sample volume is shown in the abdominal aorta on the color-flow image. In the spectral display, the sample volume is slowly moved from the aorta (AO) into the origin of the right renal artery (RRA), demonstrating no stenosis at this site.
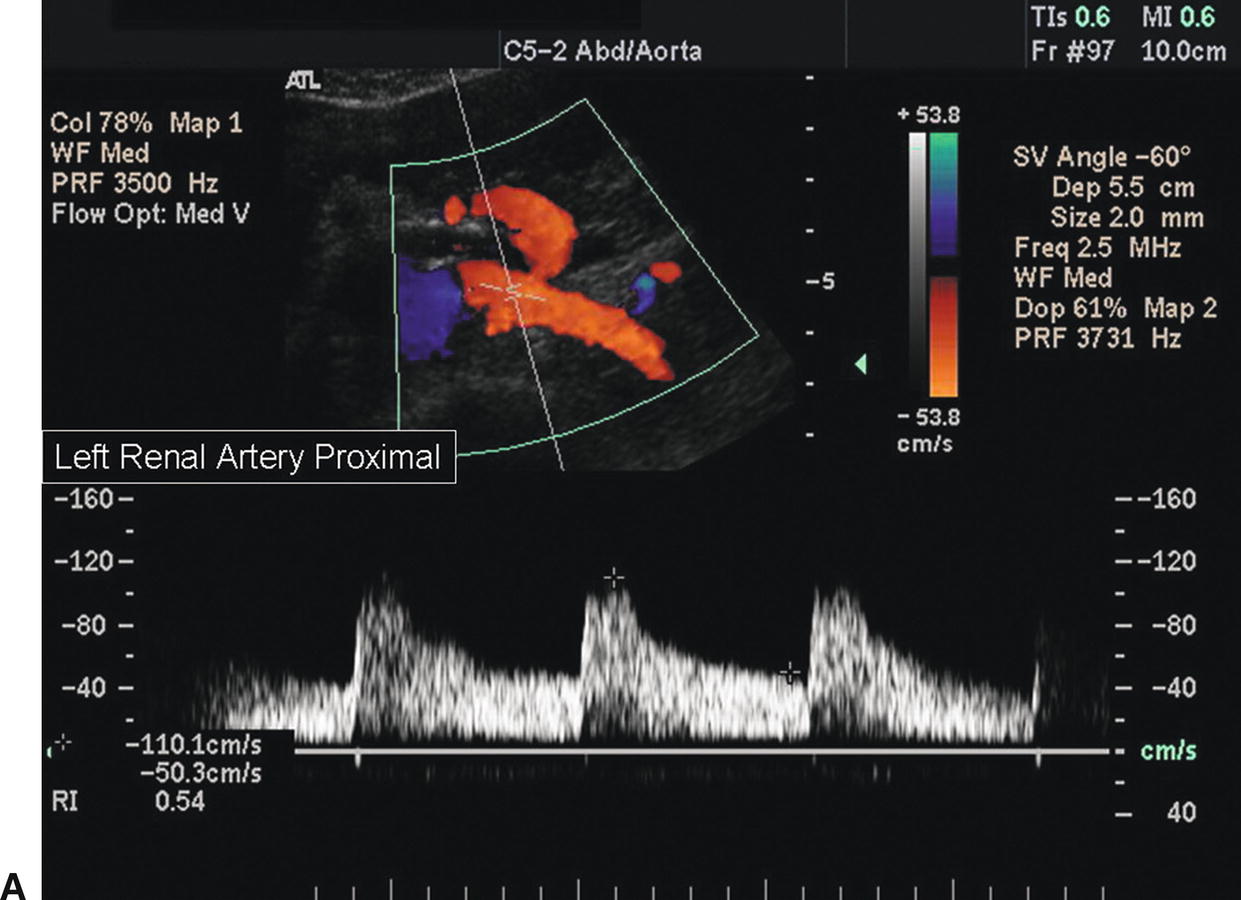
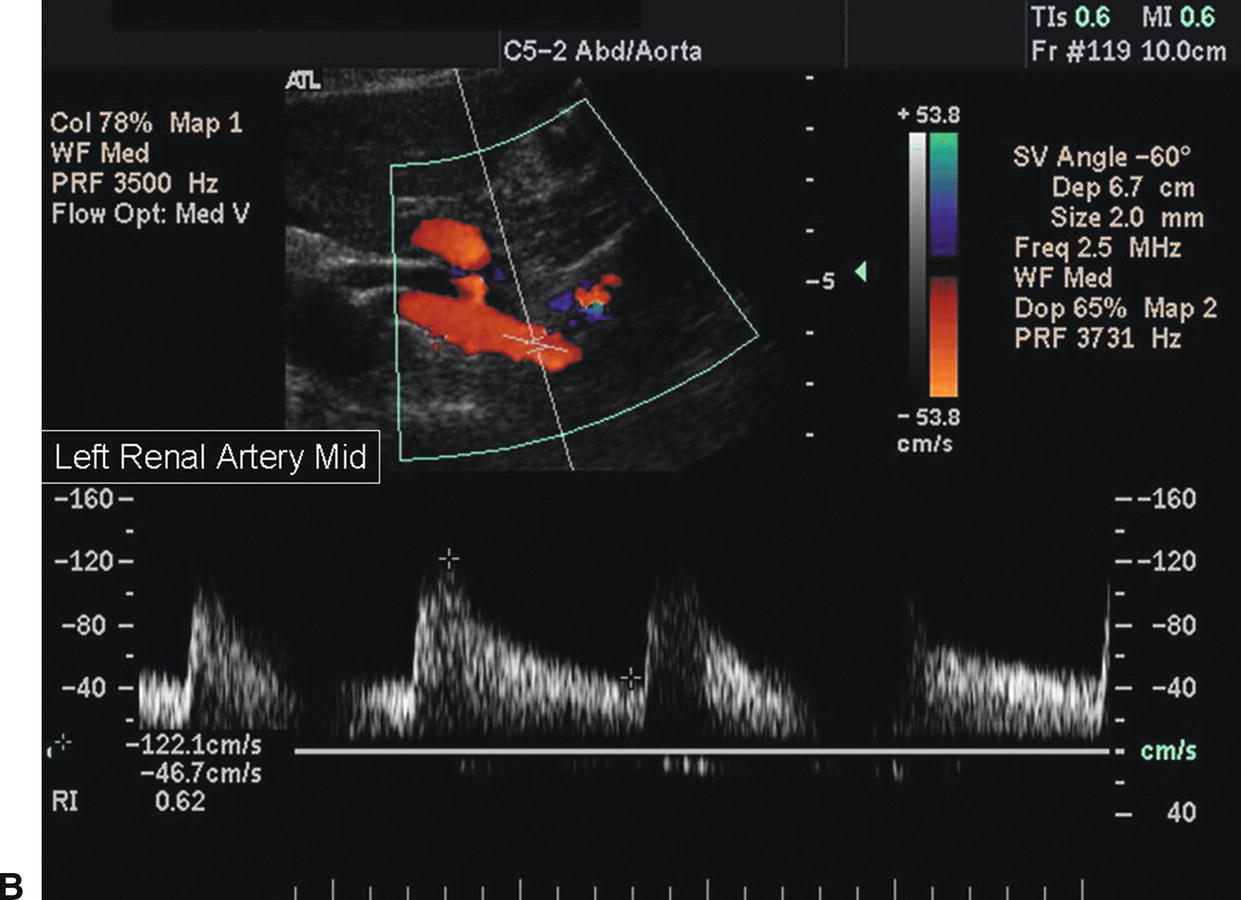
FIGURE 24.11. A, Normal spectral waveform from the proximal segment of the left renal artery. The peak systolic velocity (PSV) is 110 cm/s. B, Normal spectral waveform from the midsegment of the left renal artery. The PSV is 122 cm/s.
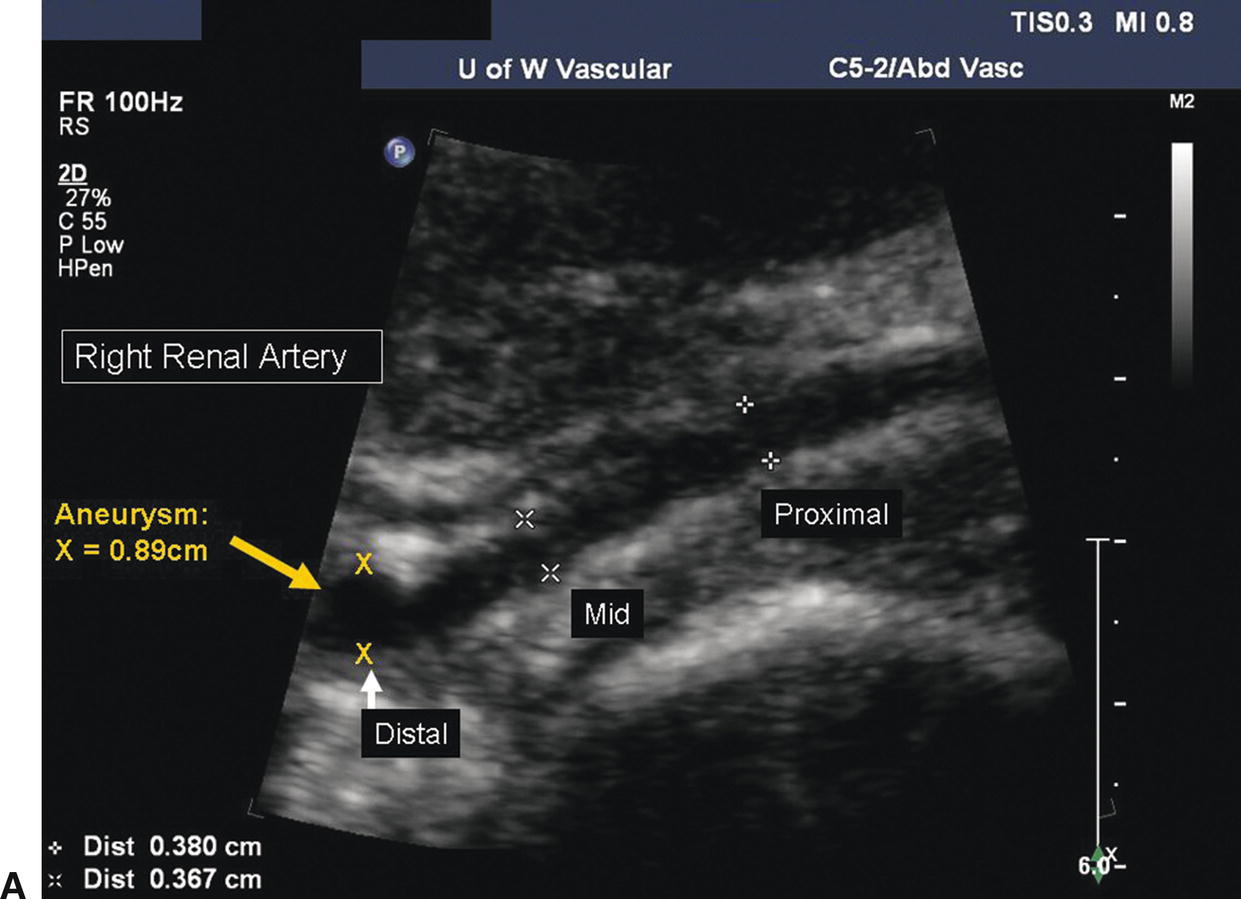
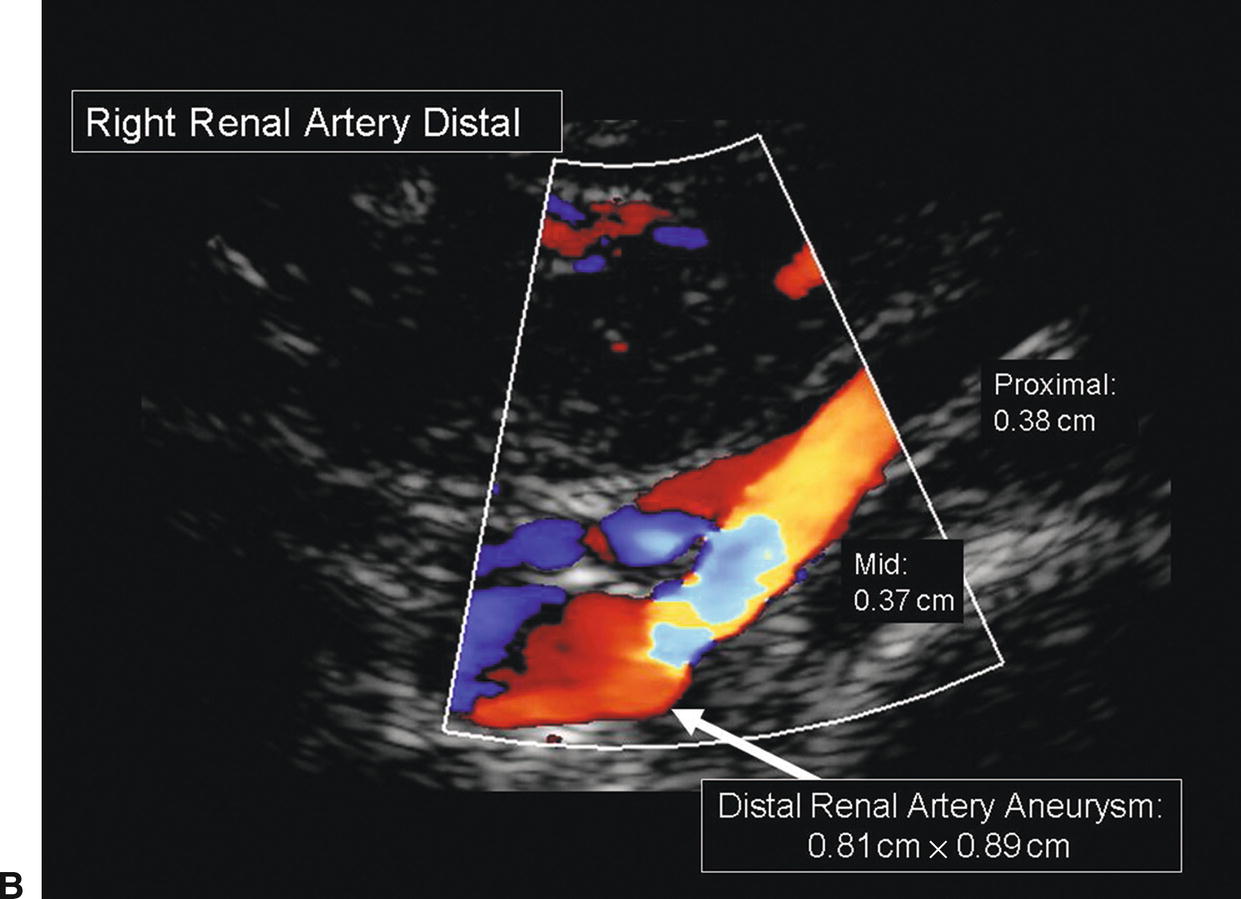
FIGURE 24.12. A,B-mode image of an aneurysm in the distal segment of the right renal artery. The proximal and midrenal arteries measure 0.37 to 0.38 cm in diameter; the distal renal artery measures 0.89 cm in diameter. B,Color-flow image of the same distal renal artery aneurysm.
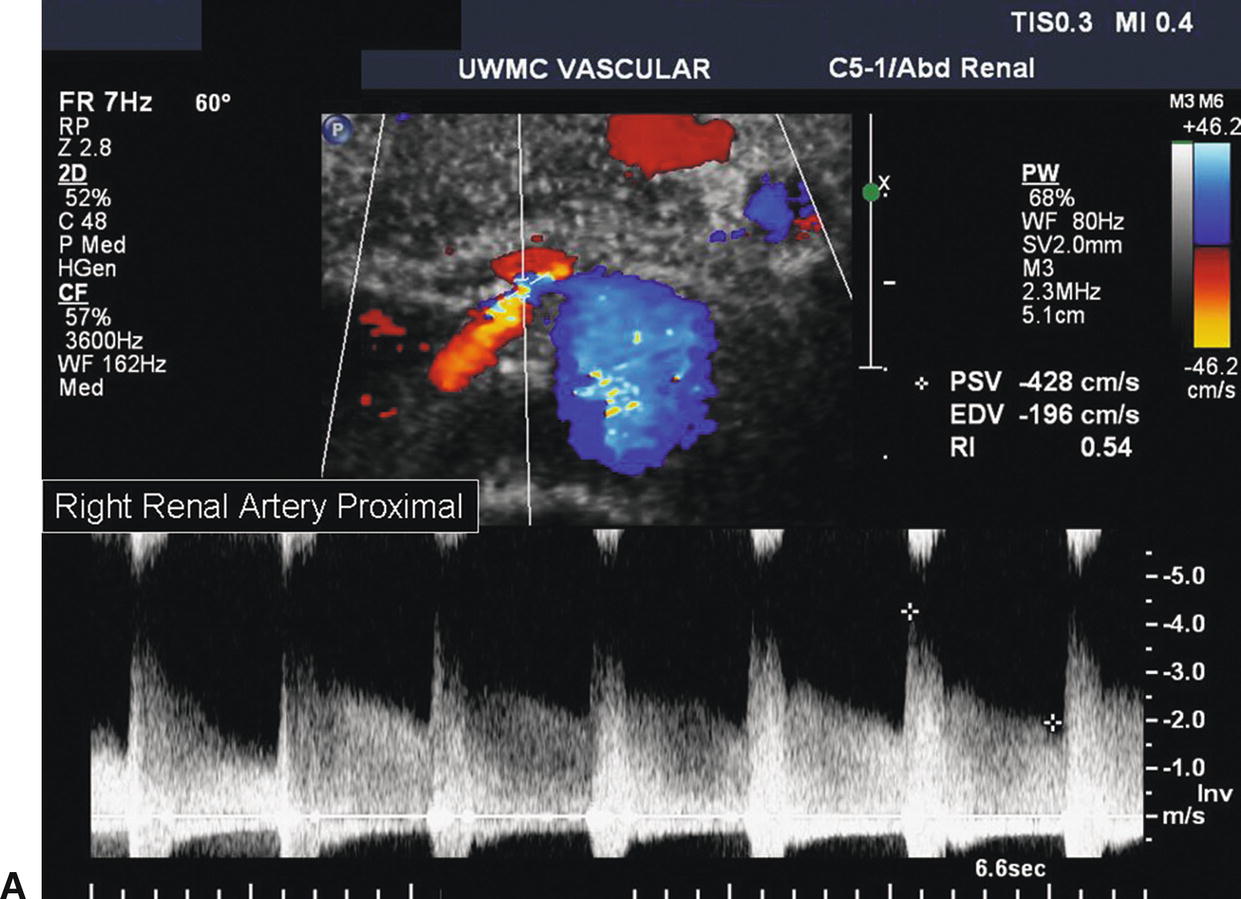
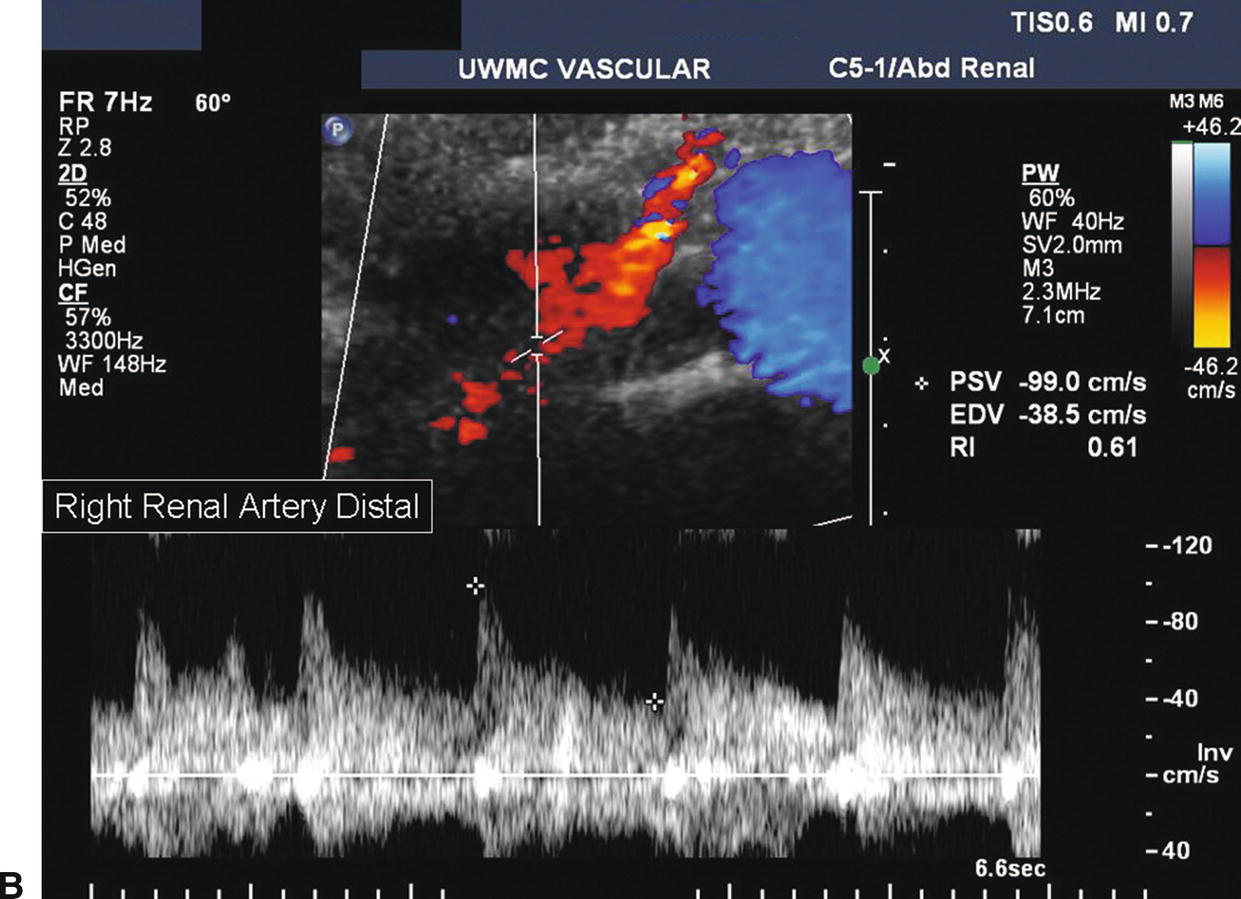
FIGURE 24.13. A,Abnormal spectral waveform from the proximal right renal artery. The PSV is 428 cm/s, and there is a visible Doppler bruit indicative of a hemodynamically significant stenosis. B,Spectral waveform from the distal right renal artery. Poststenotic turbulence is present with a PSV of 99 cm/s.
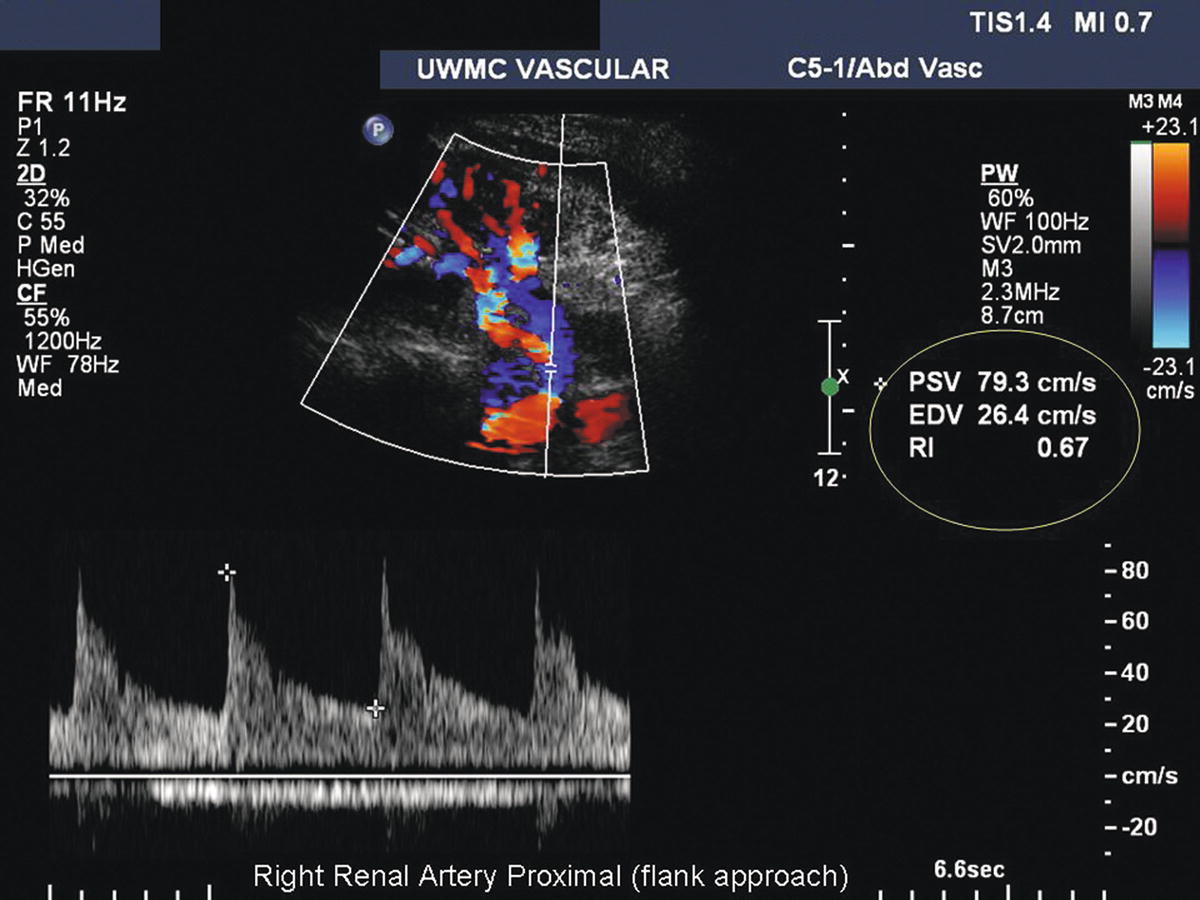
FIGURE 24.14. This right renal artery is being insonated from the flank approach. The kidney is near the top of the image, and the abdominal aorta is near the bottom. The spectral waveform is taken from the right renal artery origin using a 0-degree Doppler angle, resulting in a PSV of 79 cm/s.
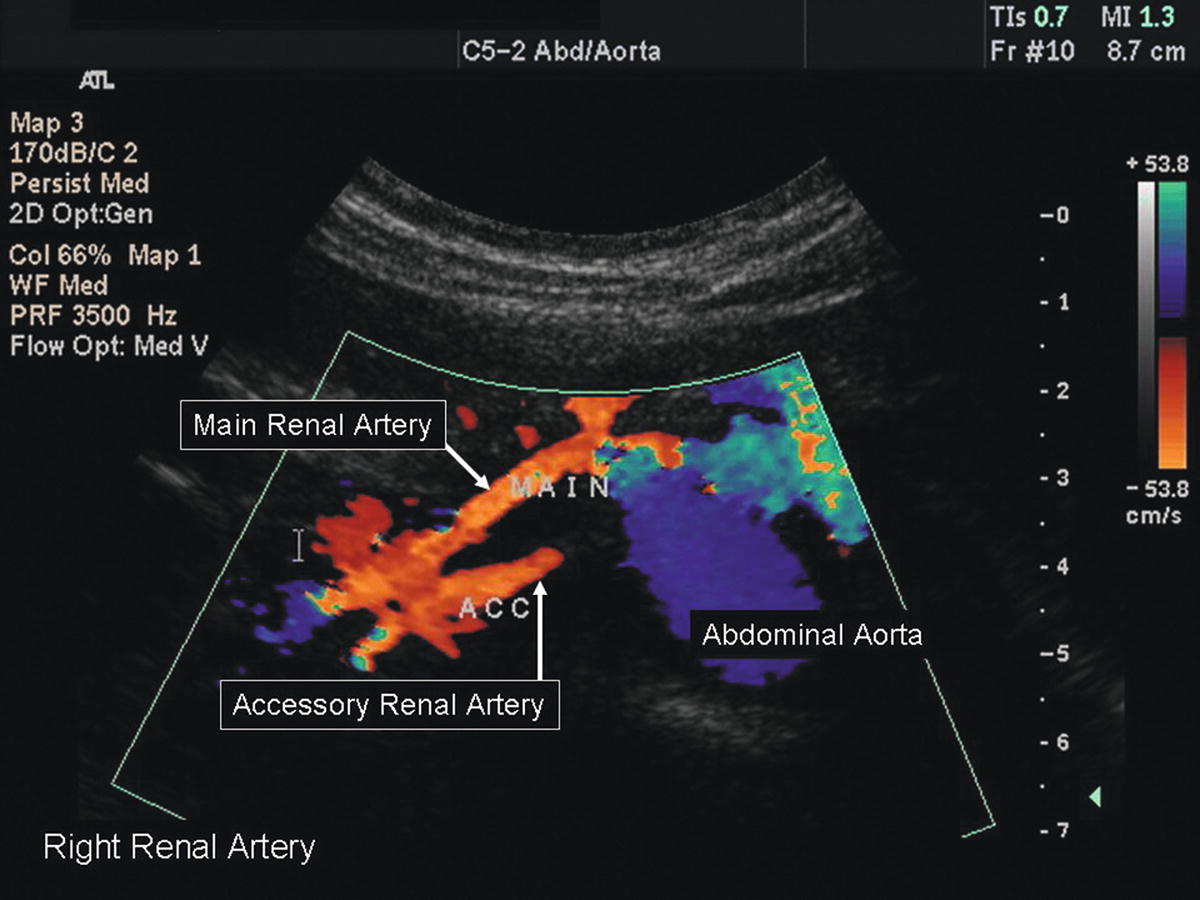
FIGURE 24.15. Color-flow image of an accessory renal artery. The abdominal aorta is shown in transverse orientation with the right main renal artery at the 10-o’clock position and an accessory renal artery arising at the 9-o’clock position.
The duplex technique for evaluation of renal artery stents does not differ significantly from that for native renal arteries (Fig. 24.16). Interrogation of stents ideally involves documentation of Doppler flow velocity and waveform contour prestent, at the proximal end of the stent, midstent, at the distal end of the stent, and poststent. However, as these stents are small in caliber and usually very short, this is not always feasible. Sweep the Doppler sample volume through the stent to identify any focal velocity increase. When present, attempt to identify the specific location of stenosis (e.g., at the distal end of the stent), as demonstrated in Figure 24.17. As previously mentioned, atherosclerotic renal artery stenosis is predominantly continuous with aortic plaque that involves the renal artery ostium. For this reason, renal artery stents are intentionally placed extending into the lumen of the aorta, rather than flush with the aortic wall. Where applicable, visualize the stent with B-mode imaging, noting any stent defects or areas of poor apposition to the artery wall.
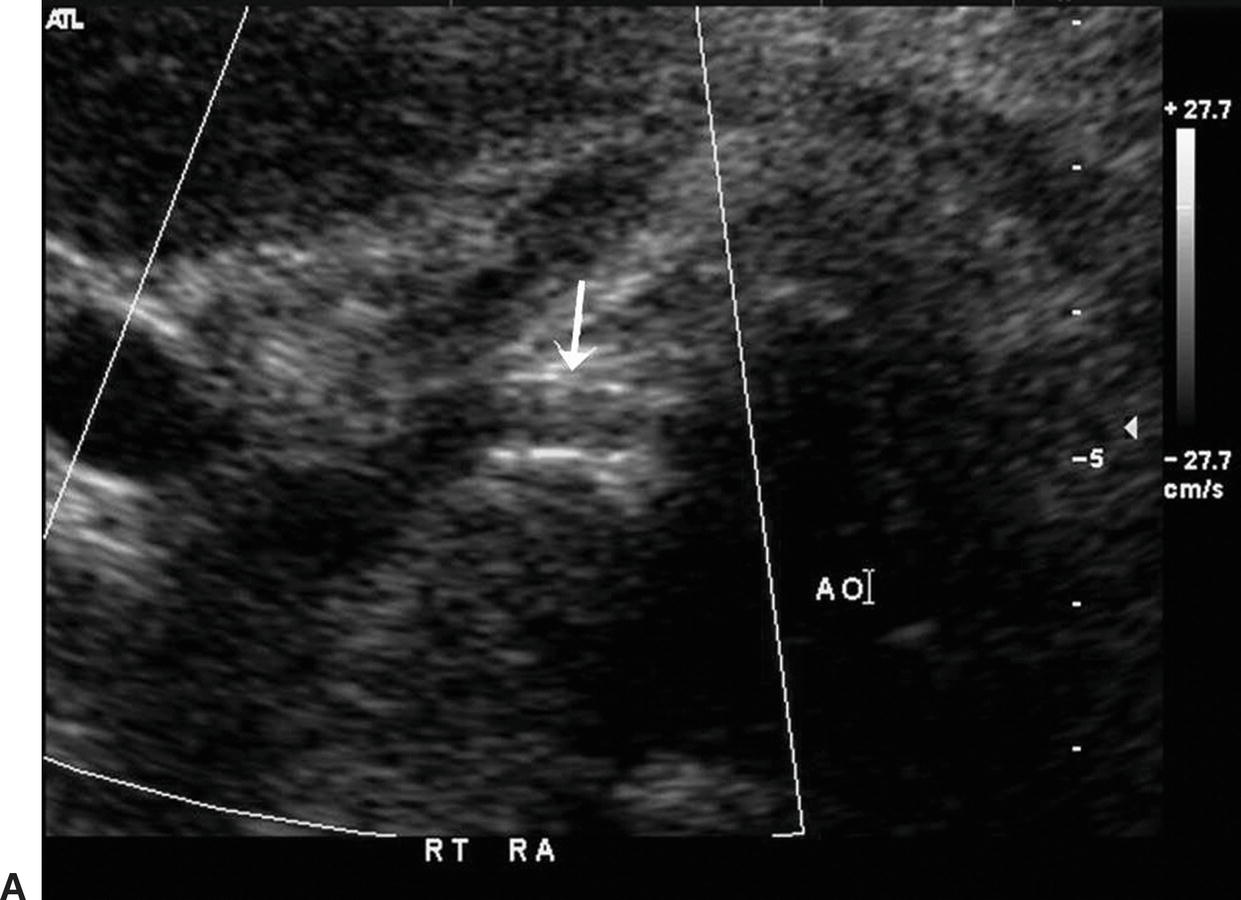
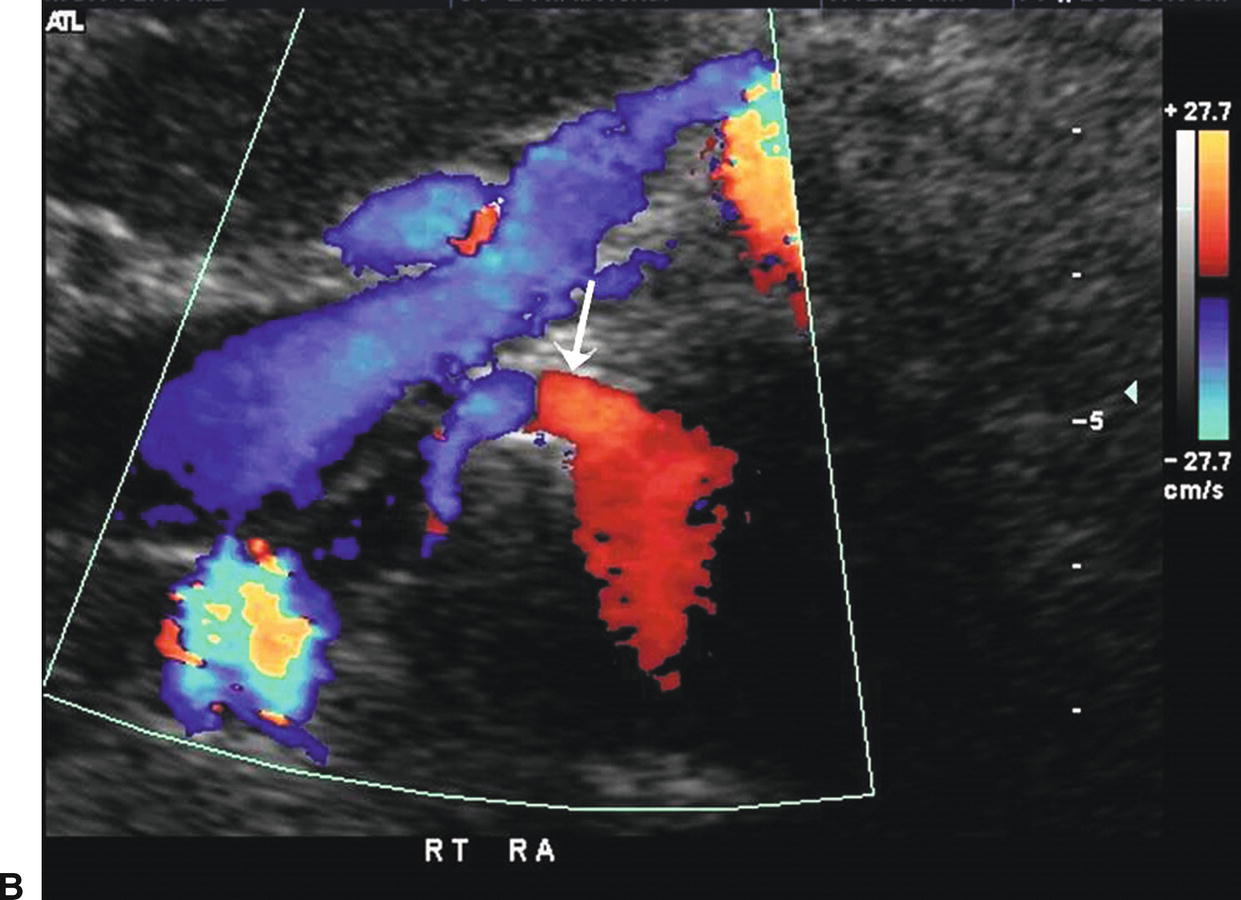
FIGURE 24.16. A,Transverse B-mode image of a right renal artery stent (arrow). The stent extends into the lumen of the adjacent aorta (AO). B,Color-flow image of the same right renal artery stent (arrow) running deep to the left renal vein and IVC.
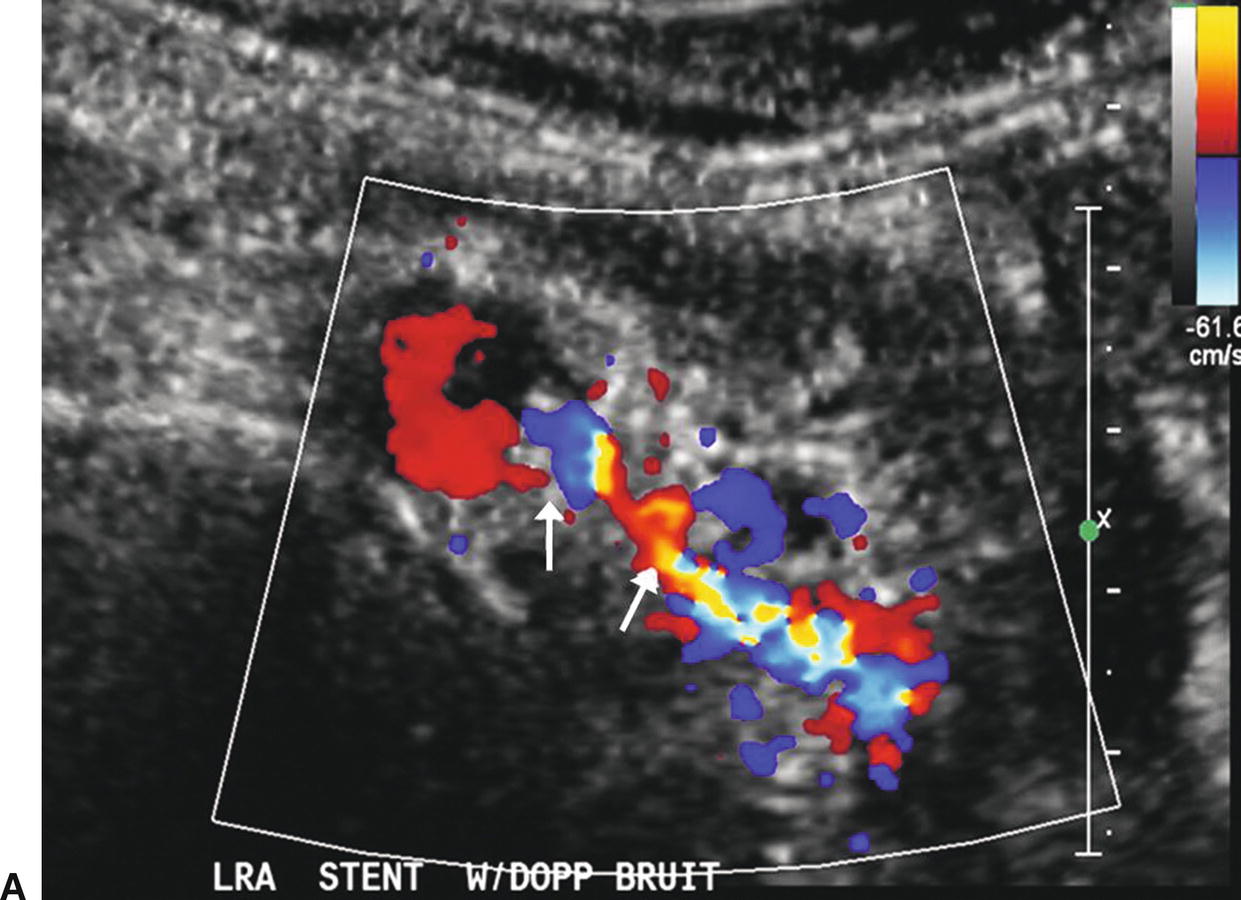
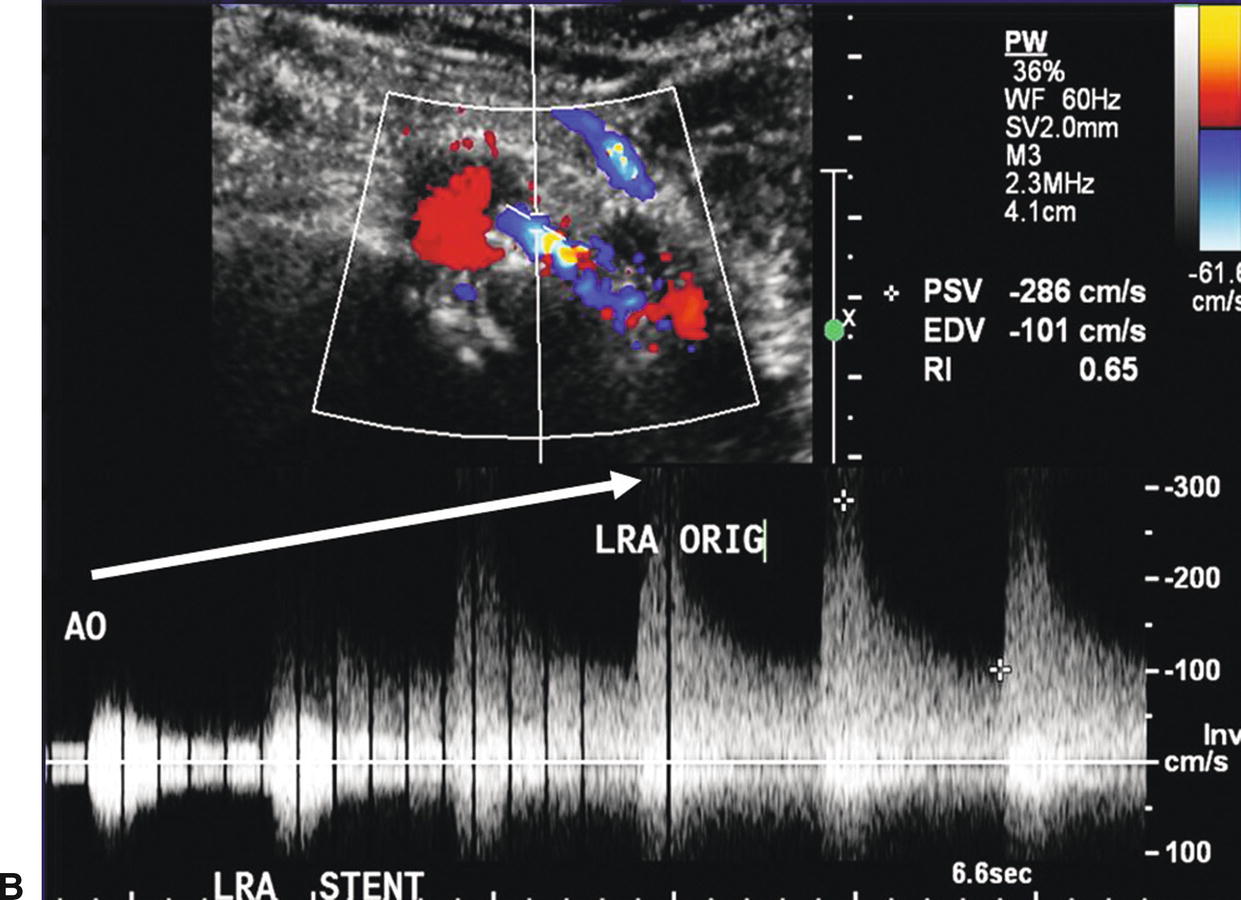
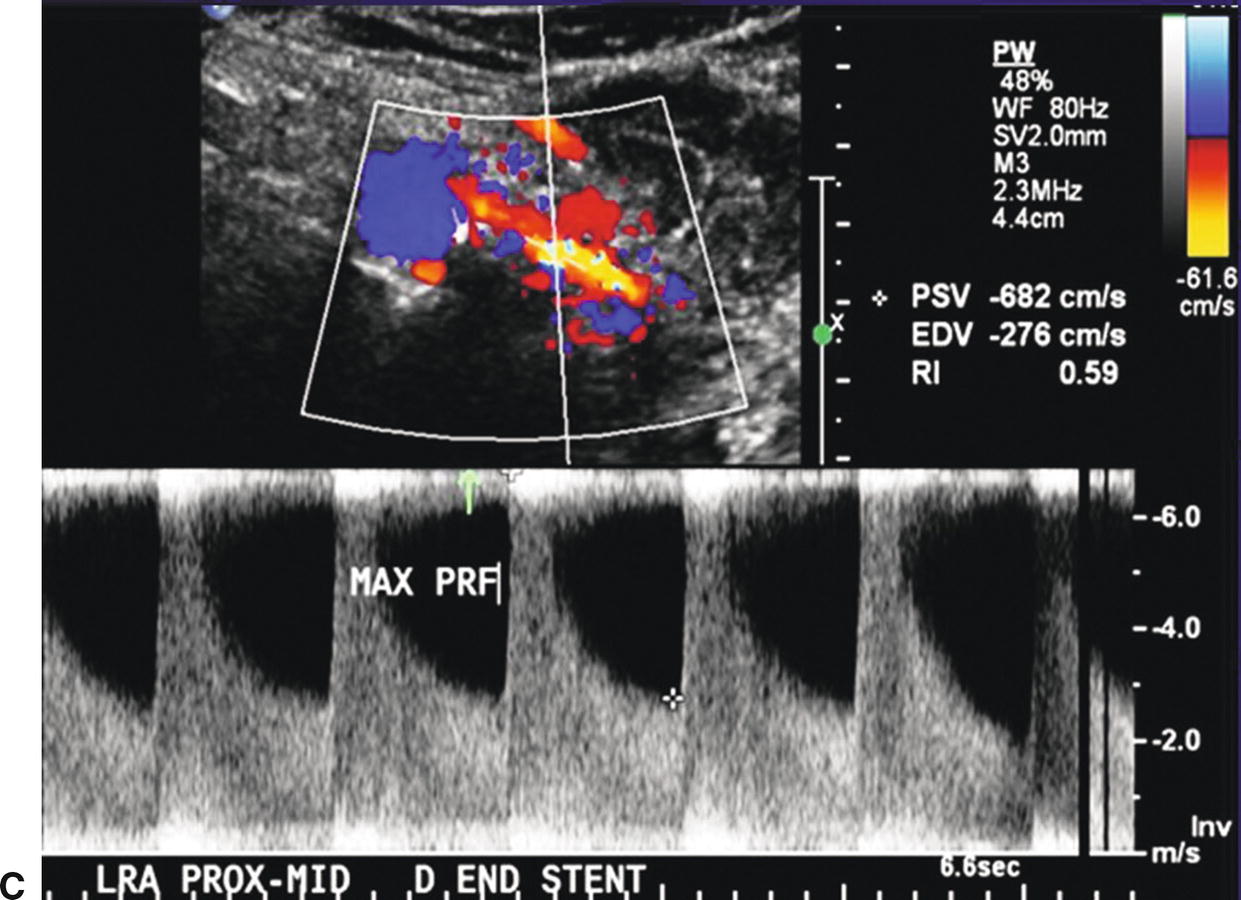
FIGURE 24.17. A,Color-flow image of a stenosis in a left renal artery stent (arrows). B,Spectral waveforms obtained by sweeping the pulsed Doppler sample volume from the aorta into the left renal artery stent with an increase in the PSV to 286 cm/s in the proximal stent segment. C,Spectral waveform taken at the distal end of the left renal artery stent with a PSV of 682 cm/s (maximum for the scale shown). This focal velocity increase indicates a stenosis at this site.
Renal artery bypass grafts are relatively uncommon compared to stents. The usual proximal anastomotic site is the infrarenal aorta, but these grafts may originate from the hepatic artery on the right or the splenic artery on the left, as well as the iliac arteries or suprarenal aorta. Ideally, renal bypass grafts should be visualized in their entirety, including the anastomotic segments, with 60-degree Doppler angles; however, in the abdomen this is not always possible. Identify the inflow artery to the bypass graft, documenting flow velocity and waveform contour to look for hemodynamically significant inflow obstruction. Sweep the Doppler sample volume through the inflow anastomosis of the graft, documenting a representative flow velocity. Obtain a midgraft Doppler flow velocity, sampling throughout the graft if possible. Sweep the Doppler sample volume through the outflow anastomosis, again documenting a representative flow velocity. Finally, evaluate Doppler velocity and waveform contour through the outflow segments of the main renal artery. When the graft cannot be evaluated in its entirety due to overlying abdominal gas, even the documentation of a midgraft Doppler flow velocity and waveform contour can be useful in verifying graft patency.
Although it is not necessary to scan the renal veins in detail during a routine renal duplex evaluation, document patency of the right and left renal veins (Fig. 24.18). The right renal vein is shorter than the left renal vein and is best imaged with the transducer placed in the right lateral abdomen over the right kidney and angled medially. The left renal vein is best imaged with the transducer placed in the midline of the abdomen in a transverse orientation just inferior to the origin of the SMA where it courses between the SMA and the aorta to enter the left lateral aspect of the IVC. The renal veins typically have a pulsatile flow pattern near their entry into the IVC owing to transmitted pulsations from the right atrium. However, closer to the renal hilum, the renal vein flow pattern is more phasic with respiration. The presence of pulsatile flow throughout the bilateral renal veins into the hilar branches is usually due to increased central venous pressure and is found in patients with congestive heart failure, cardiomyopathy, or pulmonary edema (Fig. 24.19).
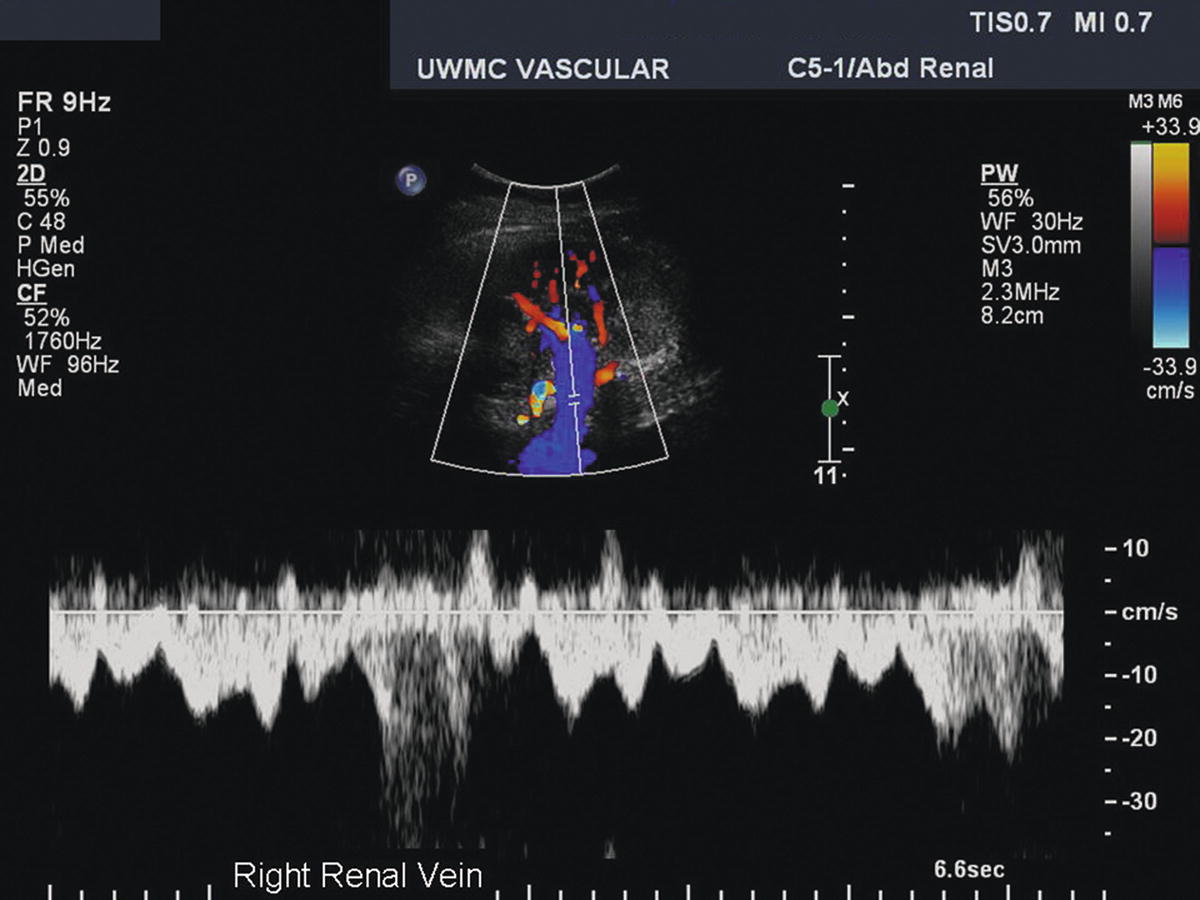
FIGURE 24.18. Duplex image of the right renal vein at the hilum of the kidney taken from the flank approach. The spectral waveform shows a normal phasic and pulsatile renal vein flow pattern.
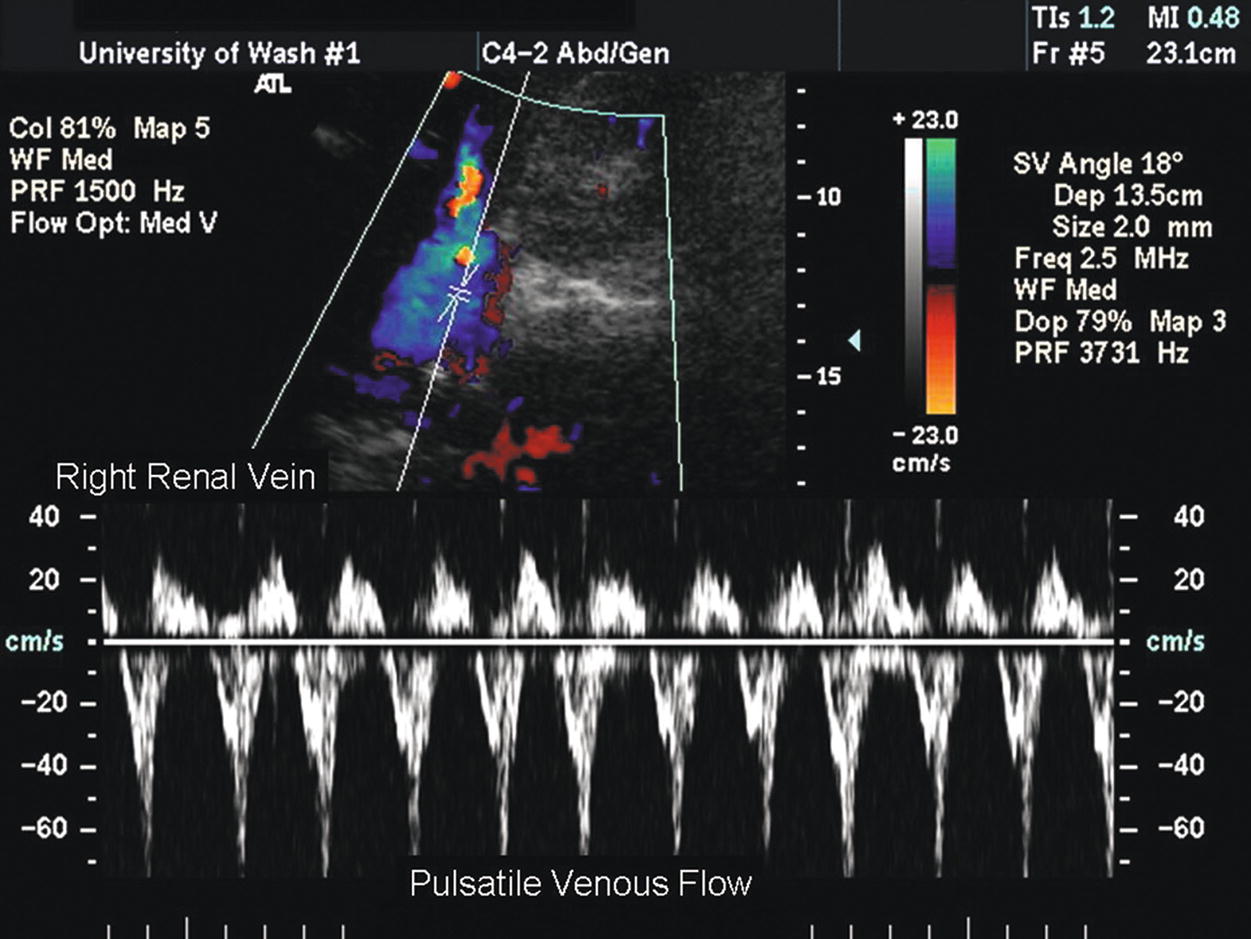
FIGURE 24.19. Spectral waveform from the right renal vein in a patient with congestive heart failure shows a strongly pulsatile flow pattern secondary to increased central venous pressure.
Renal vein thrombosis may occur in association with renal carcinoma, nephrotic syndrome, trauma, or compression secondary to an extrinsic tumor. The renal vein will be dilated proximal to an occlusion, and thrombus may be visualized in the vessel lumen. In the acute phase, the thrombus appears isoechoic to the surrounding blood, no venous flow is identified by Doppler, and the affected kidney is enlarged with a loss of the normal renal architecture. In long-standing cases of renal vein occlusion, the thrombus appears more echogenic, and there may be abnormal, continuous venous flow present in the recanalized lumen.
In some patients, it is possible to insonate a renal artery in its entirety from the flank, particularly when the patient is lying on his or her side. This approach often allows the entire renal artery to be imaged in one view from the aorta to the hilum of the kidney, as shown in Figure 24.14. In addition, individual segmental branches of the renal artery can often be differentiated from the distal main renal artery segment (Fig. 24.20).
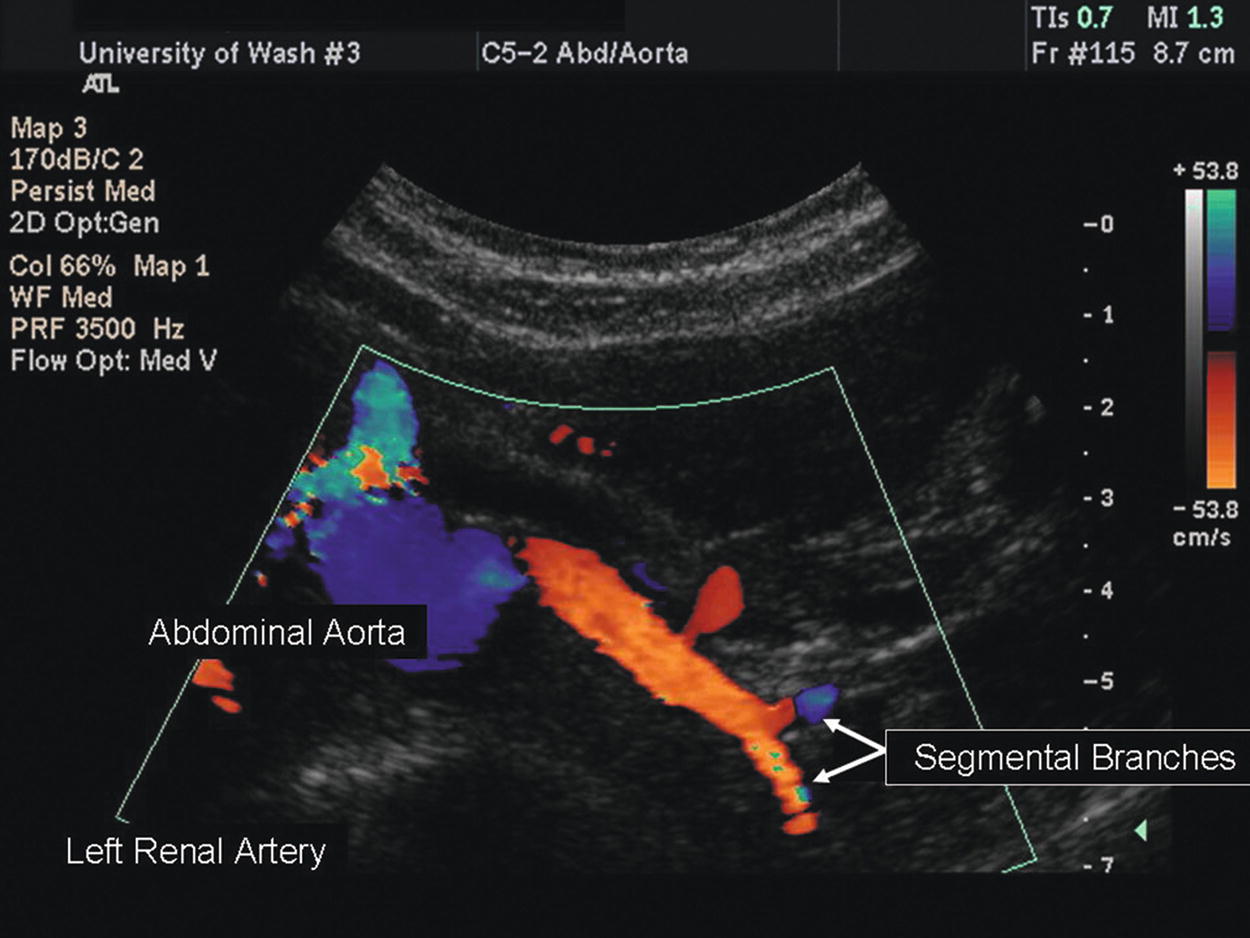
FIGURE 24.20. Color-flow image of a distal left renal artery with extraparenchymal segmental branches.
Renal Hilum and Parenchyma
A renal duplex evaluation should include the vessels in the hilum of the kidney and the renal parenchyma. By definition, the hilum is the part of an organ where the blood vessels enter and leave. The distal main renal artery divides into segmental branches that enter the renal parenchyma and subsequently divide into interlobar, arcuate, and interlobular arteries. The renal sinus contains the segmental vessels and the collecting system (calyces and pelvis of the ureter) embedded in fatty tissue and appears as a relatively echogenic (bright) central area in the kidney on B-mode imaging (Fig. 24.21).
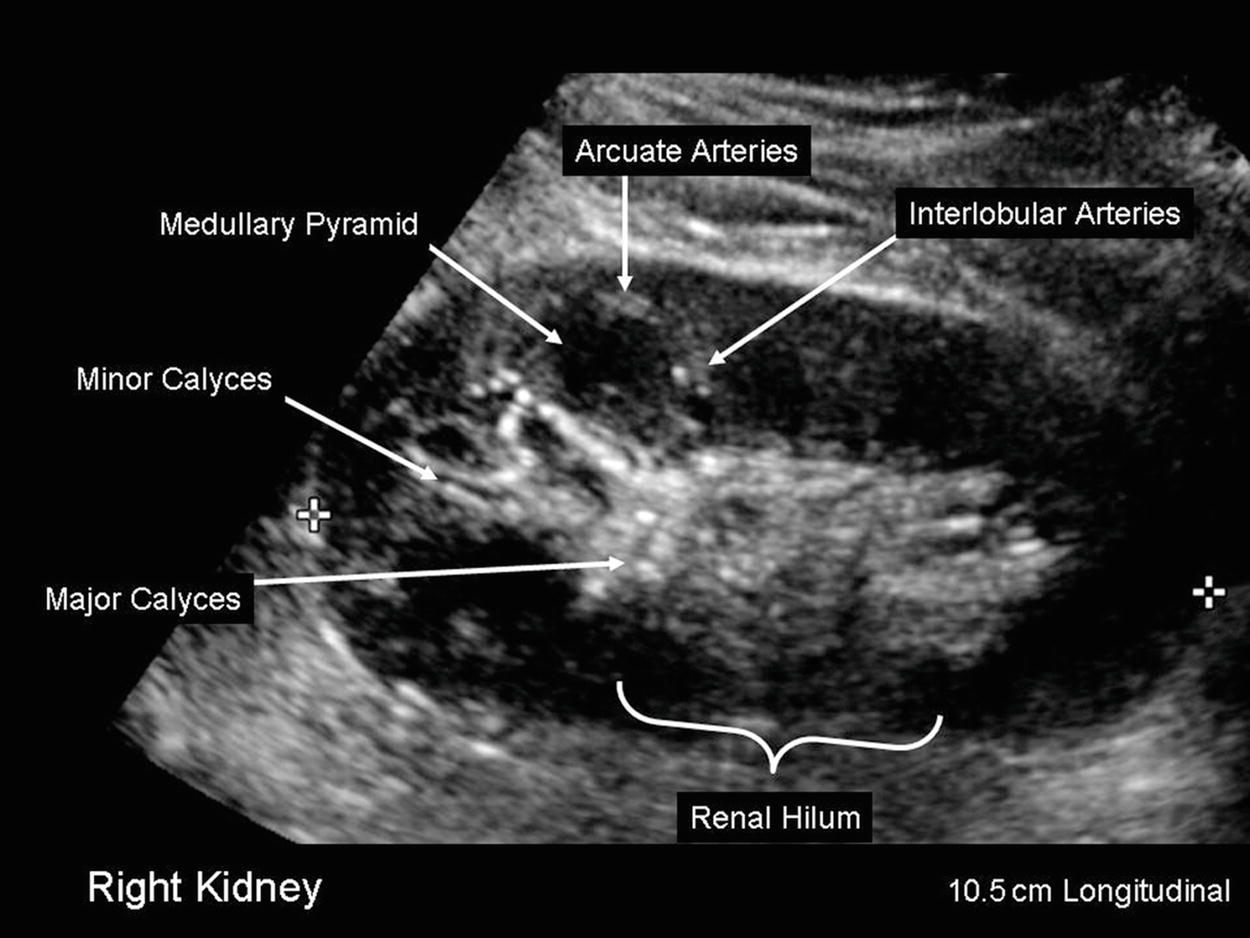
FIGURE 24.21. B-mode image of a kidney in longitudinal orientation. Renal length is 10.5 cm.
The hilar or segmental branches are typically evaluated with the kidney in longitudinal or transverse view using either the liver (on the right) or the spleen (on the left) as an acoustic window. Because the hilar vessels are small and numerous, it is not practical to evaluate them individually, so a large (10.0-mm) sample volume is used at a 0-degree angle to acquire a Doppler signal that includes multiple vessels. Doppler spectral waveforms taken at the hilar level are similar to those from the distal renal artery; however, the velocities are usually lower. Hilar spectral waveforms are easier to obtain than waveforms from the main renal artery but, as is discussed later, they have less diagnostic value.
Parenchymal arteries that can be evaluated during a renal duplex examination are the interlobar and arcuate arteries (Fig. 24.22). Perform the parenchymal Doppler evaluation using a small (1.5- to 2.0-mm) sample volume size and a 0-degree angle. Color-flow or power Doppler imaging facilitates visualization of these arteries. Use a low wall filter setting when obtaining Doppler waveforms within the renal parenchyma, as a high wall filter prevents detection of low diastolic flow velocities. Identify interlobar arteries between the calyces of the collecting system, and obtain Doppler spectral waveforms from the upper and lower poles of the kidneys. Peak systolic flow velocities in the interlobar arteries are normally in the range of 30 to 40 cm/s, slightly lower than those in the hilum (Fig. 24.23A). Obtain Doppler spectral waveforms from the upper and lower pole arcuate arteries, which are identified at the junction of the renal parenchymal cortex and medulla (the corticomedullary junction). Doppler flow velocities continue to decrease peripherally into the renal parenchyma, and arcuate artery PSVs are in the range of 20 to 30 cm/s (Fig. 24.23B). In the presence of severe renal parenchymal disease, arterial flow may be highly resistive or absent.
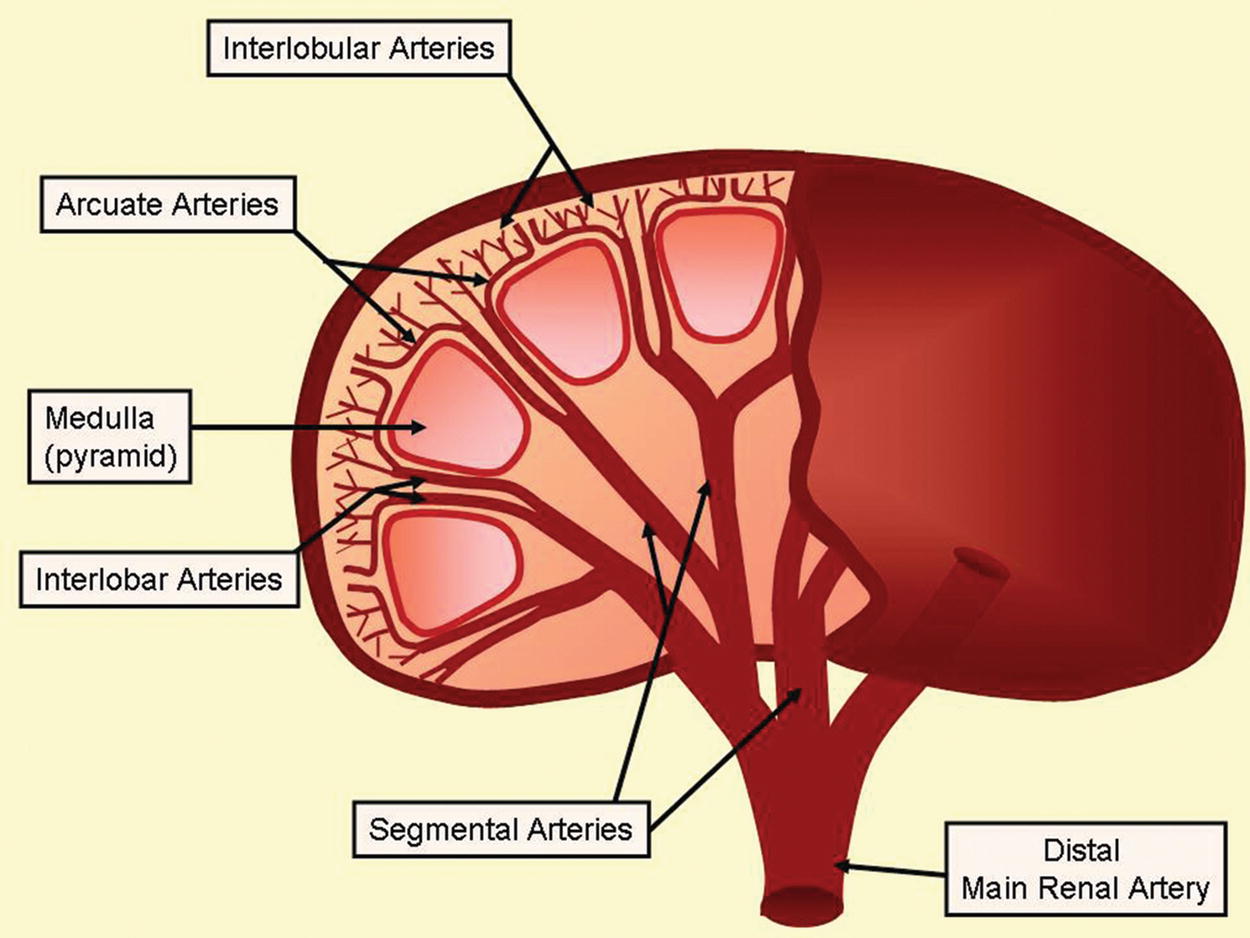
FIGURE 24.22. Anatomy of the extra- and intraparenchymal renal arteries.
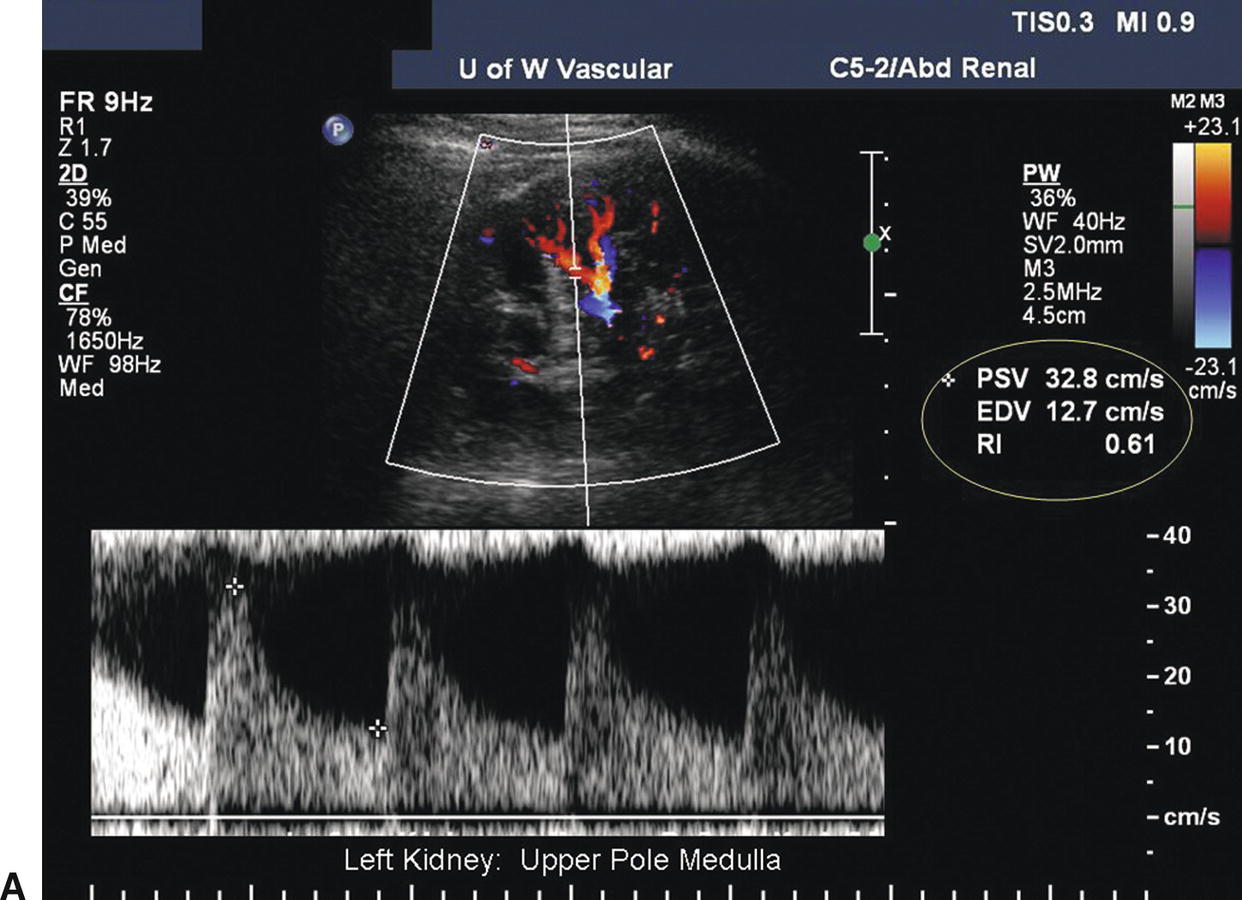
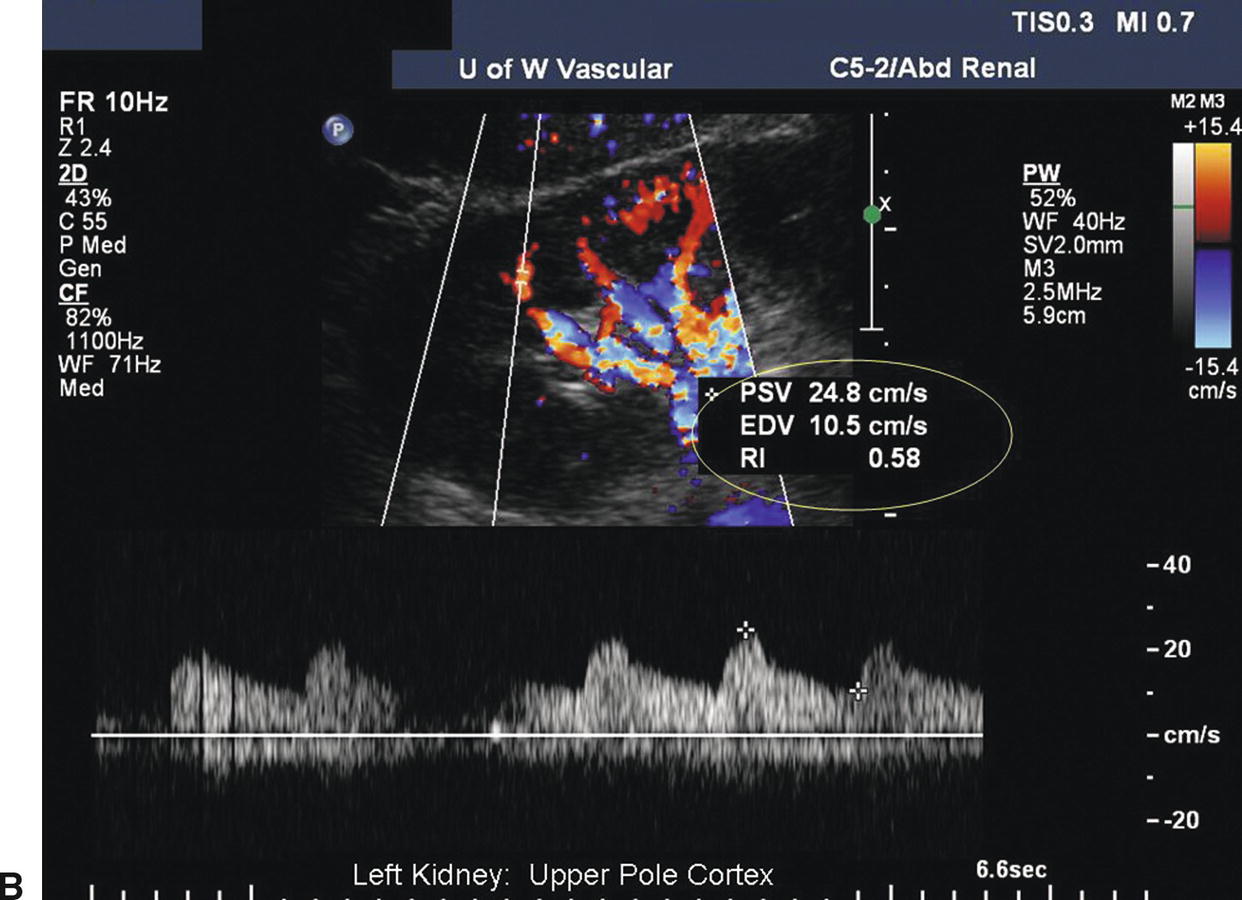
FIGURE 24.23. A, Normal low-resistance Doppler flow pattern obtained in the upper pole medulla of the kidney (interlobar arteries): PSV = 33 cm/s; end- diastolic velocity (EDV) = 13 cm/s; resistance index (RRI) = 0.61 (end-diastolic ratio [EDR] = 0.39). B, Normal low-resistance flow obtained in the upper pole cortex of the kidney (arcuate arteries): PSV = 25 cm/s; EDV = 11 cm/s; RRI = 0.58 [EDR = 0.42].
Two distinct areas of the kidney parenchyma can be differentiated on B-mode ultrasound surrounding the renal sinus: the medulla and the cortex. The medulla is immediately adjacent to the renal sinus and contains the hypoechoic pyramids. The diuretic status of the patient affects the ultrasound appearance of the medulla; when there is an increase in diuresis, the pyramids become more prominent and are easier to visualize. The cortex is the most peripheral portion of the renal parenchyma and is located between the medulla and the renal capsule. The normal echogenicity of the adult renal cortex is comparable with that of the liver or spleen at the same depth. The corticomedullary junction is recognized by the relatively echogenic arcuate arteries, which appear as bright dots or lines as they arch over the tops of the pyramids (Fig. 24.24). Identification of the corticomedullary junction is an important step in the measurement of cortical thickness. It is a normal finding for the kidney cortex and outer capsule to have a “scalloped” appearance (Fig. 24.25).
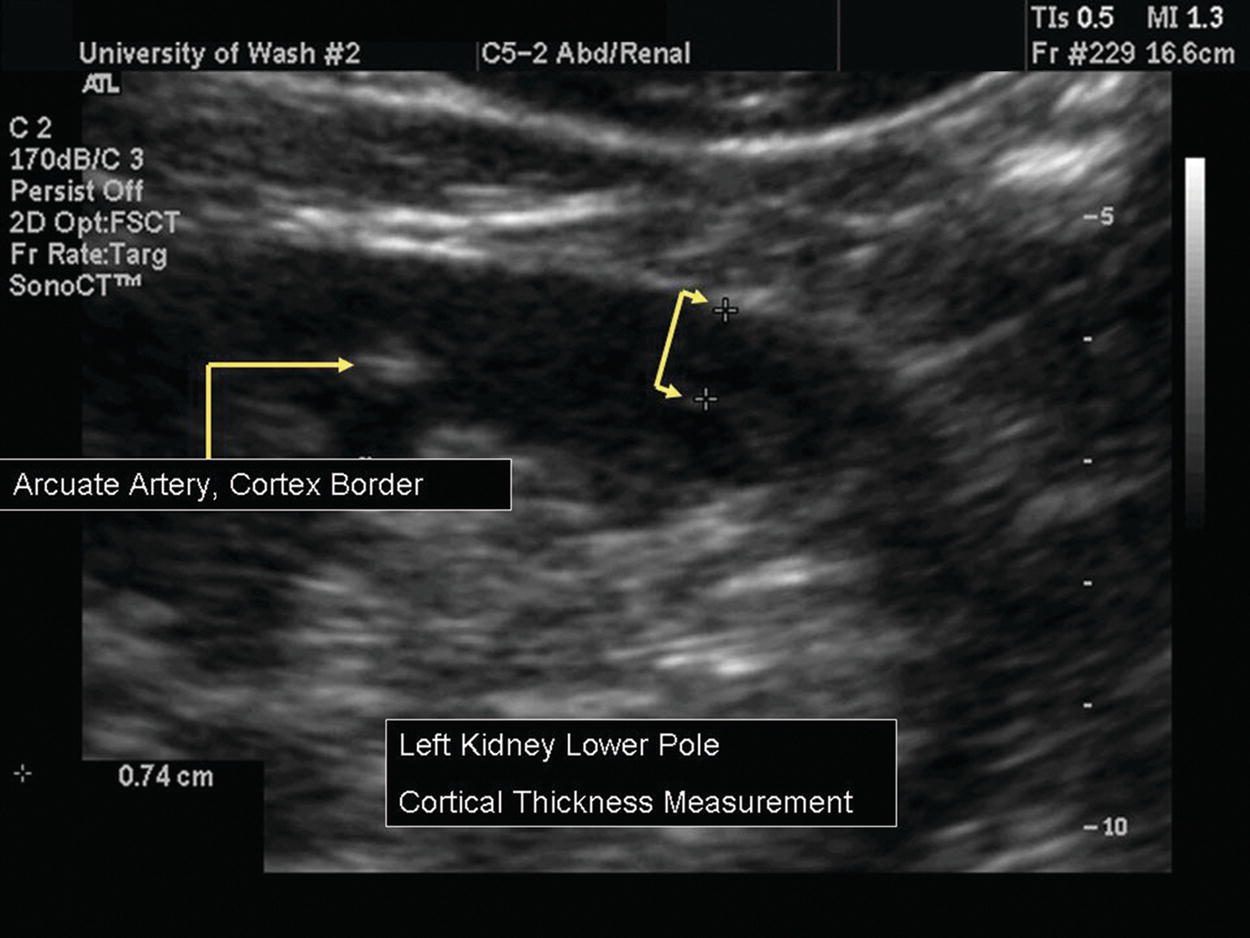
FIGURE 24.24. B-mode image shows the arcuate arteries, which mark the internal border of the cortex. The cortical thickness measurement is 0.74 cm.
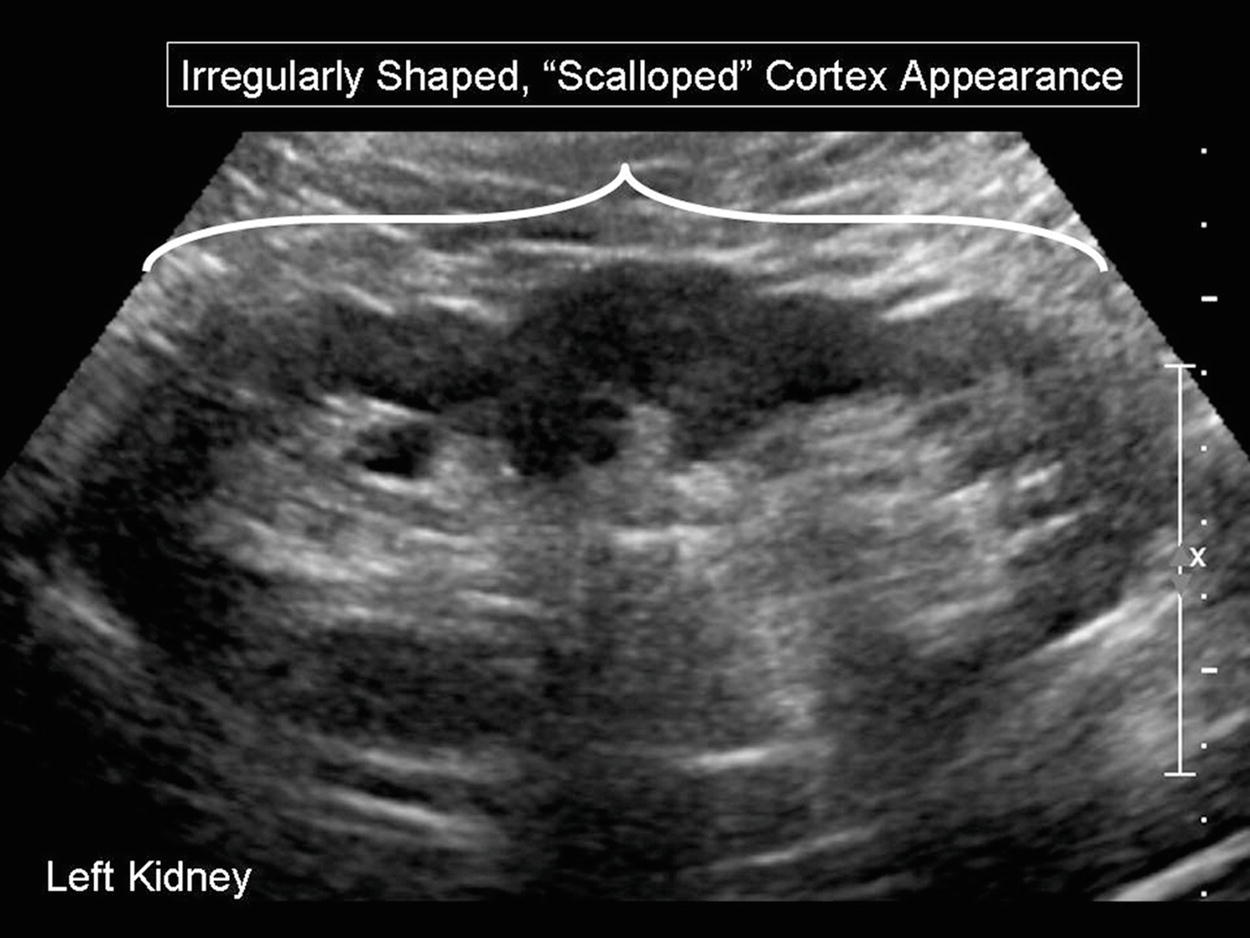
FIGURE 24.25. B-mode image of a kidney with an irregularly shaped cortex, appearing “scalloped.”
Stay updated, free articles. Join our Telegram channel

Full access? Get Clinical Tree


