Exercise intolerance is the primary symptom in patients with heart failure and preserved ejection fraction (HFpEF), a major determinant of their decreased quality of life, and an important outcome in clinical trials. Although cardiopulmonary exercise testing (CPET) provides peak and submaximal diagnostic indexes, the reliability of peak treadmill CPET in patients >55 years of age with HFpEF has not been examined. Two CPETs were performed in 52 patients with HFpEF (70 ± 7 years old). The 2 tests were separated by an average of 23 ± 13 days (median 22) and performed under identical conditions, with no intervention or change in status between visits except for initiation of a placebo run-in. A multistep protocol for patient screening, education, and quality control was used. Mean peak oxygen consumption was similar on tests 1 and 2 (14.4 ± 2.4 vs 14.3 ± 2.3 ml/kg/min). Correlation coefficients and intraclass correlations from the testing days were determined (oxygen consumption, r = 0.85, p <0.001, intraclass correlation 0.855; ventilatory anaerobic threshold, r = 0.79, p <0.001, intraclass correlation 0.790; ventilation per carbon dioxide slope, r = 0.87, p <0.001, intraclass correlation 0.864; heart rate, r = 0.94, p <0.001, intraclass correlation 0.938). These results challenge conventional wisdom that serial baseline testing is required in clinical trials with exercise-capacity outcomes. In conclusion, in women and men with HFpEF and severe physical dysfunction, key submaximal and peak ET variables exhibited good reliability and were not significantly altered by a learning effect or placebo administration.
Noninvasive assessment of exercise intolerance using cardiopulmonary exercise testing (CPET) provides crucial diagnostic data for the evaluation and treatment of patients with heart failure (HF) and is commonly used as a clinical end point in HF therapeutic trials. CPET guidelines have been developed and regularly updated by expert working groups to standardize testing procedures and interpretation of exercise data. These guidelines commonly recommend that ≥2 CPETs be conducted: the first for habituation/learning purposes; the second for acquisition of baseline data. The stated purpose of this multiple-test approach is to decrease test variability. However, this adds significantly to participant burden, study time, and cost. Furthermore, although the reliability of CPET has been examined in symptomatic HF and decreased ejection fraction (HFdEF), there are few data verifying the reliability of peak exercise tests in patients >55 years old, women, and patients with severely decreased exercise function who might benefit most by a habituation session. The latter patients are typical for the entity of HF with preserved EF (HFpEF), in which very few reliability data have been reported. Importantly, the impact of a placebo run-in period on CPET variables in this population, relevant to pharmacologic interventions, has not previously been investigated. The purpose of this study was to determine the reliability of a treadmill exercise test with a placebo run-in period for assessment of peak and submaximal indexes of exercise tolerance in women and men >55 years old with HFpEF using participant screening, well-trained testing personnel, and adherence to stringent CPET criteria.
Methods
The study protocol was approved by the Wake Forest University Medical Center institutional review board, and written informed consent was obtained from all participants. This report is from the screening visit (test 1) and baseline visit (test 2) of a randomized, double-blinded, placebo-controlled pharmacologic clinical trial whose primary outcome was exercise capacity. Participant eligibility was assessed at an initial screening visit, which included medical history, physical examination, blood laboratory results, echocardiogram to document EF and evidence of diastolic dysfunction, and peak CPET (test 1). Approximately 1 week later, participants returned for a second screening visit. If the initial screening visit blood laboratory results were within inclusion criteria, participants entered into a 2-week placebo run-in period. At the subsequent baseline visit, if compliance to the placebo run-in by pill count was ≥80%, participants completed all baseline study assessments including a second peak CPET (test 2).
Patients had New York Heart Association class II to III of ≥1 month’s duration with pEF at rest, echocardiographic evidence of diastolic dysfunction (early diastolic lateral mitral annular velocity <9 cm/s), and no evidence of significant anemia or coronary artery, valvular, infiltrative, pericardial, pulmonary, or renal disease. In addition, only participants with evidence of severe exercise intolerance (exercise time of ≥2 minutes but ≤12 minutes for women or ≤14 minutes for men) were enrolled. Potential participants were initially screened for inclusion by retrospective review of clinic visits and hospital discharge records at the Wake Forest University Medical Center. Of the resultant 273 preliminarily eligible participants, 66 were scheduled for an initial screening visit and 52 met the study criteria and were enrolled.
The multistep screening, education, and quality control CPET protocol is outlined in Appendix 1 (available online). Briefly, ET was performed on a treadmill using the modified Naughton protocol and conducted by the same trained experienced examiner with a master’s degree in exercise physiology. Before each test, participants were screened for any recent acute illness or injury or change in status and were given detailed, standardized, verbal instructions. During the test, participants were encouraged to walk for as long as possible and, once fatigued, to attempt the subsequent stage, resulting in a peak symptom-limited exhaustive effort. Complete calibration of gas concentrations and flow were performed before each test. Metabolic gas exchange was measured continuously during exercise and averaged over 15-second intervals (Medgraphics Ultima, Medical Graphics Corp., St. Paul, Minnesota). Peak oxygen consumption (V o 2 ) was defined as the average of the 2 highest V o 2 values for a given 15-second interval within the last 90 seconds of exercise. Ventilatory anaerobic threshold was calculated using standard methods. Ventilation per carbon dioxide (VE/V co 2 ) slope was determined by measuring the slope across the entire course of exercise. Oxygen uptake efficiency slope was determined by measuring the slope of V o 2 (milliliters per minute) and log 10 VE (liters per minute) across the entire course of exercise. All tests were evaluated by the exercise physiologist for validity based on a combination of symptoms (dyspnea on exertion and/or fatigue as primary end points) and physiologic measurements (respiratory exchange ratio, heart rate, minute ventilation, respiratory rate) and confirmed if necessary by a cardiologist. To avoid bias, the tester intentionally did not view the results of test 1 immediately before conducting test 2. In addition, validation of the gas exchange unit was conducted before each testing day by performing a 2-stage incremental exercise test in a known, constant test subject. To be validated, V o 2 and V co 2 needed to be within 2 SDs of the usual known value at each workload.
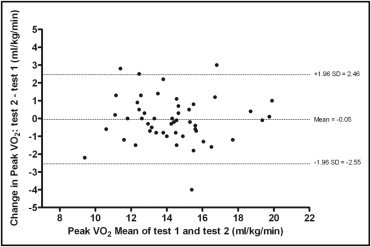
Means are expressed using ± SD or 10th and 90th percentiles. Within-subject variability from test 1 to test 2 was quantified by within-subject absolute change (i.e., increase or decrease from test 1 to test 2). Paired t test was used to test for a statistical difference between the test 1 and test 2 values. Bland–Altman plot was used to visually assess whether the magnitude of within-subject variability in peak V o 2 varied with magnitude of the measurements. Reliability of CPET outcome measurements from the screening visit to the baseline visit was tested by Pearson correlations and intraclass correlations. One-sided 95% confidence intervals of Pearson correlations were made using Fisher’s z transformation. For each variable, the coefficient of variation was defined as (within-subject SD/within-subject mean) × 100%. Significance was set at a p value <0.05.
Results
Participants were predominantly white women with a history of hypertension and New York Heart Association functional class II symptoms ( Table 1 ). Tests 1 and 2 were separated by an average of 23 ± 13 days. Compliance by pill count to the placebo run-in period was excellent (96%). No adverse events occurred during or after any peak CPET. In 3 participants, the screening visit CPET was not considered a valid peak test and was repeated 2 weeks later. Reasons were (1) abnormal gait and coordination resulting in early fatigue and test termination in 2 participants and (2) test ended primarily owing to knee pain in 1 participant. The 2 participants with abnormal gait and coordination were coached on proper mechanics immediately after the screening visit CPET, with good results. The participant with initial knee pain returned after a bout of nonsteroidal anti-inflammatory drugs and completed the repeated CPET with no pain. In each case, the repeated screening visit CPET was considered valid and was used in this analysis.
| Age (years) | 70 ± 7 |
| Men | 10 (19%) |
| Women | 42 (81%) |
| White | 31 (60%) |
| Black | 21 (40%) |
| Weight (kg) | 89 ± 17 |
| Systolic blood pressure (mm Hg) | 129 ± 18 |
| Diastolic blood pressure (mm Hg) | 74 ± 10 |
| Body mass index (kg/m 2 ) | 33.5 ± 5.7 |
| New York Heart Association functional class | |
| II | 37 (71%) |
| III | 15 (29%) |
| Doppler diastolic function | |
| Abnormal relaxation | 38 (73%) |
| Pseudonormal | 11 (21%) |
| Undetermined (atrial fibrillation) | 3 (6%) |
| Diabetes mellitus | 21 (40%) |
| Hypertension (by history) | 50 (96%) |
| Medications | |
| Angiotensin-converting enzyme inhibitors | 20 (38%) |
| Digoxin | 1 (2%) |
| Diuretics | 37 (71%) |
| β Blockers | 24 (46%) |
| Calcium channel blockers | 19 (37%) |
| Peak oxygen consumption, test 1 (ml/kg/min) | 14.4 ± 2.4 |
Peak V o 2 and ventilatory anaerobic threshold were nearly identical on the 2 tests. Within-subject peak V o 2 demonstrated high agreement between tests as shown by Bland–Altman analysis ( Figure 1 ). Reliability of CPET parameters was excellent ( Table 2 ) and was similar across age and gender ( Tables 3 and 4 ). Exercise time increased significantly from test 1 to test 2. Likewise, VE/V co 2 slope was significantly greater in test 2 than in test 1 ( Table 5 ).
| Peak Exercise (treadmill) | Test 1 | Test 2 | R | 1-Sided 95% CI | ICC | p Value |
|---|---|---|---|---|---|---|
| Time (seconds) | 577 ± 111 | 598 ± 123 | 0.914 | 0.866 | 0.895 | <0.001 |
| Indexed peak oxygen uptake (ml/kg/min) | 14.4 ± 2.4 | 14.3 ± 2.3 | 0.853 | 0.775 | 0.855 | <0.001 |
| Absolute peak oxygen uptake (ml/min) | 1,266 ± 300 | 1,260 ± 290 | 0.918 | 0.872 | 0.919 | <0.001 |
| Heart rate (beats/min) | 128 ± 25 | 127 ± 24 | 0.938 | 0.903 | 0.938 | <0.001 |
| Systolic blood pressure (mm Hg) | 170 ± 18 | 167 ± 19 | 0.772 | 0.659 | 0.763 | <0.001 |
| Diastolic blood pressure (mm Hg) | 74 ± 10 | 72 ± 8 | 0.746 | 0.622 | 0.726 | <0.001 |
| Peak carbon dioxide production (ml/min) | 1,427 ± 346 | 1,431 ± 346 | 0.893 | 0.834 | 0.895 | <0.001 |
| Respiratory exchange ratio | 1.13 ± 0.06 | 1.14 ± 0.07 | 0.623 | 0.458 | 0.622 | <0.001 |
| Ventilation per carbon dioxide slope | 30.5 ± 4.5 | 31.1 ± 4.5 | 0.872 | 0.802 | 0.864 | <0.001 |
| Oxygen uptake at ventilatory threshold (ml/min) | 845 ± 213 | 840 ± 212 | 0.787 | 0.678 | 0.79 | <0.001 |
| Oxygen uptake efficiency slope (ml/min × L/min) | 1,567 ± 449 | 1,553 ± 450 | 0.869 | 0.798 | 0.871 | <0.001 |
| Age <70 Years (n = 28) | Age ≥70 Years (n = 24) | |||||||
|---|---|---|---|---|---|---|---|---|
| Test 1 | Test 2 | R | ICC | Test 1 | Test 2 | R | ICC | |
| Exercise time (seconds) | 593 ± 99 | 617 ± 100 | 0.9 | 0.878 | 557 ± 124 | 577 ± 145 | 0.92 | 0.904 |
| Oxygen uptake (ml/kg/min) | 14.2 ± 2.5 | 14.2 ± 2.5 | 0.89 | 0.894 | 14.6 ± 2.3 | 14.5 ± 2.3 | 0.8 | 0.806 |
| Oxygen uptake (ml/min) | 1,305 ± 262 | 1,295 ± 228 | 0.91 | 0.9 | 1,220 ± 339 | 1,220 ± 349 | 0.93 | 0.931 |
| Heart rate (beats/min) | 132 ± 25 | 132 ± 22 | 0.93 | 0.92 | 124 ± 26 | 121 ± 26 | 0.96 | 0.954 |
| Systolic blood pressure (mm Hg) | 172 ± 17 | 169 ± 17 | 0.8 | 0.798 | 167 ± 19 | 164 ± 22 | 0.74 | 0.734 |
| Diastolic blood pressure (mm Hg) | 76 ± 9 | 74 ± 8 | 0.77 | 0.742 | 72 ± 11 | 70 ± 8 | 0.71 | 0.697 |
| Carbon dioxide production (ml/min) | 1,448 ± 286 | 1,462 ± 257 | 0.87 | 0.867 | 1,401 ± 410 | 1,395 ± 430 | 0.91 | 0.91 |
| Respiratory exchange ratio | 1.12 ± 0.06 | 1.13 ± 0.06 | 0.68 | 0.661 | 1.15 ± 0.06 | 1.14 ± 0.08 | 0.6 | 0.578 |
| Ventilation per carbon dioxide slope | 29.7 ± 4.7 | 30.5 ± 4.9 | 0.88 | 0.875 | 31.3 ± 4.2 | 31.8 ± 4.0 | 0.85 | 0.843 |
| Oxygen uptake at ventilatory threshold (ml/min) | 861 ± 190 | 860 ± 163 | 0.76 | 0.755 | 827 ± 239 | 818 ± 258 | 0.81 | 0.814 |
| Oxygen uptake efficiency slope | 1,642 ± 340 | 1,641 ± 403 | 0.77 | 0.762 | 1,480 ± 545 | 1,451 ± 487 | 0.94 | 0.932 |
| Women (n = 42) | Men (n = 10) | |||||||
|---|---|---|---|---|---|---|---|---|
| Test 1 | Test 2 | R | ICC | Test 1 | Test 2 | R | ICC | |
| Exercise time (sec) | 568 ± 107 | 590 ± 116 | 0.92 | 0.902 | 611 ± 126 | 632 ± 151 | 0.89 | 0.877 |
| Oxygen uptake (ml/kg/min) | 13.8 ± 1.9 | 13.9 ± 1.8 | 0.79 | 0.795 | 16.8 ± 2.7 | 16.3 ± 3.2 | 0.88 | 0.865 |
| Oxygen uptake (ml/min) | 1,183 ± 234 | 1,187 ± 221 | 0.89 | 0.888 | 1,614 ± 306 | 1,571 ± 348 | 0.89 | 0.885 |
| Heart rate (beats/min) | 133 ± 24 | 132 ± 21 | 0.93 | 0.927 | 110 ± 24 | 107 ± 26 | 0.94 | 0.934 |
| Systolic blood pressure (mm Hg) | 171 ± 18 | 168 ± 20 | 0.8 | 0.789 | 165 ± 18 | 161 ± 16 | 0.61 | 0.616 |
| Diastolic blood pressure (mm Hg) | 74 ± 9 | 72 ± 8 | 0.71 | 0.694 | 74 ± 12 | 72 ± 9 | 0.86 | 0.84 |
| Carbon dioxide production (ml/min) | 1,321 ± 251 | 1,338 ± 256 | 0.84 | 0.842 | 1,870 ± 348 | 1,824 ± 406 | 0.84 | 0.84 |
| Respiratory exchange ratio | 1.12 ± 0.06 | 1.13 ± 0.07 | 0.55 | 0.55 | 1.16 ± 0.06 | 1.17 ± 0.07 | 0.84 | 0.852 |
| Ventilation per carbon dioxide slope | 30.7 ± 4.5 | 31.5 ± 4.6 | 0.86 | 0.852 | 29.4 ± 4.9 | 29.7 ± 4.4 | 0.91 | 0.908 |
| Oxygen uptake at ventilatory threshold (ml/min) | 790 ± 170 | 783 ± 157 | 0.71 | 0.716 | 1,070 ± 231 | 1,074 ± 252 | 0.68 | 0.705 |
| Oxygen uptake efficiency slope | 1,455 ± 333 | 1,460 ± 378 | 0.81 | 0.811 | 2,040 ± 577 | 1,944 ± 532 | 0.89 | 0.886 |
Stay updated, free articles. Join our Telegram channel

Full access? Get Clinical Tree


