Lipoprotein levels are currently recognized as independent risk factors for long-term cardiovascular events after acute myocardial infarction (AMI). During the acute-phase reaction after AMI, previous studies have reported trends of decreased low-density lipoprotein cholesterol (LDL-C), increased triglycerides, and variable high-density lipoprotein cholesterol (HDL-C) levels. However, the association between LDL-C and HDL-C levels and in-hospital mortality has not been well established following AMI. The relationship between lipid levels and in-hospital all-cause mortality in 115,492 patients hospitalized for AMI (July 2002 to December 2006), registered in the National Registry of Myocardial Infarction (NRMI) 4b–5, was evaluated using multivariable-adjusted logistic regression models. Mean LDL-C was 104 ± 38, HDL-C was 41 ± 14, and triglycerides 143 ± 83 mg/dl. Compared with the lowest quartile of LDL-C (<77 mg/dl), the risk of in-hospital mortality in the second to fourth quartiles was decreased (adjusted odds ratio 0.79, 0.80, and 0.85, respectively). For HDL-C, only those in the lowest quartile (<31 mg/dl) had higher risk of in-hospital mortality (odds ratio 1.20) compared with the highest quartile (≥47 mg/dl). Results from NRMI 4b–5 suggest a lipid paradox, with lower LDL-C levels associated with increased risk of in-hospital mortality, contrary to findings outside the acute setting. Consistent with previous analyses, lowest HDL-C levels were associated with increased in-hospital mortality. In conclusion, further explorations of the relationship between very low levels of LDL-C, myocardial necrosis, and subsequent adverse cardiovascular events are warranted.
Plasma lipoprotein levels are recognized as independent risk factors for long-term cardiovascular (CV) events, with high levels of low-density lipoprotein cholesterol (LDL-C) associated with increased CV risk and high levels of high-density lipoprotein cholesterol (HDL-C) associated with decreased CV risk. However, there is a paucity of literature evaluating the relationship between in-hospital lipoprotein levels and in-hospital adverse CV outcomes following acute coronary syndrome (ACS) in either the clinical trial or observational research setting. This analysis assessed the relations between all-cause in-hospital mortality following acute myocardial infarction (AMI) and in-hospital plasma LDL-C and HDL-C levels after an AMI, using the National Registry of Myocardial Infarction (NRMI) data set.
Methods
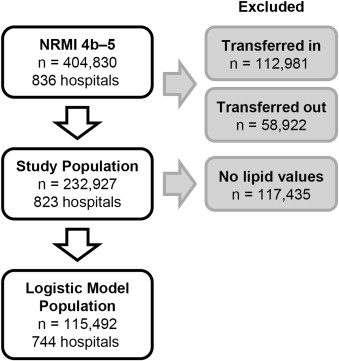
NRMI (a prospective, observational study of AMI hospitalizations in the United States from 1990 to 2006, including more than 2,100 hospital sites and 2.5 million patients records; in-hospital data only were collected with no postdischarge records) served as the data source. NRMI has been described in detail previously. Records from the NRMI 4b–5 cohort were considered, including 404,830 patients presenting with AMI from 836 hospitals from July 2002 to December 2006. Patients were excluded if they were transferred to and from the hospital because of the potential for incomplete data on presentation, treatment, or hospital outcome. Overall, records from 232,927 nontransferred patients with a principal diagnosis of AMI (“ International Classification of Disease, Ninth Revision ,” code 410.x) who were discharged from 823 participating hospitals from July 2002 to December 2006 were available for analysis. Lipid levels collected within 24 hours of admission were added as an optional value to the case report forms for the NRMI 4b–5 study versions; therefore, this analysis included 115,492 patient records containing lipid values ( Figure 1 ).

The primary clinical outcome was in-hospital all-cause mortality; secondary outcomes not reported here included recurrent MI, stroke, congestive heart failure, pulmonary edema, and in-hospital length of stay. The independent variables included the first-recorded postadmission LDL-C and HDL-C levels assessed by plasma lipid panels.
Descriptive statistics (mean ± SD for continuous variables; percentages for categorical variables) were calculated. The Pearson chi-square tests were conducted for discrete data and one-way analysis of variance or the Wilcoxon tests for continuous data. Multivariable logistic regression models were used to assess relationships between lipid levels and in-hospital mortality. Variable selection for the multivariable logistic regression models followed a backward-elimination approach. Candidate covariates included demographic characteristics, medical history, preadmission medication use, diabetes, lipid levels and reperfusion strategy. The primary analyses were conducted including prehospital statin use as a covariate, using lipid quartiles as the predictors of interest. Sensitivity analyses were conducted, first excluding statin use as a covariate, second including both prehospital and in-hospital statin-use, and third using deciles rather than quartiles as the predictors of interest.
To adjust for multiple comparisons across quartiles, a Dunnett–Hsu adjustment was used to calculate confidence intervals and p values. All tests were 2 sided, with an adjusted p <0.05 considered significant, including those for covariate selection in the regression models. All analyses were done in SAS version 9.2 (SAS Institute, Cary, North Carolina). Adjusted odds ratios and coefficient estimates are presented with the corresponding 95% confidence intervals.
Results
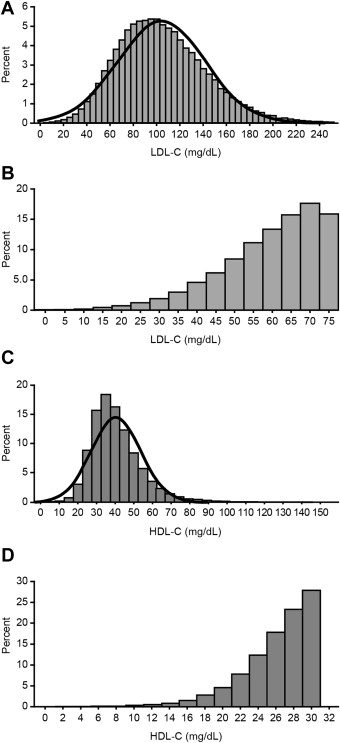
Baseline characteristics are summarized in Table 1 . LDL-C levels were fairly normally distributed ( Figure 2 ). Compared with the Adult Treatment Panel III guideline targets for high-risk and very high-risk patients, more than half in this cohort had LDL-C levels above the 100 mg/dl target and >75% were above the more aggressive goal of 70 mg/dl, respectively ( Figure 2 ). The reference group used for the LDL-C regression analysis was the lowest LDL-C quartile (<77 mg/dl) because it represents what is clinically perceived as a better LDL-C level compared with the higher quartiles.
| Total population (n = 115,492) | LDL-C (mg/dl) | HDL-C (mg/dl) | |||
|---|---|---|---|---|---|
| 1 –<77 (n = 28,164) | 77–<250 (n = 87,328) | 1–<31 (n = 25,194) | 31–<150 (n = 90,298) | ||
| Women | 37.5% | 37.2% | 37.6% | 23.3% | 41.5% |
| Age (years ∗ , mean) ± SD | 66.7 ± 13.5 | 70.3 ± 12.8 | 65.5 ± 13.5 | 63.9 ± 13.3 | 67.5 ± 13.5 |
| European American | 83.4% | 84.8% | 82.9% | 86.0% | 82.6% |
| African-American | 8.5% | 7.6% | 8.8% | 5.7% | 9.2% |
| Hispanic | 3.3% | 3.0% | 3.4% | 3.6% | 3.2% |
| Hypertension | 62.2% | 69.8% | 59.7% | 61.0% | 62.5% |
| Previous AMI | 21.7% | 30.1% | 18.9% | 24.7% | 20.8% |
| Diabetes mellitus | 27.5% | 37.9% | 24.2% | 32.7% | 26.1% |
| Smoker † | 33.1% | 25.9% | 35.5% | 40.8% | 31.0% |
| Health status | |||||
| Systolic blood pressure ‡ (mmHg) ± SD | 145.6 ± 31.8 | 140.2 ± 32.1 | 147.4 ± 31.4 | 142.2 ± 31.3 | 146.6 ± 31.8 |
| Heart rate (beats/min) ± SD | 85.3 ± 23.3 | 87.3 ± 24.6 | 84.7 ± 22.9 | 84.7 ± 23.2 | 85.5 ± 23.4 |
| AMI type | |||||
| NSTEMI | 60.7% | 64.7% | 59.4% | 59.3% | 61.1% |
| STEMI | 39.3% | 35.3% | 40.6% | 40.7% | 38.9% |
| pPCI § | 62.3% | 57.5% | 63.6% | 65.8% | 61.3% |
| Coronary bypass § | 0.9% | 1.7% | 0.7% | 1.6% | 0.7% |
| No IRP § | 22.2% | 27.7% | 20.8% | 18.5% | 23.3% |
| Pre-admission LLA/statin use | 19% | 32.4% | 14.7% | 20% | 28.8% |
| Lipid levels ¶ | |||||
| LDL-C (mg/dl), mean ± SD | 104 ± 38 | 59 ± 13 | 119 ± 31 | 96 ± 36 | 107 ± 38 |
| LDL-C (mg/dl), 25 th , 50 th , 75 th percentile | 77, 101, 128 | 52, 62, 70 | 95, 113, 136 | 71, 93, 119 | 79, 103, 130 |
| HDL-C (mg/dl), mean ± SD | 41 ± 14 | 40 ± 15 | 41 ± 13 | 26 ± 4 | 45 ± 12 |
| HDL-C (mg/dl), 25 th , 50 th , 75 th percentile | 31, 38, 47 | 30, 37, 47 | 32, 39, 47 | 24, 27, 29 | 36, 42, 50 |
| TG (mg/dl), mean ± SD | 143 ± 83 | 133 ± 87 | 146 ± 81 | 174 ± 94 | 134 ± 77 |
| TG (mg/dl), 25 th , 50 th , 75 th percentile | 85, 122, 179 | 74, 107, 164 | 89, 127, 182 | 107, 152, 220 | 81, 115, 167 |
∗ Ages ≥90 years old set to 90 years old.
† Current smoker (smoking within the last year).
‡ mm/Hg, values >250 mm Hg set to missing.
§ Reperfusion-eligible population.
¶ LDL-C, HDL-C, TG; recorded within first 24 hours of patient arrival. Negative values and values >250 mg/dl, >150 mg/dl, >700 mg/dl, respectively, set to missing.

The HDL-C levels in this NRMI cohort were generally low, with more than half of the patients under the guidelines threshold for low HDL-C of 40 mg/dl for men and 50 mg/ml for women ( Figure 2 ). In addition, levels of HDL-C were very low in the bottom quartile ( Figure 2 ) compared with standard distribution in a healthy population. For the HDL-C regression analysis, the highest quartile of HDL-C (≥47 mg/dl) was used as the reference group because higher HDL-C levels are perceived as clinically better than lower levels.
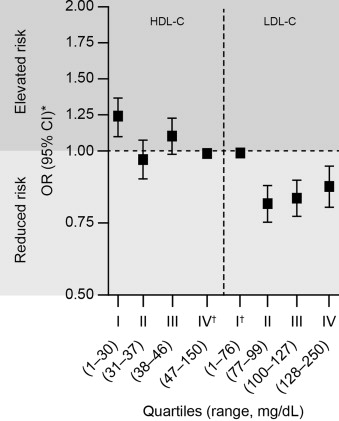
Unexpectedly, the lowest levels of LDL-C were associated with increased risk of mortality in the acute setting, after adjustment for multiple parameters, including medication use such as statins. Contrary to the original hypothesis, compared with patients in the first quartile, patients with higher LDL-C levels in the second, third, and fourth quartiles had significantly lower risk of in-hospital mortality ( Table 2 ). A linear response among the LDL-C quartiles was not seen ( Figure 3 ).
| LDL-C | HDL-C | ||||||
|---|---|---|---|---|---|---|---|
| Quartile | Range (mg/dl) | OR vs. 1 st quartile | 95% CI | Quartile | Range (mg/dl) | OR vs. 4 th quartile | 95% CI |
| 1 st | 1–<77 | 1 st | 1–<31 | 1.20 | 1.09, 1.34 | ||
| 2 nd | 77–<100 | 0.79 | 0.71, 0.87 | 2 nd | 31–<38 | 0.97 | 0.87, 1.08 |
| 3 rd | 100–<128 | 0.80 | 0.72, 0.90 | 3 rd | 38–<47 | 1.08 | 0.98, 1.20 |
| 4 th | 128–<250 | 0.85 | 0.76, 0.96 | 4 th | 47–<150 | ||
∗ Dunnett-Hsu adjustment was used to calculate confidence intervals.


Stay updated, free articles. Join our Telegram channel

Full access? Get Clinical Tree


