Current guidelines recommend shorter door-to-balloon times (DBTs) (<90 minutes) for patients with ST-elevation myocardial infarction (STEMI). Clinical factors, including patient or hospital characteristics, associated with prolonged DBT have been identified, but angiographic variables such as culprit lesion location have not been thoroughly investigated. We aimed to evaluate the effect of culprit artery location on DBT of patients with STEMI who underwent percutaneous coronary intervention (PCI). Data were analyzed from 1,725 patients with STEMI who underwent PCI from August 2008 to March 2014 at 16 Japanese hospitals. Patients were divided into 3 groups according to culprit artery location, right coronary artery (RCA), left anterior descending artery (LAD), and left circumflex artery (LC), and associations with DBT were assessed. The LC group had a trend toward a longer DBT among the 3 groups (97.1 [RCA] vs 98.1 [LAD] vs 105.1 [LC] minutes; p = 0.058). In-hospital mortality was also significantly higher in patients with a left coronary artery lesion (3.5% [RCA] vs 6.3% [LAD] vs 5.4% [LC]; p = 0.041). In-hospital mortality for patients with DBT >90 minutes was significantly higher compared with patients with DBT ≤90 minutes (6.5% vs 3.6%; p = 0.006). Multivariate logistic regression analysis revealed that the LC location was an independent predictor for DBT >90 minutes (odds ratio, 1.45; 95% confidence interval, 1.04 to 2.01; p = 0.028). In conclusion, LC location was an independent predictor of longer DBT. The difficulties in diagnosing LC-related STEMI need further evaluation.
Any association of DBT with angiographic characteristics has not been thoroughly investigated. Acute anterior wall myocardial infarction does not usually affect DBT. A small study demonstrated that lesions of the left main trunk (LMT) might result in longer DBTs. In a small series of myocardial infarction, patients who underwent emergent PCI, a previous study showed the left circumflex artery (LC) to be less likely to present with ST elevation, and ST-segment elevation is detected in <50% of cases with LC territory occlusion because of a lack of corresponding electrocardiographic leads ; however, its association with DBT and outcome was unclear. Analysis from a larger scale data set with well-defined outcome information is needed. Therefore, we sought to investigate whether the culprit of coronary artery location could affect DBT and short-term outcomes along with in-hospital complications in a Japanese multicenter PCI registry.
Material and Methods
The Japanese Cardiovascular Database (JCD) is a large, ongoing, prospective, multicenter cohort study designed to collect clinical background and outcome data on patients who underwent PCI. Data pertaining to approximately 150 variables are being collected. In this registry, participating hospitals were instructed to record data from hospital visits for consecutive patients who underwent PCI and to register these data into an Internet-based database. The database system performs checks to ensure that the reported data are complete and internally consistent. PCIs performed using any coronary devices may be included. The decision to perform PCI is made according to the attending physician’s clinical assessments. The study does not mandate specific interventional or surgical techniques, such as vascular access, or use of a specific stent or closure device.
Most clinical variables in the JCD were defined according to the National Cardiovascular Data Registry, sponsored by the American College of Cardiology, to conduct comparative research and determine the factors that lead to disparities in PCI management. The National Cardiovascular Data Registry is a large PCI registry system with >1,000,000 ischemic heart disease entries and >500,000 PCI entries collected from >500 institutions in the United States.
Before the launch of the JCD, information on the study objectives, its social significance, and an abstract were provided to register this clinical trial with the University Hospital Medical Information Network. This Network is recognized by the International Committee of Medical Journal Editors as an acceptable registry, according to a statement issued in September 2004 (UMIN R000005598).
Major teaching hospitals within the metropolitan Tokyo area were selected for the pilot phase of this study, and the study protocol was approved by the institutional review board committee at each site. In this registry, the data have been collected since September 2008 from 16 Japanese hospitals participating in the JCD. All patients aged >18 years who underwent PCI or an acetylcholine challenge test in these hospitals were enrolled because vasospastic angina accounts for a significant portion of patients with coronary artery disease and acute coronary syndromes in Japan.
DBT was defined as the time from a patient’s initial arrival at a PCI facility to the first balloon inflation of the culprit artery. In this study, we excluded DBTs >240 minutes and culprit lesions of >2 arteries or in the LMT and patients transferred from other hospitals who underwent PCI from all patients with STEMI ( Figure 1 ). We excluded the patients with DBT >240 minutes because they presumably did not receive PCI as a primary reperfusion strategy. Because we wanted to investigate which 3 culprit arteries affected DBT, we excluded the patients with >2 culprit arteries or an LMT lesion. Another reason to exclude LMT was the small number of patients with the LMT as the culprit artery; for most patients, the culprit arteries were the LMT with the left anterior descending artery (LAD) or LC.
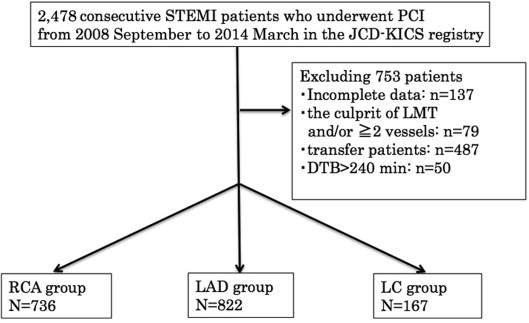
Data were analyzed from the 1,725 patients who underwent consecutive PCI for STEMI at one of the 16 Japanese hospitals participating in the JCD-Keio Interhospital Cardiology Study (KICS) from September 2008 to March 2014 ( Figure 1 ). STEMI was defined as myocardial infarction with ST elevation, equivalent to the definitions provided in the associated guidelines. Anterior-lead ST depression documented as STEMI equivalent by the attending cardiologist was also coded as STEMI. Patients were divided into 3 groups according to culprit artery location based on a diagnostic coronary angiogram performed before their PCI: right coronary artery, LAD, and LC groups. Our study also compared patients with proximal segments versus distal segments. Segments of 1, 6, and 11 were defined as the proximal lesions.
Continuous variables are expressed as means and SDs, and categorical variables are expressed as percentages. Continuous variables were compared using Student’s t test, and differences between categorical variables were examined using a chi-square test. Comparisons between groups were done with analysis of variance using general linear models. A multivariate logistic regression analysis was performed to determine the independent predictors of DBT >90 minutes. Univariate analysis was performed, and factors with a p value <0.25 were included in the multivariate analysis. Factors, at admission, that were evaluated in the multivariate model were women, age >80 years, history of smoking, diabetes mellitus, diabetes mellitus with insulin, hypertension, chronic lung disease, myocardial infarction, cerebrovascular disease, peripheral artery disease, hemodialysis, previous PCI, previous coronary artery bypass grafting, heart failure, cardiopulmonary arrest, the insertion of an intra-aortic balloon pump, LMT stenosis, 3-vessel disease, proximal lesion, type C lesion, and LC as the culprit artery. All statistical calculations and analyses were performed using SPSS, version 22 (SPSS, Chicago, Illinois), and p values <0.05 were considered statistically significant.
Results
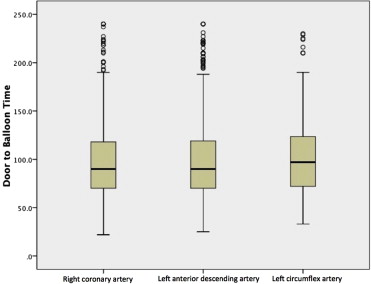
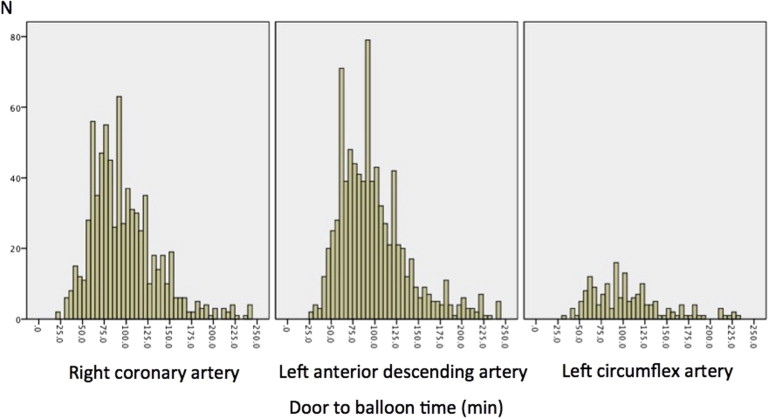
In total, 1,725 patients with STEMI who underwent PCI were analyzed. The average patient age was 65.4 ± 12.7 years, and 357 patients (20.7%) were women. The baseline clinical characteristics of all patients are listed in Table 1 . DBT was 97.1, 98.1, and 105.1 minutes in the right coronary artery, LAD, and LC groups, respectively (p = 0.058, 1-way analysis of variance; Figures 2 and 3 ). The details of in-hospital complications are listed in Table 2 . When the patients were divided into 2 groups (DBT ≤90 minutes and DBT >90 minutes), in-hospital mortality was significantly higher in patients with DBT >90 minutes compared with patients with DBT ≤90 minutes (6.5% vs 3.6%; p = 0.006).
| Coronary Artery | ||||
|---|---|---|---|---|
| Variable | Right (n = 736) | Left anterior descending (n = 822) | Left Circumflex (n =167) | p Value |
| Age, (years) | 66.1 | 65.0 | 64.7 | 0.168 |
| Age >80 years | 122 (16.6%) | 104 (12.7%) | 16 (9.6%) | 0.018 |
| Women | 166 (22.6%) | 154 (18.7%) | 37 (22.2%) | 0.158 |
| Prior Percutaneous coronary intervention | 76 (10.3%) | 84 (10.2%) | 20 (12.0%) | 0.789 |
| Prior Coronary bypass | 16 (2.2%) | 6 (0.7%) | 4 (2.4%) | 0.040 |
| Prior Myocardial infarction | 79 (10.7%) | 74 (9.0%) | 21 (12.6%) | 0.280 |
| Prior heart failure | 30 (4.1%) | 23 (2.8%) | 3 (1.8%) | 0.196 |
| Diabetes mellitus | 227 (30.8%) | 222 (27.0%) | 45 (26.9%) | 0.217 |
| Diabetes mellitus with insulin | 26 (3.5%) | 29 (3.5%) | 6 (3.6%) | 0.999 |
| Hypertension | 476 (64.5%) | 522 (63.5%) | 113 (67.7%) | 0.580 |
| Dyslipidemia | 432 (58.7%) | 446 (54.3%) | 103 (61.7%) | 0.088 |
| Smoker | 352 (47.8%) | 378 (46.0%) | 81 (48.5%) | 0.707 |
| Peripheral artery disease | 34 (4.6%) | 23 (2.8%) | 5 (3.0%) | 0.142 |
| Hemodialysis | 6 (0.8%) | 8 (1.0%) | 0 (0%) | 0.442 |
| Cerebrovascular disease | 48 (6.5%) | 49 (6.0%) | 10 (6.0%) | 0.894 |
| Chronic lung disease | 15 (2.0%) | 24 (3.0%) | 4 (2.4%) | 0.536 |
| Heart failure at admission | 89 (12.1%) | 141 (17.1%) | 18 (10.8%) | 0.007 |
| Cardiogenic shock at admission | 130 (17.7%) | 94 (11.4%) | 14 (8.4%) | <0.001 |
| Cardiopulmonary arrest at admission | 51 (6.9%) | 80 (9.7%) | 17 (10.2%) | 0.106 |
| Intra aortic balloon pump | 123 (16.7%) | 176 (21.4%) | 21 (12.6%) | 0.007 |
| Left main trunk stenosis | 12 (1.6%) | 9 (1.1%) | 1 (0.6%) | 0.459 |
| 2 vessels disease | 248 (33.7%) | 223 (27.1%) | 61 (36.5%) | <0.005 |
| 3 vessels disease | 179 (24.3%) | 124 (15.1%) | 30 (18.0%) | <0.001 |
| Proximal lesion | 226 (30.7%) | 361 (43.9%) | 33 (19.8%) | <0.001 |
| Bifurcation | 75 (10.2%) | 299 (36.4%) | 49 (29.3%) | <0.001 |
| Type C | 167 (22.7%) | 167 (20.3%) | 41 (24.6%) | 0.342 |
| Radial artery approach | 115 (15.6%) | 129 (15.7%) | 31 (18.6%) | 0.622 |
| Coronary Artery | ||||
|---|---|---|---|---|
| Variable | Right (n = 736) | Left anterior descending (n = 822) | Left circumflex (n = 167) | p Value |
| Non-Left circumflex artery (n = 1558) | ||||
| Door to balloon time (min) | 97.1 | 98.1 | 105.1 | 0.058 |
| In-hospital mortality | 26 (3.5%) | 52 (6.3%) | 9 (5.4%) | 0.041 |
| All complications | 270 (17.3%) | 28 (16.8%) | 0.855 | |
| Coronary dissection | 21 (1.3%) | 1 (0.6%) | 0.412 | |
| Coronary perforation | 10 (0.6%) | 1 (0.6%) | 0.947 | |
| Myocardial infarction | 19 (1.2%) | 4 (2.4%) | 0.208 | |
| Cardiogenic shock | 74 (4.7%) | 10 (6.0%) | 0.480 | |
| Heart failiure | 70 (4.5%) | 8 (4.8%) | 0.860 | |
| Cerebral infarction | 9 (0.6%) | 0 (0%) | 0.325 | |
| Intracranial hemorrhage | 2 (0.1%) | 0 (0%) | 0.643 | |
| Cardiac tamponade | 14 (0.9%) | 0 (0%) | 0.219 | |
| Hemodialysis | 22 (1.4%) | 3 (1.8%) | 0.693 | |
| Transfusion | 83 (5.3%) | 3 (1.8%) | 0.046 | |
| All Bleeding | 91 (5.8%) | 10 (6.0%) | 0.939 | |
| Bleeding (access site) | 36 (2.3%) | 4 (2.4%) | 0.945 | |
The predictors of prolonged DBT (>90 minutes) are listed in Table 3 . LC location was an independent predictor for DBT >90 minutes (odds ratio, 1.45; 95% confidence interval, 1.04 to 2.01; p = 0.028).
| Variable | Univariate | Multivariate | ||
|---|---|---|---|---|
| OR (CI) | p Value | OR (CI) | p Value | |
| Women | 1.24 (0.98-1.56) | 0.072 | 1.14 (0.88-1.46) | 0.325 |
| Age >80 | 1.55 (1.17-2.13) | 0.002 | 1.29 (0.96-1.75) | 0.097 |
| Prior Percutaneous coronary intervention | 1.73 (1.26-2.38) | 0.001 | 1.78 (1.11-2.84) | 0.016 |
| Prior Coronary bypass | 3.53 (1.41-8.84) | 0.004 | 2.06 (0.78-5.44) | 0.144 |
| Prior Myocardial infarction | 1.46 (1.07-2.01) | 0.018 | 0.77 (0.48-1.24) | 0.281 |
| Prior heart failure | 1.77 (1.02-3.06) | 0.040 | 1.05 (0.58-1.90) | 0.884 |
| Diabetes mellitus | 1.31 (1.07-1.62) | 0.011 | 1.21 (0.96-1.52) | 0.113 |
| Diabetes mellitus with insulin | 1.63 (0.97-2.76) | 0.063 | 1.10 (0.62-1.96) | 0.738 |
| Hypertension | 1.20 (0.98-1.46) | 0.074 | 1.03 (0.84-1.27) | 0.784 |
| Dyslipidemia | 0.98 (0.81-1.18) | 0.804 | ||
| Smoker | 0.79 (0.65-0.96) | 0.015 | 0.90 (0.73-1.10) | 0.293 |
| Chronic lung disease | 3.11 (1.56-6.21) | 0.001 | 3.11 (1.54-6.29) | 0.002 |
| Peripheral artery disease | 1.94 (1.14-3.29) | 0.013 | 1.61 (0.93-2.81) | 0.091 |
| Hemodialysis | 1.88 (0.63-5.65) | 0.250 | 1.54 (0.49-4.84) | 0.457 |
| Cerebrovascular disease | 1.36 (0.91-2.01) | 0.130 | 1.16 (0.77-1.74) | 0.491 |
| Heart failure at admission | 1.72 (1.31-2.27) | <0.001 | 1.51 (1.13-2.04) | 0.006 |
| Cardiogenic shock at admission | 1.07 (0.81-1.41) | 0.633 | ||
| Cardiopulmonary arrest at admission | 1.29 (0.92-1.81) | 0.144 | 1.25 (0.87-1.80) | 0.226 |
| Intra aortic balloon pump | 1.32 (1.04-1.69) | 0.024 | 1.10 (0.84-1.45) | 0.495 |
| Radial artery approach | 0.89 (0.69-1.15) | 0.377 | ||
| Left main trunk stenosis | 2.25 (0.91-5.56) | 0.070 | 1.66 (0.65-4.27) | 0.294 |
| 3 vessels disease | 1.21 (0.95-1.54) | 0.116 | 1.03 (0.80-1.33) | 0.815 |
| Proximal lesion | 0.88 (0.72-1.07) | 0.202 | 0.88 (0.72-1.08) | 0.212 |
| Bifurcation | 1.00 (0.80-1.24) | 0.981 | ||
| Type C lesion | 1.22 (0.97-1.53) | 0.095 | 1.12 (0.88-1.42) | 0.351 |
| Culprit in left circumflex artery | 1.42 (1.03-1.96) | 0.032 | 1.45 (1.04-2.01) | 0.028 |
Stay updated, free articles. Join our Telegram channel

Full access? Get Clinical Tree


