After repair of tetralogy of Fallot, right ventricular (RV) mass and mass:volume ratio may reflect RV remodeling and adverse outcomes. This study aimed to evaluate the relation of RV mass to functional health status and subsequent adverse RV remodeling and to determine whether RV mass measurement in systole could improve reproducibility. In 53 patients with tetralogy of Fallot (median 29 years old) who previously underwent cardiovascular magnetic resonance and completed the Short Form 36, version 2 (Optum, Eden Prairie, MN), short-axis images were analyzed for RV end-diastolic volume and diastolic and systolic mass, indexed to body surface area. The most recent subsequent cardiovascular magnetic resonance study (before pulmonary valve or conduit replacement) was evaluated for change in RV end-diastolic volume and ejection fraction. Diastolic indexed mass ≥37.3 g/m 2 (odds ratio 7.6, p = 0.02) predicted decreased general health scores. In patients with normal RV ejection fraction, indexed mass correlated with Physical Component Summary and general health scores. RV diastolic mass:volume ratio >0.2 had a strong association with subsequent increase in RV end-diastolic volume (odds ratio 26.1, p = 0.002). Systolic RV mass measurement had excellent correlation with diastolic measurement (r = 0.97, p <0.0001), but did not improve intraobserver or interobserver variability. In conclusion, RV mass relates to functional health status and adverse RV remodeling and can be measured with good reproducibility. RV mass should be routinely evaluated in this population and is best measured in diastole; further study is necessary to evaluate longitudinal changes in functional health status and RV parameters.
After repair of tetralogy of Fallot (TOF), patients often have free pulmonary insufficiency and a varying degree of right ventricular (RV) outflow tract obstruction, but the optimal timing of pulmonary valve replacement is unclear. Much attention has focused on ventricular size and function, but recent data suggest that RV mass, specifically mass:volume ratio, may be an important marker of ventricular remodeling, as it predicts adverse outcomes in patients with repaired TOF. The potential relation between RV mass and functional health status has not been demonstrated. In addition, although RV mass measurement by cardiovascular magnetic resonance (CMR) has been shown to accurately reflect actual RV weight on autopsy, several studies have shown lesser reproducibility of RV mass measurement than other parameters, which may be related to the thin wall of the RV in diastole. It is unclear whether this measurement would be more reliable in systole, when the RV thickens, and borders may be more clearly defined. This study aimed to determine whether RV mass in patients with repaired TOF is related to functional health status and RV remodeling in this population, and whether measurement variability would improve with measurement in systole rather than diastole.
Methods
This study included patients with repaired TOF, age ≥14 years, who were referred for clinically indicated CMR from June 2008 to December 2009 and were prospectively enrolled as part of a previous cross-sectional study evaluating CMR predictors of functional health status. Patients were excluded if they had pulmonary atresia or absent pulmonary valve, additional significant cardiac malformations (e.g., atrioventricular septal defect), contraindications to CMR or gadolinium, CMR performed under anesthesia, or cognitive impairment preventing completion of the health status assessment. Additionally, patients were also excluded if the health status assessment was completed >3 months from time of CMR or if short-axis images were not available for analysis.
CMR was performed using a commercially available 1.5 T scanner (Philips Intera Achieva, Best, The Netherlands). Cine images were obtained with a breath-hold, electrocardiographic-gated, segmented k-space, steady-state free precession sequence. End-diastolic and end-systolic phases were manually chosen for the RV. RV endocardial and epicardial contours were manually drawn in both end-diastole and end-systole on short-axis images, using QMass software (Medis, Leiden, The Netherlands). Contours were compared with long-axis images to confirm the plane of the tricuspid valve annulus. RV mass was indexed to body surface area or to end-diastolic volume (mass:volume ratio).
On enrollment, typically on the day of CMR, subjects completed the Short Form 36, version 2 (SF-36), which provides a measure of multiple domains of health and functioning. The Physical Component Summary score and the subscales of physical functioning (ability to perform physical activities), role-physical (participation in work or usual activities without physical limitations), and general health (perception of general health and its likelihood to change) were chosen to represent the physical impact of the disease. Scores were normalized for age based on population-based normative data. As previous reports demonstrated only small differences between patients with TOF and controls, an age-adjusted z-score ≤−1 was considered a clinically significant decrease in functional health status.
To evaluate the relation of RV mass to subsequent remodeling, a subset of patients from the initial cohort with an additional clinically indicated CMR study was evaluated. Measurements were taken from the most recent CMR, before any pulmonary valve or conduit replacement. A relative increase in RV end-diastolic volume of 10% from the initial measurement or an absolute decrease in RV ejection fraction of 5% was considered clinically significant. RV indexed mass and mass:volume ratio on the initial CMR study was compared with subsequent increase in RV volume or decrease in RV ejection fraction.
For reproducibility of diastolic and systolic measurements, all CMR studies were analyzed by a single observer (JCL) and reanalyzed at least 1 month later for intraobserver variability. For interobserver variability, a subset of 29 patients was analyzed by a second observer (JTC), blinded to the initial measurements.
Data are presented as frequency with percent for categorical variables and mean ± SD or median with interquartile range as appropriate for continuous variables. Receiver operating characteristic curves were used to determine the cutoffs of each RV mass measurement for predicting SF-36 scores, optimizing specificity. Sensitivity, specificity, and positive predictive value for the cutoffs were reported. Odds ratios with 95% confidence intervals were calculated for clinically significant decreased health status or changes in RV end-diastolic volume or ejection fraction. Changes in RV end-diastolic volume or ejection fraction from initial assessment to follow-up measurement were examined using the paired t test. Correlations between systolic and diastolic RV measurements, as well as between RV mass measurements and SF-36 scores in the patients with normal RV ejection fraction, were also evaluated by Pearson or Spearman correlation coefficient, as appropriate. RV ejection fraction was previously shown to be the best predictor of functional health status, and the subset of patients with normal RV ejection fraction was chosen to determine whether RV mass could be an adjunctive measure for further risk stratification. Values of p <0.05 were considered statistically significant. Intraclass correlation coefficients, coefficients of variation, and limits of agreement were used to evaluate interobserver and intraobserver variability on each RV measurement.
Results
In the initial cohort, 62 of 65 consecutive patients met inclusion criteria (1 declined participation, and an investigator was not available for consent for 2). Of these patients, 5 had pulmonary atresia or absent pulmonary valve and were excluded; 3 did not complete the SF-36 within 3 months of CMR. In 1 patient, short-axis images were not available for analysis. Patient and clinical characteristics of the remaining 53 patients are described in Table 1 .
| Male | 31 (58.5%) |
| Age at CMR (years) | 29.4 (20.8-41.3) |
| Age at repair (years) | 3.5 (0.8-5.4) |
| Body surface area (m 2 ) | 1.88 ± 0.27 |
| Type of TOF | |
| Pulmonary stenosis | 42 (72.4%) |
| Unknown | 11 (19.0%) |
| Type of TOF repair | |
| Transannular patch | 31 (58.5%) |
| Valve-sparing | 10 (18.9%) |
| Conduit | 4 (7.5%) |
| Unknown | 8 (15.1%) |
| Left ventricular ejection fraction (%) | 53.6 ± 7.5 |
| RV end-diastolic indexed volume (ml/m 2 ) | 148.7 ± 49.5 |
| RV end-systolic indexed volume (ml/m 2 ) | 83.9 ± 36.4 |
| RV ejection fraction (%) | 44.8 ± 9.0 |
| RV diastolic indexed mass (g/m 2 ) | 27.7 ± 7.7 |
| RV systolic indexed mass (g/m 2 ) | 24.9 ± 7.4 |
| RV diastolic mass:volume ratio (g/ml) | 0.19 ± 0.04 |
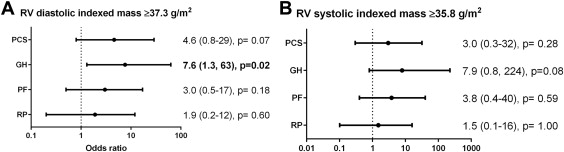
SF-36 scores in this population were previously reported and were similar to the population norm, except for a small but statistically significant decrease in general health. RV diastolic indexed mass ≥37.3 g/m 2 conveyed increased odds of decreased general health scores ( Figure 1 ), although Physical Component Summary scores did not reach significance. Diastolic indexed mass ≥37.3 g/m 2 had 95% specificity, 31% sensitivity, and 71% positive predictive value for decreased general health scores. RV systolic indexed mass did not reach significance for decreased general health scores.
In the subset of patients with normal RV systolic function (ejection fraction ≥45%), indexed RV mass (either diastolic or systolic) correlated with Physical Component Summary scores and general health subscale scores ( Table 2 ). RV end-diastolic volume did not correlate with functional health status.
| Diastolic | Systolic | |
|---|---|---|
| Physical Component Summary | 0.41 (0.03) | 0.48 (0.01) |
| Physical Functioning | 0.18 (0.37) | 0.30 (0.13) |
| Role Physical | 0.20 (0.31) | 0.30 (0.12) |
| General Health | 0.47 (0.01) | 0.59 (0.001) |
Only 1 patient (2%) in this cohort had RV diastolic mass:volume ratio >0.3. Neither RV diastolic mass:volume ratio ≥0.2 nor systolic mass:volume ratio ≥0.19 predicted decreased SF-36 scores.
A subset of 24 patients had subsequent CMR before pulmonary valve or conduit replacement, a median 3.7 years (interquartile range 2.5 to 4.0) after initial study. There was no significant difference in pulmonary regurgitant fraction at follow-up (33.7 ± 19.7% vs 32.0 ± 21.0%, p = 0.38), but indexed RV end-diastolic volume increased at the follow-up study (148 ± 42 vs 137 ± 43 ml/m 2 , p = 0.02), with 9 patients having an increase >10% from the initial measurement. There was also a small but statistically significant decrease in RV ejection fraction (47 ± 8% vs 45 ± 9%, p = 0.03), with only 1 patient having an absolute decrease of 5% in ejection fraction. RV diastolic mass:volume ratio >0.2 was associated with subsequent increase in RV end-diastolic volume (odds ratio 26.1, 95% confidence interval 2.9 to 765, p = 0.002).
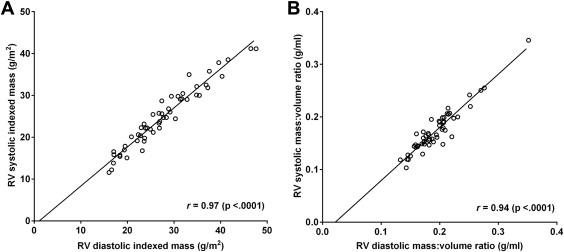
RV indexed mass measurement in systole correlated very well with diastolic measurement ( Figure 2 ), but mildly underestimated indexed mass relative to diastole (mean difference 2.8 g/m 2 , limits of agreement −0.9 to 6.5). RV systolic mass:diastolic volume ratio also correlated very well with diastolic measurement ( Figure 2 ), with minimal underestimation relative to diastole (mean difference 0.02, limits of agreement −0.01 to 0.05).
Intraobserver and interobserver reproducibility of all RV measurements was excellent ( Table 3 ). Bland-Altman plots for limits of agreement are presented in Figures 3 and 4 . Reproducibility of systolic mass was similar to minimally worse than reproducibility of diastolic mass measurements.


