Sleep apnea and obesity are strongly associated, and both increase the risk for coronary artery disease. Several cross-sectional studies have reported discrepant results regarding the role obesity plays in the relation between sleep apnea and coronary artery calcium (CAC), a marker of subclinical coronary disease. The aim of the present study was to investigate the association between sleep apnea and the presence of CAC in a community cohort of middle-aged men and women without preexisting cardiovascular disease, stratified by body mass index (<30 vs ≥30 kg/m 2 ). Participants underwent electron-beam computed tomography to measure CAC and underwent home sleep testing for sleep apnea. The presence of CAC was defined as an Agatston score >0. Sleep apnea was analyzed categorically using the apnea-hypopnea index. The sample was composed of primarily men (61%) and Caucasians (56%), with a mean age of 61 years. The prevalence of CAC was 76%. In participants with body mass indexes <30 kg/m 2 (n = 139), apnea-hypopnea index ≥15 (vs <5) was associated with 2.7-fold odds of having CAC, but the effect only approached significance. Conversely, in participants with body mass indexes ≥30 kg/m 2 , sleep apnea was not independently associated with CAC. In conclusion, sleep apnea is independently associated with early atherosclerotic plaque burden in nonobese patients.
Highlights
- •
Greater sleep apnea severity is associated with CAC.
- •
This association may exist primarily in nonobese subjects.
- •
Treatment of sleep apnea may be important for attenuating atherosclerotic progression.
In the present study, we investigated the association of sleep apnea and subclinical coronary atherosclerosis as defined by coronary artery calcium (CAC) scoring in a community cohort of middle-aged men and women without preexisting cardiovascular disease. We anticipated that the association between sleep apnea and CAC would be masked or minimized by the presence of obesity given the known effects of obesity on coronary atherosclerotic burden. Data were stratified by body mass index (BMI) (<30 vs ≥30 kg/m 2 ). We hypothesized that the effect of sleep apnea on CAC presence would be stronger in nonobese relative to obese participants.
Methods
Participants were recruited from a prospective, community-based cohort study, Heart Strategies Concentrating on Risk Evaluation (Heart SCORE), designed to investigate racial disparities in cardiovascular risk in 2,000 participants. Heart SCORE eligibility criteria included age 45 to 75 years, residence in the greater Pittsburgh metropolitan area, ability to undergo baseline and annual follow-up visits, and absence of a known co-morbidities expected to limit life expectancy to <5 years. Participants were classified into 1 of 3 groups: preexisting cardiovascular disease (previous myocardial infarction, coronary revascularization, or stroke), moderate or high (>10%) probability of a cardiovascular disease event in the next 10 years, or low probability of cardiovascular disease events on the basis of Framingham risk score profiles. For the present analysis, we examined baseline data and excluded participants with preexisting cardiovascular disease and/or missing data on cardiovascular risk factors. Electron-beam computed tomography and home sleep testing for sleep apnea were not performed on all participants, so CAC and sleep apnea data were available for a total of 324 participants. We included participants who underwent electron-beam computed tomography and home sleep testing within 24 months of each other (n = 276) and excluded participants who had changes in BMI of ±2 kg/m 2 within the period between electron-beam computed tomography and home sleep testing assessments (n = 24), to account for potentially altered CAC profiles. The final sample for the present analysis included 252 participants. The present analysis had greater proportions of men and subjects with diabetes and/or hypertension compared with the Heart SCORE population. The Heart SCORE protocol was approved by the institutional review board at the University of Pittsburgh Medical Center, and all participants provided written informed consent.
During the baseline visit, detailed demographic and medical histories were collected. Height and weight were measured to calculate BMI. The medical history inquired about histories of previously diagnosed hypertension, hyperlipidemia, and diabetes mellitus, as well as current medications. Rest blood pressure measurement was based on the average of 2 seated blood pressure measurements by trained nurses. Laboratory assessment of lipoprotein levels were performed on venous blood drawn in the fasting state. Age, gender, race and ethnicity, and smoking status (current or past smoker, yes or no) were self-reported.
Dyslipidemia was defined as high-density lipoprotein cholesterol ≤40 mg/dl, total cholesterol ≥200 mg/dl, or self-reported treatment for dyslipidemia. Hypertension was defined as diastolic blood pressure ≥90 mm Hg and/or systolic blood pressure ≥140 mm Hg, or self-reported use of antihypertensive medication. Diabetes was defined as a self-reported diagnosis, current use of antidiabetic medication, or fasting glucose ≥110 mg/dl.
Sleep apnea was assessed with a previously validated portable monitor that measures airflow and snoring by a nasal pressure signal (ApneaLink; ResMed Corp, San Diego, California). An apnea was defined as a decrease in airflow of ≥80% from baseline for ≥10 seconds. A hypopnea was defined as a decrease in airflow of >30% to <80% from baseline for ≥10 seconds. Sleep apnea was analyzed categorically using the apnea-hypopnea index (AHI): 0 to 4, 5 to 14, and ≥15 events/hour.
Electron-beam computed tomographic image acquisition was performed with an Imatron C150 scanner (GE Imatron Inc., South San Francisco, California). To evaluate the coronary arteries, 30 to 40 contiguous 3-mm-thick transverse images were obtained from the level of the aortic root to the apex of the heart during maximal breath holding. Images were acquired by using electrocardiographic triggering (80% of the RR interval) of 100-ms exposure during the same phase of the cardiac cycle. Calcium scores were calculated by the Agatston method, on the basis of the detection of ≥3 contiguous pixels >130 Hounsfield units. Presence of CAC was defined as an Agatston score >0.
Differences in demographic characteristics were compared among the 3 sleep apnea groups (AHI <5, 5 to 14, and ≥15) using chi-square tests for categorical variables and analysis of variance with post hoc comparison for continuous variable. The nonparametric Kruskal-Wallis test was used to compare the median values of CAC scores among the sleep apnea groups. Frequencies of the presence of CAC were calculated among the 3 groups in the overall population and within nonobese and obese (BMI <30 vs ≥30 kg/m 2 ). Multivariate logistic regression controlling for age, gender, race and ethnicity (Caucasian and other vs African-American), smoking status, diabetes, hypertension, dyslipidemia, and BMI was used to calculate the odds ratio of the presence of CAC among subjects with no sleep apnea (AHI <5 [the reference group]), mild sleep apnea (AHI 5 to 14), and moderate to severe sleep apnea (AHI ≥15). SPSS for Windows version 20 (SPSS, Inc., Chicago, Illinois) was used for all statistical analyses.
Results
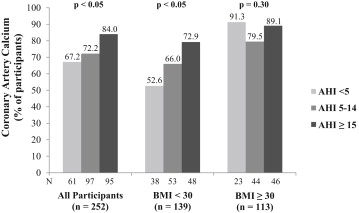
Demographic and clinical characteristics of the sample are listed in Table 1 . The prevalence of CAC in the total sample was 75%. The frequency of CAC presence increased with the severity of sleep apnea (chi-square = 6.54, p <0.05; Figure 1 ). In analysis adjusted for age, gender, race and ethnicity, smoking status, diabetes, hypertension, and dyslipidemia, the odds ratio for the presence of CAC was 2.33 (95% confidence interval 1.01 to 5.38) for participants with AHIs ≥15 compared with those with AHIs <5 (p <0.05; Table 2 ). The association was no longer significant after adjusting for BMI. No significant difference in presence of CAC was found between those with AHIs of 5 to 14 and those with AHIs <5.
| Variable | Apnea Hypopnea Index | Total sample (N = 252) | p-value ∗ | ||
|---|---|---|---|---|---|
| < 5 (n = 61) | 5-14 (n = 97) | ≥ 15 (n = 94) | |||
| Age, mean (SD) (years) | 59.1 ± 7.8 | 60.9 ± 7.6 | 62.0 ± 6.5 | 60.9 ± 7.3 | 0.05 |
| Male | 29 (48%) | 48 (49%) | 64 (68%) | 141 (56%) | 0.008 |
| Female | 32 (52%) | 49 (51%) | 30 (32%) | 111 (44%) | |
| European American | 29 (52%) | 66 (68%) | 59 (63%) | 156 (62%) | 0.84 |
| African American | 32 (48%) | 31 (32%) | 35 (37%) | 96 (38%) | |
| BMI, mean (SD) (kg/m 2 ) | 29.0 ± 5.8 | 29.9 ± 4.5 | 30.4 ± 5.0 | 29.9 ± 5.0 | 0.26 |
| AHI, mean (SD) | 2.7 ± 1.1 | 9.0 ± 2.7 | 26.9 ± 12.3 | 14.1 ± 12.7 | |
| Current/past smoker | 33 (54%) | 60 (62%) | 46 (49%) | 137 (55%) | 0.19 |
| Diabetes Mellitus | 10 (16%) | 22 (23%) | 19 (20%) | 50 (20%) | 0.63 |
| Prehypertension | 13 (21%) | 19 (20%) | 18 (19%) | 50 (20%) | 0.94 |
| Hypertension ‡ | 43 (71%) | 65 (67%) | 71 (75%) | 179 (71%) | 0.53 |
| Dyslipidemia § | 45 (77%) | 81 (83%) | 65 (69%) | 192 (76%) | 0.10 |
| CAC score, median (range) | 18.3 (0 – 786) | 18.1 (0 – 1359) | 64.2 (0 – 1115) | 38.5 (0 – 1359) | 0.01 † |
∗ P values based on Pearson χ 2 test and analysis of variance.
† P value based on Kruskall-Wallis test.
‡ Hypertension was defined as diastolic blood pressure ≥ 90 mm Hg and/or systolic blood pressure ≥ 140 mm Hg, or self-reported usage of antihypertensive medication.
§ Dyslipidemia was defined as having blood lipid concentrations within the following parameters, HDL cholesterol ≤ 40 mg/dL, total cholesterol ≥ 200 mg/dL, or self-reported treatment for dyslipidemia.
| AHI Score (compared to < 5) | OR | 95% CI | p-value | |
|---|---|---|---|---|
| Adjusted for age, gender, race/ethnicity, smoking status, diabetes, hypertension, and dyslipidemia | ||||
| Total Sample (n = 252) | 5-14 | 0.97 | (0.46 – 2.06) | 0.94 |
| ≥ 15 | 2.33 | (1.01 – 5.38) | 0.04 | |
| AHI Score (compared to < 5) | OR | 95% CI | p-value | |
|---|---|---|---|---|
| Adjusted for above covariates + BMI | ||||
| Total Sample (n = 252) | 5-14 | 0.72 | (0.33 – 1.61) | 0.43 |
| ≥ 15 | 1.71 | (0.71 – 4.13) | 0.23 | |
| AHI Score (compared to < 5) | OR ∗ | 95% CI | p-value | |
|---|---|---|---|---|
| BMI < 30 (n = 139) | 5-14 | 1.12 | (0.40 – 3.14) | 0.83 |
| ≥ 15 | 2.70 | (0.88 – 8.33) | 0.08 | |
Stay updated, free articles. Join our Telegram channel

Full access? Get Clinical Tree


