We investigated the clinical profiles associated with serum uric acid (sUA) levels in a large cohort of patients hospitalized for worsening chronic heart failure with ejection fraction (EF) ≤40%, with specific focus on gender, race, and renal function based interactions. In 3,955 of 4,133 patients (96%) with baseline sUA data, clinical characteristics and outcomes were compared across sUA quartiles. The primary end points were all-cause mortality and a composite of cardiovascular mortality or heart failure hospitalization. Interaction analyses were performed for gender, race, and baseline renal function. Median follow-up was 9.9 months. Mean sUA was 9.1 ± 2.8 mg/dl and was higher in men than in women (9.3 ± 2.7 vs 8.7 ± 3.0 mg/dl, p <0.001) and in blacks than in whites (10.0 ± 2.7 vs 9.0 ± 2.8 mg/dl, p <0.001). Higher sUA was associated with lower systolic blood pressure and EF, higher natriuretic peptides, and more impaired renal function. After accounting for 24 baseline covariates, in patients with enrollment estimated glomerular filtration rate ≥30 ml/min/1.73 m 2 , sUA was strongly associated with increased all-cause mortality (hazard ratio 1.44, 95% confidence interval 1.22 to 1.69, p <0.001) and the composite end point (hazard ratio 1.44, 95% confidence interval 1.26 to 1.64, p <0.001). However, in patients with estimated glomerular filtration rate <30 ml/min/1.73 m 2 , sUA was not related with either end point (both p >0.4). Adjusted interaction analyses for gender, race, and admission allopurinol use were not significant. In conclusion, sUA is commonly elevated in patients hospitalized for worsening chronic heart failure and reduced EF, especially in men and blacks. The prognostic use of sUA differs by baseline renal function, suggesting different biologic and pathophysiologic significance of sUA among those with and without significant renal dysfunction.
Highlights
- •
Mean serum uric acid (sUA) during hospitalization for heart failure is high (∼9 mg/dl).
- •
sUA is associated with lower ejection fraction, higher B-type natriuretic peptide, and impaired renal function.
- •
sUA is independently predictive of postdischarge outcomes in estimated glomerular filtration rate ≥30 ml/min/1.73 m 2 .
Hospitalization for worsening chronic heart failure (WCHF) is a unique entity, distinguished by acute perturbations in clinical, neurohormonal, and laboratory indexes. Serum uric acid (sUA) levels have been shown to fluctuate with WCHF hospitalizations in large, prospectively-followed ambulatory patients with heart failure (HF). Consistently, studies have suggested that sUA is a marker of adverse prognosis in the setting of WCHF. sUA may be strongly influenced by impaired renal function, race, gender, and diuretic therapy. The Efficacy of Vasopressin Antagonism in Heart Failure Outcome Study with Tolvaptan (EVEREST) trial database provides detailed, longitudinal, patient-level data on sUA and other clinical parameters during and after hospitalization for WCHF. Thus, we aimed to evaluate the independent association between sUA at the time of enrollment and clinical characteristics and postdischarge outcomes in patients hospitalized for WCHF with reduced ejection fraction (EF).
Methods
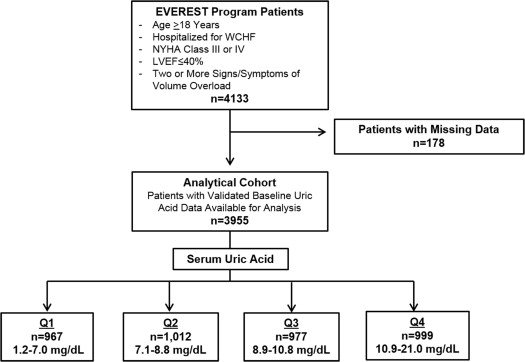
The study design and primary results of the EVEREST trial have been previously described. In brief, EVEREST was a global, multicenter, double-blinded, placebo-controlled randomized trial examining tolvaptan, an oral vasopressin-2 receptor antagonist. Patients eligible for enrollment were ≥18 years of age, hospitalized for WCHF with New York Heart Association III-IV functional status, EF ≤40% and presenting with ≥2 signs or symptoms of volume overload. Relevant exclusion criteria include serum creatinine >3.5 mg/dl; subjects currently treated with hemofiltration or dialysis; refractory, end-stage HF; or a life expectancy <6 months. The ethics committee and institutional review board of each participating trial center approved the study protocol. Patients were randomized to receive oral tolvaptan 30 mg fixed once daily or matching placebo within 48 hours of hospital admission and was continued for at least 60 days. Laboratory samples were collected, processed, and cross validated across 5 central facilities.
sUA (mg/dl) was measured at the time of study enrollment (baseline, up to 48 hours after admission) and every 4 to 8 weeks up to 112 weeks postdischarge. There was little evidence for nonlinearity in the relation between sUA and clinical end points, across a physiological range of sUA. Enrollment sUA levels were divided into quartiles and effect sizes are presented in reference to quartile 1 (lowest). For complete interaction analyses, sUA was treated as a continuous function, and effect sizes are presented per 5 mg/dl increase in sUA. Serial postdischarge sUA levels are presented by presence or absence of the primary end points. The overall study design and final analytical cohort selection are displayed in Figure 1 .
Demographic characteristics including self-reported race, signs and/or symptoms of HF, vital signs, laboratory parameters, initial electrocardiographic findings, medical history, and admission medications were compared across quartiles of baseline sUA levels. Baseline characteristics and clinical outcomes were also presented separately for men, women, whites, and blacks. An independent blinded adjudication committee determined the specific causes of death and reasons for rehospitalization. The present post hoc analysis used the same 2 co-primary end points as the overall EVEREST trial: all-cause mortality (ACM) and a composite end point of cardiovascular mortality or HF hospitalization. Secondary end points included other causes of death and rehospitalization, worsening HF (defined as death, hospitalization, or unplanned office visit for HF), and combined cardiovascular mortality and rehospitalization. Median follow-up in the EVEREST trial was 9.9 months (interquartile range 5.3 to 16.1 months).
Continuous variables are expressed as mean ± SD if normally distributed and as median (interquartile range) if non-normally distributed. Categorical variables are expressed as number (%). Outcomes were assessed as time to first event using Cox proportional hazard models. Kaplan-Meier curves by sUA quartile were constructed for the both primary end points and compared using log-rank tests. The proportional hazards assumption (by Kolmogorov-type supremum tests for nonproportionality) was upheld. Effect sizes were reported as hazard ratios (HR) with 95% confidence intervals (CI).
Multivariate models included 24 prespecified covariates including tolvaptan treatment assignment, demographic characteristics (age, gender, and region of origin), vital signs on admission (supine systolic blood pressure), laboratory testing (EF, serum sodium, blood urea nitrogen, and B-type natriuretic peptide), initial admission electrocardiogram (QRS duration and presence of atrial fibrillation), clinical characteristics (ischemic HF origin, coronary artery disease, diabetes, hypertension, chronic obstructive pulmonary disease, chronic kidney disease [CKD], and New York Heart Association class IV), and baseline medication use (allopurinol, angiotensin converting enzyme-inhibitors, angiotensin II receptor blockers, β blockers, mineralocorticoid receptor antagonists, digoxin, and intravenous inotropes).
Multiple imputation procedures (fully conditional specification method) were used to impute any missing covariate data (∼28% for natriuretic peptides, 4% for QRS duration, 2% for jugular venous distension, and ≤2% for all other variables). No evidence of significant collinearity between baseline sUA and the covariate set was detected. Separate interaction analyses were performed for gender, race, estimated glomerular filtration rate (eGFR) <30 ml/min/1.73 m 2 (by the Modification of Diet in Renal Disease formula), and admission allopurinol use. This cutoff in eGFR was selected a priori because sUA does not appear to predict further declines in renal function in stage IV and V CKD and may be differentially associated with clinical end points in this population compared with preserved or mildly impaired renal function. Because tolvaptan is known to increase sUA as early as day 1 of hospitalization, treatment assignment was also included as an interaction term. All statistical analyses were performed using SAS version 9.2 (SAS Institute Inc, Cary, North Carolina).
Results
Of the 4,133 patients enrolled in the EVEREST program, 178 patients had missing baseline sUA levels (4.3%) and were excluded. The remaining cohort (n = 3,955) was divided into sUA quartiles Q1 (n = 967, range 1.2 to 7.0 mg/dl), Q2 (n = 1,012, range 7.1 to 8.8 mg/dl), Q3 (n = 977, range 8.9 to 10.8 mg/dl), and Q4 (n = 999, range 10.9 to 21.0 mg/dl). sUA was normally distributed with a mean of 9.1 ± 2.8 mg/dl and median of 8.8 (interquartile range 7.1 to 10.9 mg/dl; Figure 2 ). sUA was higher in men than in women (9.3 ± 2.7 vs 8.7 ± 3.0 mg/dl; Supplementary Figure 1 ) and higher in blacks than in whites (10.0 ± 2.7 vs 9.0 ± 2.8 mg/dl; Supplementary Figure 2 ).
Table 1 presents the baseline characteristics by sUA quartiles. Patients in the highest sUA quartile were more likely to be younger, men, black, and from North America (all comparisons p <0.001). On admission, higher sUA was associated with lower systolic and diastolic blood pressures (p <0.001), higher heart rates (p = 0.02), and lower EF (p <0.001). Patients in the highest sUA quartiles had more jugular venous distension and elevated natriuretic peptides (both p <0.001). These patients more frequently had a history of stage IV and V CKD with elevated blood urea nitrogen and serum creatinine on admission (p <0.001). Higher sUA was associated with less ischemic HF origin (p = 0.03), New York Heart Association class IV symptoms (p <0.001), and increased previous coronary artery bypass grafting and percutaneous coronary interventions (p <0.001). Allopurinol was used in 440 patients at admission, ranging from 15.4% in quartile 1 to 8.5% in quartile 4 (p <0.001). Admission angiotensin converting enzyme-inhibitor and angiotensin II receptor blocker use was less frequently reported in higher sUA quartiles, whereas intravenous inotrope use was higher (p <0.001 for both). Similar patterns and trends were observed across gender and race subgroups ( Supplementary Tables 1 to 4 ).
| Variable | Baseline Serum Uric Acid Quartiles | p-value | |||
|---|---|---|---|---|---|
| I (n=967) | II (n=1,012) | III (n=977) | IV (n=999) | ||
| Serum uric acid, (mg/dL), mean±SD | 5.8±1 | 8±0.5 | 9.8±0.6 | 12.9±1.8 | |
| Serum uric acid, (mg/dL), range | 1.2-7.0 | 7.1-8.8 | 8.9-10.8 | 10.9-21.0 | |
| Tolvaptan assignment | 514 (53.2%) | 494 (48.8%) | 464 (47.5%) | 504 (50.5%) | 0.073 |
| Age (years), mean±SD | 67.1±10.7 | 66.1±11.8 | 65.4±12 | 64.5±12.7 | <0.001 |
| Male | 637 (65.9%) | 754 (74.5%) | 774 (79.2%) | 780 (78.1%) | <0.001 |
| Race | <0.001 | ||||
| Non-Hispanic White | 869 (89.9%) | 876 (86.6%) | 836 (85.6%) | 816 (81.7%) | |
| Black | 42 (4.3%) | 63 (6.2%) | 73 (7.5%) | 107 (10.7%) | |
| Asian | 1 (0.1%) | 1 (0.1%) | 2 (0.2%) | 5 (0.5%) | |
| Hispanic | 40 (4.1%) | 59 (5.8%) | 47 (4.8%) | 45 (4.5%) | |
| Other | 16 (1.7%) | 14 (1.4%) | 21 (2.1%) | 31 (3.1%) | |
| Region | <0.001 | ||||
| Eastern Europe | 494 (51.1%) | 452 (44.7%) | 379 (38.8%) | 245 (24.5%) | |
| North America | 205 (21.2%) | 268 (26.5%) | 298 (30.5%) | 415 (41.5%) | |
| South America | 144 (14.9%) | 172 (17%) | 171 (17.5%) | 189 (18.9%) | |
| Western Europe | 124 (12.8%) | 120 (11.9%) | 129 (13.2%) | 150 (15%) | |
| Weight (kg), mean±SD | 79.8±18.2 | 82±18.1 | 85±18.1 | 86.2±20.4 | <0.001 |
| Systolic blood pressure (mmHg), mean±SD | 124.9±20.5 | 121.7±19.6 | 120.3±19.6 | 115.2±17.9 | <0.001 |
| Diastolic blood pressure (mmHg), mean±SD | 74.3±12.5 | 73±12.4 | 73±12.9 | 70.4±12.7 | <0.001 |
| Heart rate (bpm), mean±SD | 78.8±14.8 | 79.2±15.5 | 80.3±16.4 | 80.7±15.7 | 0.019 |
| Jugular venous distension ≥ 10 cm | 196 (20.7%) | 248 (24.8%) | 291 (30.4%) | 308 (32.1%) | <0.001 |
| Rales | 801 (83.7%) | 823 (82.1%) | 772 (79.9%) | 774 (79.8%) | 0.083 |
| Peripheral edema ∗ | 778 (81.3%) | 789 (78.7%) | 767 (79.3%) | 783 (80.6%) | 0.450 |
| Dyspnea | 882 (92.3%) | 897 (89.5%) | 891 (92.2%) | 874 (90.4%) | 0.078 |
| Ejection fraction (%), mean±SD | 29.6±7.8 | 28.2±7.8 | 27.1±8 | 25.4±8.2 | <0.001 |
| Blood urea nitrogen (mg/dL), median (IQR) | 20 (17-27) | 24 (19-31) | 27 (21-35) | 35 (26-48) | <0.001 |
| Creatinine (mg/dL), median (IQR) | 1 (0.9-1.3) | 1.2 (1-1.4) | 1.3 (1.1-1.6) | 1.5 (1.3-1.9) | <0.001 |
| Estimated GFR (mL/min/1.73 m2), mean±SD † | 65.8±21.9 | 60.3±20.1 | 53.8±18.9 | 44.4±17.4 | <0.001 |
| Estimated GFR<30 (mL/min/1.73 m2) † | 58 (6.1%) | 53 (5.3%) | 88 (9.2%) | 223 (22.7%) | <0.001 |
| Sodium (mEq/L), median (IQR) | 140 (138-143) | 140 (138-142) | 140 (137-143) | 139 (136-142) | <0.001 |
| B-type natriuretic peptide (pg/ml), median (IQR) | 481 (194-1137) | 538.5 (254-1284) | 746 (316-1474) | 1106.5 (543-2126) | <0.001 |
| N-terminal pro-B-type natriuretic peptide (pg/ml) median (IQR) | 4070 (1650-8824) | 3641 (1661-7468) | 4256 (2241-8662) | 6800 (3642-12837) | <0.001 |
| Albumin (g/dL), median (IQR) | 3.8 (3.5-4.1) | 3.8 (3.4-4.1) | 3.8 (3.4-4.2) | 3.7 (3.3-4) | <0.001 |
| QRS (ms), median (IQR) | 121 (95-144) | 121 (97-150) | 123 (97-152) | 125 (100-155) | <0.001 |
| Atrial fibrillation | 258 (26.7%) | 277 (27.4%) | 311 (31.8%) | 288 (28.8%) | 0.060 |
| Previous heart failure hospitalization | 740 (76.7%) | 783 (77.7%) | 786 (80.9%) | 810 (81.5%) | 0.019 |
| Ischemic heart failure etiology | 659 (68.9%) | 653 (65.4%) | 641 (66.4%) | 614 (62.5%) | 0.031 |
| NYHA class IV | 323 (33.4%) | 371 (36.7%) | 401 (41%) | 468 (47%) | <0.001 |
| Coronary artery disease | 689 (71.4%) | 725 (71.6%) | 687 (70.4%) | 685 (68.6%) | 0.423 |
| Previous myocardial infarction | 485 (50.2%) | 518 (51.2%) | 506 (51.8%) | 492 (49.3%) | 0.678 |
| Hypertension | 693 (71.7%) | 717 (70.8%) | 693 (70.9%) | 705 (70.6%) | 0.958 |
| Hypercholesterolemia | 450 (46.9%) | 491 (48.8%) | 473 (48.6%) | 499 (50.2%) | 0.549 |
| Diabetes | 379 (39.2%) | 387 (38.2%) | 363 (37.2%) | 401 (40.1%) | 0.563 |
| Chronic kidney disease | 137 (14.2%) | 216 (21.3%) | 280 (28.7%) | 421 (42.2%) | <0.001 |
| Peripheral vascular disease | 205 (21.2%) | 223 (22.1%) | 191 (19.5%) | 209 (21%) | 0.585 |
| Previous coronary bypass | 159 (16.4%) | 207 (20.5%) | 209 (21.4%) | 253 (25.3%) | <0.001 |
| Previous percutaneous coronary intervention | 141 (14.6%) | 174 (17.2%) | 181 (18.5%) | 205 (20.5%) | 0.006 |
| Automatic implantable cardioverter-defibrillator | 125 (12.9%) | 127 (12.5%) | 152 (15.6%) | 173 (17.3%) | 0.007 |
| Chronic obstructive pulmonary disease | 73 (7.5%) | 98 (9.7%) | 100 (10.2%) | 124 (12.4%) | 0.004 |
| Baseline medication use | |||||
| Allopurinol | 149 (15.4%) | 110 (10.9%) | 96 (9.8%) | 85 (8.5%) | <0.001 |
| Diuretics | 931 (96.5%) | 987 (97.7%) | 951 (97.4%) | 976 (98%) | 0.166 |
| ACEI/ ARB | 823 (85.3%) | 880 (87.1%) | 837 (85.8%) | 796 (79.9%) | <0.001 |
| Beta-Blockers | 667 (69.1%) | 725 (71.8%) | 706 (72.3%) | 696 (69.9%) | 0.346 |
| Mineralocorticoid receptor antagonists | 511 (53%) | 573 (56.7%) | 550 (56.4%) | 516 (51.8%) | 0.065 |
| Digoxin | 438 (45.4%) | 496 (49.1%) | 493 (50.5%) | 489 (49.1%) | 0.132 |
| Intravenous Inotropes | 33 (3.4%) | 32 (3.2%) | 44 (4.5%) | 71 (7.1%) | <0.001 |
| Statin | 345 (35.8%) | 368 (36.4%) | 319 (32.7%) | 339 (34%) | 0.289 |
∗ Peripheral edema was defined as slight/ moderate/ marked pedal or sacral edema.
† Glomerular filtration rate estimated by Cockcroft-Gault formula.
There were a total of 1,040 ACM events and 1,627 composite end points (cardiovascular mortality or HF hospitalization) over the median follow-up timeframe of 9.9 months. Rates of ACM increased with increasing sUA levels in a step-wise fashion from quartile 1 (18.6%) to quartile 4 (39.1%, p <0.001; Table 2 ). Similarly, rates of the composite end point increased from 30.3% to 54.8% (p <0.001). Analysis of secondary end points revealed similar trends of increasing event rates with higher sUA levels for cardiovascular mortality, worsening HF, HF mortality, and hospitalization (p <0.001 for all end points). Rates of myocardial infarction, stroke morbidity, or mortality did not differ by sUA quartile. Times to first event were also significantly different by the Kaplan-Meier method across sUA quartiles for ACM ( Figure 3 ; log rank p <0.001) and the composite end point ( Figure 3 ; log rank p = 0.004). Compared with the lowest quartile of sUA, the adjusted hazard increased with higher sUA levels for ACM (Q2: HR 1.14, 95% CI 0.96 to 1.34, p = 0.129; Q3: HR 1.22, 95% CI 1.02 to 1.46, p = 0.033; Q4: HR 1.33, 95% CI 1.10 to 1.61, p = 0.004) and the composite end point (Q2: HR 1.10, 95% CI 0.96 to 1.25, p = 0.185; Q3: HR 1.23, 95% CI 1.07 to 1.43, p = 0.005; Q4: HR 1.38, 95% CI 1.18 to 1.62, p <0.001). Tolvaptan assignment did not modify the association between sUA and the primary outcomes, ACM (interaction term p = 0.31), and the composite end point (interaction term p = 0.45). Thus, even in a placebo-restricted subgroup, sUA (per 5 mg/dl increase) was robustly predictive of excess ACM (HR 1.75, 95% CI 1.51 to 2.02, p <0.001) and the composite end point (HR 1.69, 95% CI 1.50 to 1.90, p <0.001). Supplementary Figure 3 depicts the individual adjusted HR for increasing deciles of sUA (p = 0.007 for ACM trend and p <0.001 for composite end point trend).
| Baseline Serum Uric Acid Quartiles | p-value | ||||
|---|---|---|---|---|---|
| I (n=967) | II (n=1,012) | III (n=977) | IV (n=999) | ||
| Serum uric acid, (mg/dL), mean (SD) | 5.8±1 | 8±0.5 | 9.8±0.6 | 12.9±1.8 | |
| Serum uric acid, (mg/dL), range | 1.2-7.0 | 7.1-8.8 | 8.9-10.8 | 10.9-21.0 | |
| Primary Endpoints | |||||
| All-cause mortality | 180 (18.6%) | 212 (20.9%) | 257 (26.3%) | 391 (39.1%) | <0.001 |
| CV mortality + HF hospitalization | 293 (30.3%) | 362 (35.8%) | 425 (43.5%) | 547 (54.8%) | <0.001 |
| Secondary Endpoints | |||||
| CV mortality | 136 (14.1%) | 158 (15.6%) | 211 (21.6%) | 296 (29.6%) | <0.001 |
| CV mortality + CV hospitalization | 354 (36.6%) | 445 (44%) | 478 (48.9%) | 603 (60.4%) | <0.001 |
| Worsening HF ∗ | 256 (26.5%) | 308 (30.4%) | 371 (38%) | 496 (49.6%) | <0.001 |
| HF mortality | 70 (7.2%) | 81 (8%) | 102 (10.4%) | 179 (17.9%) | <0.001 |
| HF hospitalization | 192 (19.9%) | 245 (24.2%) | 283 (29%) | 377 (37.7%) | <0.001 |
| MI mortality | 5 (0.5%) | 8 (0.8%) | 7 (0.7%) | 7 (0.7%) | 0.900 |
| MI hospitalization | 9 (0.9%) | 11 (1.1%) | 16 (1.6%) | 6 (0.6%) | 0.153 |
| Stroke mortality | 4 (0.4%) | 8 (0.8%) | 6 (0.6%) | 5 (0.5%) | 0.713 |
| Stroke hospitalization | 12 (1.2%) | 15 (1.5%) | 14 (1.4%) | 8 (0.8%) | 0.502 |
Stay updated, free articles. Join our Telegram channel

Full access? Get Clinical Tree


