Obesity has been associated with subclinical left ventricular (LV) diastolic dysfunction and increased risk of heart failure. Few data are available on the relative contribution of adiposity distribution and changes in myocardial structure and function. We evaluated the influence of visceral versus subcutaneous abdominal adipose tissue and epicardial fat on LV diastolic function after acute myocardial infarction. One month after acute myocardial infarction, 225 consecutive patients were prospectively enrolled and underwent anthropometric evaluation, bioimpedance analysis, detailed echocardiography, and multidetector 64-slice computed tomography scan for quantification of epicardial fat volume (EFV) and of total, subcutaneous and visceral abdominal fat areas. We found a significant association between LV diastolic dysfunction parameters and body mass index, fat-mass percentage, and waist-to-height ratio. E′ velocity and E/E′ ratio were correlated with total and visceral abdominal fat (r = −0.27, p <0.001 and r = 0.21, p <0.01, respectively), but not with subcutaneous fat. After multivariate analysis, increasing EFV was associated with decreased E′ velocity (adjusted β −0.11, 95% confidence interval −0.19 to −0.03; p <0.01) and increased E/E′ ratio (adjusted β 0.19, 95% confidence interval 0.07 to 0.31, p <0.01). Patients with diastolic dysfunction showed higher EFV (116.7 ± 67.9 ml vs 93.0 ± 52.3 ml, p = 0.01), and there was a progressive increase in EFV according to diastolic dysfunction grades (p = 0.001). None of the adiposity parameters correlated with ejection fraction or S′ velocities. In conclusion, in patients after myocardial infarction, impaired LV diastolic function was associated with increased adiposity, especially with visceral and central fat parameters. Increasing EFV was independently associated with worse LV diastolic function.
Highlights
- •
Adiposity distribution was assessed by computed tomography scan for visceral and/or subcutaneous fat area and epicardial fat volume.
- •
Increased total adiposity parameters were associated with impaired diastolic function.
- •
Visceral fat, but not subcutaneous fat, was related with diastolic dysfunction.
- •
Epicardial adipose tissue was independently associated with worse diastolic function.
- •
No relation was found between any adiposity parameter and systolic function.
Few previous studies have assessed the relative importance of visceral versus subcutaneous adiposity as determinants of left ventricular (LV) diastolic dysfunction. The few data available suggest that visceral fat, the most metabolically active fat depot, can be a more important determinant of diastolic dysfunction. Moreover, the heart itself is covered by fat, the epicardial adipose tissue (EAT). Because EAT secretes proinflammatory, proatherogenic, and prothrombotic adipokines, and there is no physical barrier separating it from the adjacent myocardium and coronary arteries, EAT can have a local metabolic role by a paracrine effect. In fact, several studies have demonstrated that EAT is associated with the development and progression of coronary artery disease, independently of other cardiovascular risk factors or other fat deposits and also with changes in myocardial structure and function. In this study we aimed to assess: (1) the role of total versus central adiposity parameters as determinants of diastolic dysfunction after myocardial infarction, (2) the relative importance of total, subcutaneous, and visceral abdominal fat mass in this association, (3) the influence of EAT on myocardial systolic and diastolic functions.
Methods
The present study included 225 consecutive patients referred to a cardiac rehabilitation program, 1 month after an acute myocardial infarction. Exclusion criteria were age >75 years, inability to exercise, severe valvular heart disease, moderate or severe chronic lung disease, atrial fibrillation, or exercise-induced myocardial ischemia. All patients were prospectively enrolled and were submitted on the same day to clinical evaluation (performed by a cardiologist), anthropometric evaluation, detailed transthoracic echocardiography, computed tomography (CT) scan, and blood sample collection. The investigation conforms to the principles outlined in the Declaration of Helsinki and was approved by the institution’s ethical committee. All patients gave their written informed consent.
Measurements included height, weight, and waist circumference. Body mass index (BMI) was calculated for each subject. Waist circumference was measured at the midpoint between the iliac crest and the lower rib margins, in the midaxillary line. According to World Health Organization criteria, overweight was defined as BMI between 25 and 30 kg/m 2 and obesity as BMI >30 kg/m 2 . Abdominal obesity was defined as waist circumference >102 cm in men and >88 cm in women. Hip-to-height and waist-to-height ratios were calculated as the ratio between hip circumference (cm) or waist circumference (cm), respectively, and height (m). Body composition was assessed by bioelectrical impedance analysis (Tanita Corporation, Arlington Heights, Illinois) to determine body fat percentage (%).
All echocardiographic studies were acquired by a single experienced cardiologist using an ultrasound system (iE33, Philips Medical Systems, Best, The Netherlands) equipped with an S5-1 transducer. Images were digitally stored for posterior offline analysis. Cardiac chambers dimensions; volumes, and LV mass were measured according to current recommendations. Mitral inflow velocities were assessed using pulse-wave Doppler in the apical 4-chamber view, with a 3 mm sample placed between the tips of the mitral leaflets; velocities were recorded at end expiration and averaged over 3 consecutive cardiac cycles. Pulse-wave tissue-Doppler velocities were acquired at end expiration, in the apical 4-chamber view, with the sample positioned at the septal and lateral mitral annulus. Pulse-wave Doppler velocities at the upper right pulmonary vein were also recorded. For all parameters the average of 3 consecutive heartbeats was recorded.
Diastolic function was assessed according to the recent consensus guidelines on diastolic function evaluation by determining peak early (E) and late (A) diastolic mitral inflow velocities; deceleration time of early LV filling (DT); the E/A ratio; the septal, lateral and average myocardial annular tissue velocities (E′ sep, E′ lat, and E′ mean, respectively); the E/E′ ratio (septal, lateral, and mean E/E′); pulmonary vein flow analysis (to calculate the Ard-Ad difference: the time difference between the duration of the atrial reversal wave of the pulmonary flow–Ard–and the mitral A-wave duration–Ad); and isovolumic relaxation time. Using the recent European Association of Echocardiography/American Society of Echocardiography guidelines on diastolic function evaluation, patients were categorized in diastolic dysfunction grades normal, grade I (mild diastolic dysfunction), grade II (moderate diastolic dysfunction), and grade III (severe diastolic dysfunction) by 2 independent cardiologists who were blinded for the study data. In case of discordance, each case was discussed individually, and if doubt persisted no grade was endorsed, which happened in 20 patients (8.9%).
Multidetector CT scans were performed in all patients using a 64-slice CT scanner (SOMATOM Sensation 64, Siemens Medical Solutions, Forchheim, Germany) with 2 different acquisitions: 1 for abdominal fat quantification and the other for epicardial adipose tissue quantification. To assess abdominal fat, a single-slice abdominal CT scan was performed between L4 and L5, according to the method described by Borkan et al. The scan parameters were 120 kV and 216 mA with 5 mm thickness. This resulted in an estimated radiation exposure of 0.06 mSv. On the scan obtained, a cursor pointer was used to trace the abdominal visceral fat area, and the data were processed using a histogram-based statistical program according to the previously described method. One expert, unaware of the patient’s details, measured abdominal fat distribution. Fat tissue was defined in the range between −150 and −50 Hounsfield units. Total abdominal fat area was measured and subcutaneous fat area was obtained by subtracting abdominal visceral fat from the total abdominal fat area.
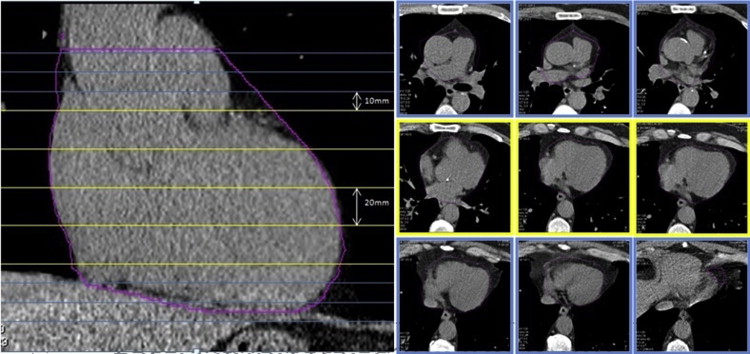
An experienced radiographer, blinded for the purpose of the study and the patient’s anthropometric data, quantified epicardial fat volume (EFV). A cursor pointer was used to manually trace the pericardial contour using 1 mm-thick reconstructed axial slices. Pericardium contour was traced for every 10 mm, starting from the lower visible level of pulmonary artery bifurcation until the top level of the pulmonary valve, for every 20 mm from there until the first slice where the diaphragm becomes visible and again for every 10 mm from this point until the last slice where pericardium is still visible, as illustrated in Figure 1 . The pericardium contour was extrapolated by the software, syngo Volume (Siemens Medical Solutions, Inc) for the nontraced slices and rechecked by the operator. Within these anatomical limits, EAT was identified using the adipose tissue attenuation references (from −150 to −50 Hounsfield units) and a final EFV resulted from the sum of all slices of fat values.
Statistical analysis was performed with SPSS program version 20 (IBM Corp, Armonk, NY). All continuous variables are shown as a mean ± SD for normally distributed variables or as a median and interquartile range for non-normally distributed variables. Categorical variables are expressed as a number (n) and percentage (%). Statistical significance was defined as p <0.05. Pearson and spearman correlation coefficients (r), as appropriate, were analyzed to access the correlations between cardiac function and structure echocardiographic and adiposity parameters obtained by anthropometry and CT scan. To compare median values of several adiposity parameters according to diastolic function grades, nonparametric tests were used (Mann-Whitney and Kruskal-Wallis tests, accordingly). Linear regression analysis was performed for univariate and multivariate analyses of fat distribution variables that predict worse diastolic function. Multivariate analysis was performed accordingly with adjustment for age, hypertension, gender, and several fat depots.
Results
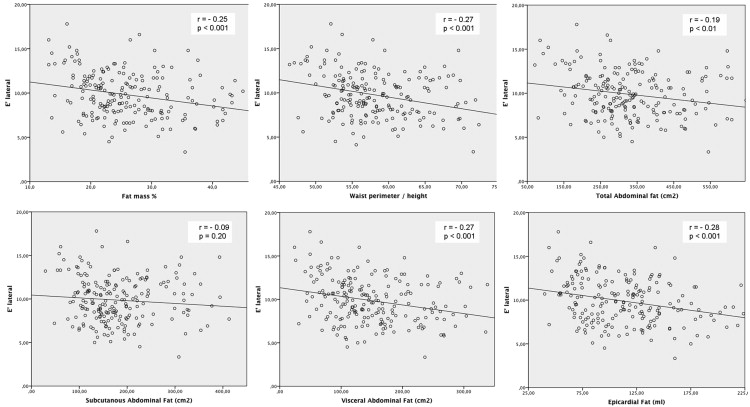
The clinical, anthropometric and analytical characteristics of the study population are listed in Table 1 . Most patients were men (84%), with a mean age of 55.1 ± 10.9 years, 47.6% were overweight and 20.9% were obese. The mean ejection fraction was 53.6 ± 9.3% and most patients (64.4%) had some degree of diastolic dysfunction. As listed in Table 2 , there was a significant correlation between BMI and decreased early diastolic velocity (E′ lateral) and increased LV filling pressures (E/E′ mean). Fat-mass percentage, assessed by bioelectric impedance analysis, was also inversely correlated with E′ septal velocity, E′ lateral velocity (as shown in Figure 2 ), and E/E′ mean ratio. In contrast, as listed in Table 3 , there was a significant increase in fat-mass percentage, according to the classification in diastolic dysfunction grades (p for trend <0.01). After multivariate analysis, with adjustment for age, gender, and hypertension history, the association between fat-mass percentage and early diastolic velocities (E′ septal and lateral) remained significant, as listed in Table 4 .
| Age, years | 55.1 ± 10.9 |
| Male | 189 (84.0%) |
| Cardiovascular risk factors | |
| Hypertension | 35 (15.6%) |
| Type 2 Diabetes Mellitus | 35 (15.6%) |
| Dyslipidemia | 119 (52.9%) |
| Smoker | 117 (52.0%) |
| Familial history | 22 (9.8%) |
| ST-elevation myocardial infarction | 85 (37.8%) |
| Non ST-elevation myocardial infarction | 140 (62.2%) |
| Percutaneous coronary intervention | 191 (84.9%) |
| Overweight | 107 (47.6%) |
| Obese | 47 (20.9%) |
| Body mass index (Kg/m 2 ) | 26.9 ± 4.5 |
| Weight (kg) | 76.0 ± 12.9 |
| Waist perimeter (cm) | 96.8 ± 10.0 |
| Bioimpedance fat mass (%) | 26.0 ± 7.3 |
| Total abdominal fat (cm 2 ) | 343.1 ± 163.8 |
| Subcutaneous fat (cm 2 ) | 182.5 ± 82.6 |
| Visceral fat (cm 2 ) | 148.7 ± 70.5 |
| Epicardial fat (cm 3 ) | 113.6 ± 43.2 |
| Total cholesterol (mg/dL) | 137.5 ± 32.3 |
| HDL (mg/dL) | 39.9 ± 10.3 |
| LDL (mg/dL) | 75.4 ± 35.5 |
| Triglycerides (mg/dL) | 123.3 ± 56.7 |
| Glucose (mg/dL) | 97.1 ± 18.8 |
| Hemoglobin (g/L) | 14.1 ± 1.4 |
| A1c hemoglobin (%) | 5.9 ± 0.9 |
| NT-ProBNP (ng/L) | 357.0 ± 531.0 |
| Echocardiography | |
| Septum (mm) | 9.6 ± 1.6 |
| Posterior wall (mm) | 9.3 ± 1.5 |
| Left ventricle mass index (g/m 2 ) | 105.3 ± 25.0 |
| Relative wall thickness | 0.35 ± 0.07 |
| Left atrium volume (ml/m 2 ) | 34.8 ± 9.3 |
| Left ventricle end-diastolic volume (ml/m 2 ) | 111.3 ± 30.6 |
| Left ventricle end-systolic volume (ml/m 2 ) | 52.4 ± 22.4 |
| Left ventricular ejection fraction (%) | 53.6 ± 9.3 |
| E wave velocity (cm/s) | 78.1 ± 19.4 |
| A wave velocity (cm/s) | 68.1 ± 17.6 |
| E/A ratio | 1.22 ± 0.50 |
| Deceleration time (ms) | 221.8 ± 49.8 |
| Isovolumic relaxation time (ms) | 98.7 ± 24.4 |
| E’ lateral velocity (cm/s) | 9.8 ± 2.3 |
| E’ septal velocity (cm/s) | 6.9 ± 1.8 |
| E/E’ mean ratio | 10.4 ± 3.9 |
| Normal diastolic function | 80 (39.0%) |
| Grade 1 diastolic dysfunction | 57 (27.8%) |
| Grade 2 diastolic dysfunction | 58 (28.3%) |
| Grade 3 diastolic dysfunction | 10 (4.9%) |
| E’ septal | E’ lateral | E/E’ lateral | E/E’septal | E/E’ mean | |
|---|---|---|---|---|---|
| BMI | -0.11 (p=0.11) | -0.16 (p=0.02) | 0.21 (p=0.001) | 0.18 (p=0.01) | 0.18 (p<0.01) |
| Fat mass percentage | -0.26 (p<0.001) | -0.25 (p<0.001) | 0.29 (p<0.001) | 0.31 (p<0.001) | 0.28 (p<0.001) |
| Waist perimeter/height | -0.27 (p<0.001) | -0.27 (p<0.001) | 0.28 (p<0.001) | 0.30 (p<0.001) | 0.28 (p<0.001) |
| Total abdominal fat | -0.19 (p<0.01) | -0.20 (p<0.01) | 0.26 (p<0.001) | 0.23 (p=0.001) | 0.22 (p<0.01) |
| Subcutaneous abdominal fat | -0.10 (p=0.15) | -0.09 (p=0.20) | 0.20 (p<0.01) | 0.20 (p<0.01) | 0.17 (p=0.02) |
| Visceral abdominal fat | -0.23 (p=0.001) | -0.27 (p<0.001) | 0.25 (p<0.001) | 0.21 (p<0.01) | 0.21 (p<0.01) |
| Epicardial fat | -0.26 (p<0.001) | -0.28 (p<0.001) | 0.28 (p<0.001) | 0.24 (p<0.001) | 0.25 (p<0.001) |
| Normal Diastolic function (n=80) | Grade 1 Diastolic Dysfunction (n= 57) | Grade 2 Diastolic Dysfunction (n= 58) | Grade 3 Diastolic Dysfunction (n= 10) | p value (for trend) | |
|---|---|---|---|---|---|
| BMI | 25.8 ± 4.23 | 26.9 ± 5.6 | 26.8 ± 3.7 ∗ | 25.7 ± 10.9 | 0.17 |
| Fat mass % | 22.1 ± 7.9 | 25.5 ± 11.7 † | 25.9 ± 9.2 † | 24.8 ± 16.1 | <0.01 |
| Waist perimeter/height | 55.4 ± 7.0 | 58.3.0 ± 7.1 † | 58.5 ± 7.9 † | 56.2 ± 15.4 | <0.01 |
| Total abdominal fat | 270.0 ± 151.6 | 331.1 ± 149.3 ∗ | 321.0 ± 170.5 † | 308.8 ±300.6 | 0.02 |
| Subcutaneous abdominal fat | 155.32 ± 90.5 | 165.4 ± 99.6 | 175.3 ±74.7 | 194.4 ± 135.9 | 0.13 |
| Visceral abdominal fat | 111.6 ± 103.7 | 141.0 ± 75.9 † | 160.0 ± 88.8 † | 134.0 ± 155.6 | 0.01 |
| Epicardial fat | 93.0 ± 52.3 | 111.15 ± 60.2 ∗ | 117.15 ± 64.3 † | 136.4 ± 83.1 † | 0.001 |
∗ p <0.05 compared to patients with normal diastolic function.
† p <0.01 compared to patients with normal diastolic function.
| E’ septal velocity | E’ lateral velocity | E/E’ ratio | |||||||
|---|---|---|---|---|---|---|---|---|---|
| Crude β (95% CI) | Adjusted β ∗ (95% CI ∗ ) | p value ∗ | Crude β (95% CI) | Adjusted β ∗ (95% CI ∗ ) | p value ∗ | Crude β (95% CI) | Adjusted β ∗ (95% CI ∗ ) | p value ∗ | |
| BMI | -0.05 (-0.10 to 0.00) | -0.05 (-0.09 to -0.01) | 0.02 | -0.08 (-0.16 to -0,01) | -0.09 (-0.16 to -0,02) | <0.01 | 0.09 (-0.03 to 0.20) | 0.10 (-0.01 to 0.22) | 0.08 |
| Fat mass % | -0.06 (-0.09 to -0.03) | -0.04 (-0.07 to 0.00) | 0.04 | -0.09 (-0.14 to -0.04) | -0.08 (-0.13 to -0.02) | <0.01 | 0.09 (0.01 to 0.16) | 0.08 (-0.02 to 0.17) | 0.11 |
| WP/height | -0.09 (-0.13 to -0.05) | -0.05 (-0.09 to -0.01) | 0.02 | -0.13 (-0.19 to -0.07) | -0.09 (-0.15 to -0.03) | <0.01 | 0.11 (0.02 to 0.21) | 0.09 (-0.01 to 0.19) | 0.07 |
| Total abdominal Fat (x10) | -0.03 (-0.05 to -0.01) | 0.02 (-0.04 to 0.00) | 0.07 | -0.05 (-0.07 to -0.02) | -0.03 (-0.06 to 0.00) | 0.03 | 0.04 (0.00 to 0.09) | 0.04 (-0.01 to 0.08) | 0.09 |
| Subcutaneous abdominal fat (x10) | -0.02 (-0.05 to 0.01) | -0.02 (-0.05 to 0.00) | 0.23 | -0.03 (-0,08 to 0.01) | -0.04 (-0.08 to 0.00) | 0.07 | 0.04 (-0.03 to 0.11) | 0.04 (-0.03 to 0.11) | 0.25 |
| Visceral abdominal fat (x10) | -0.06 (-0.09 to -0.03) | -0.03 (-0.06 to 0.01) | 0.15 | -0.10 (-0.15 to -0.05) | -0.05 (-0.10 to 0.00) | 0.04 | 0.08 (0.001to 0.16) | 0.08 (0.00 to 0.16) | 0.06 |
| Epicardial fat (x10) | -0.11 (-0.17 to -0.06) | -0.06 (-0.12 to -0.01) | 0.02 | -0.17 (-0.25 to -0.09) | -0.11 (-0.19 to -0.03) | <0.01 | 0.19 (0.07 to 0.31) | 0.19 (0.06 to 0.32) | <0.01 |
Stay updated, free articles. Join our Telegram channel

Full access? Get Clinical Tree


