With the growing understanding of the role of inflammation in patients with atherosclerotic disease, studies have focused on high-sensitivity C-reactive protein (hs-CRP) and other inflammatory markers in their association with outcomes in ST-segment elevation myocardial infarction. The goal of this study was to investigate the association of the neutrophil/lymphocyte (N/L) ratio and in-hospital major adverse cardiac events (MACEs) in patients with ST-segment elevation myocardial infarction undergoing primary percutaneous coronary intervention (PCI). The association of hs-CRP and N/L ratio on admission with Thrombolysis In Myocardial Infarction (TIMI) flow grade after PCI was assessed in 418 consecutive primary patients with PCI. The N/L ratio was significantly higher in the no-reflow group (TIMI grade 0/1/2 flow, n = 158) compared to that of the normal-flow group (TIMI grade 3 flow, n = 260, 4.6 ± 1.7 vs 3.1 ± 1.9, p <0.001). In-hospital MACEs were significantly higher in patients with no reflow (23% vs 7%, p <0.001). There was a significant and positive correlation between hs-CRP and N/L ratio (r = 0.657, p <0.001). In receiver operating characteristic analysis, N/L ratio >3.3 predicted no reflow with 74% sensitivity and 83% specificity. In a multivariate regression model, N/L ratio remained an independent correlate of no reflow (odds ratio [OR] 1.54, 95% confidence interval [CI] 1.34 to 1.76, p <0.001) and in-hospital MACEs (OR 1.14, 95% CI 0.98 to 1.32, p = 0.043). The N/L ratio, an inexpensive and easily measurable laboratory variable, is independently associated with the development of no reflow and in-hospital MACEs in patients with ST-segment elevation myocardial infarction undergoing primary PCI.
The neutrophil-to-lymphocyte (N/L) ratio represents the balance between neutrophil and lymphocyte levels in the body and can be an indicator of systemic inflammation. A high N/L ratio was an independent predictor of death and future risk of acute myocardial infarction in patients without previous acute myocardial infarction who were assessed angiographically for coronary artery disease and were followed long term. In addition, the N/L ratio has been associated with long-term mortality in patients with ST-segment elevation myocardial infarction. Little is known, however, about the association of N/L ratio levels with coronary blood flow in the setting of ST-segment elevation myocardial infarction. The goal of this study was to evaluate the association of the N/L ratio with coronary blood flow after percutaneous coronary intervention (PCI) and in-hospital major advanced cardiac events (MACEs) in patients with ST-segment elevation myocardial infarction undergoing primary PCI.
Methods
In total 418 consecutive patients with ST-segment elevation myocardial infarction (78% men, mean age 59.4 ± 12.4 years) admitted within 6 hours from symptom onset were prospectively enrolled in the present study. All participants were treated with primary PCI. ST-segment elevation myocardial infarction was defined as typical chest pain >30 minutes with ST-segment elevation of >1 mm in ≥2 consecutive leads on electrocardiogram or new-onset left bundle brunch block. Patients were divided into 2 groups based on Thrombolysis In Myocardial Infarction (TIMI) flow grade. No reflow after PCI was defined as TIMI flow grade 0 and 1 or 2 (group 1), and angiographic success was defined as TIMI grade 3 flow (group 2). Exclusion criteria included treatment with thrombolytic drugs in previous 24 hours, active infections, previously proved systemic inflammatory disease, known malignancy, and end-stage liver and renal failures. Informed consent was obtained from all patients and the local ethics committee and institutional review board of the Erciyes University School of Medicine approved the protocol.
All primary PCI procedures were performed using the standard femoral approach with a 7-Fr guiding catheter. After administration of intravenous heparin 5,000 IU (70 U/kg) and a loading dose of clopidogrel 300 mg, direct stenting was performed whenever possible; in the remaining cases, balloon predilatation was performed. We used the TIMI thrombus grade scale to evaluate the clot burden in patients with ST-segment elevation myocardial infarction. In TIMI thrombus grade 0, no cine-angiographic characteristics of thrombus are present; in TIMI thrombus grade 1, possible thrombus is present with such angiographic characteristics as decreased contrast density, haziness, irregular lesion contour, or a smooth convex “meniscus” at the site of total occlusion suggestive but not diagnostic of thrombus; in TIMI thrombus grade 2, there is definite thrombus, with the largest dimensions ≤1/2 the vessel diameter; in TIMI thrombus grade 3, there is definite thrombus but with the largest linear dimension >1/2 but <2 vessel diameters; in TIMI thrombus grade 4, there is definite thrombus, with the largest dimension ≥2 vessel diameters; and in TIMI thrombus grade 5, there is total occlusion. Choice of stents (bare-metal or drug-eluting stent) was left to the operator’s discretion. In patients who were treated with tirofiban, the agent was administrated after the primary PCI procedure in the coronary care unit. Systemic bolus of tirofiban was at the operator’s discretion, as was the 12-hour continuous infusion. To achieve maximal dilation, an intracoronary injection of nitroglycerin 100 μg preceded each coronary angiogram. Three independent interventional cardiologists assessed TIMI flow grade. Intra- and interobserver variables were obtained from random samples of 100 patients. Intra- and interobserver variables for TIMI 0 and TIMI 1 were 7% and 8%, respectively; for TIMI flow grade 2, corresponding values were 2% and 4%, respectively; and intra- and interobserver variabilities for TIMI 3 were 0%.
In all patients, antecubital venous blood samples for laboratory analysis were drawn upon admission into the emergency room. High-sensitivity C-reactive protein (hs-CRP) was measured using a BN2 model nephelometer (Dade-Behring, Inc., Newark, Delaware) within 5 minutes of sampling. Common blood counting parameters were measured by a Sysmex K-1000 (Block Scientific, Bohemia, New York) autoanalyzer within 5 minutes of sampling. Transthoracic echocardiography was performed for each patient immediately after primary PCI in the intensive cardiac care unit. All measurements were performed using a commercially available machine (Vivid 7, GE Medical System, Horten, Norway) with a 3.5-MHz transducer. The Simpson method in the 2-dimensional echocardiographic apical 4-chamber view was used to assess left ventricular ejection fraction.
MACEs were defined as in-stent thrombosis, nonfatal myocardial infarction, and in-hospital mortality during the in-hospital follow-up period. In-stent thrombosis was defined as angiographically documented total occlusion. Nonfatal myocardial infarction was defined as recurrent chest pain and/or development of new electrocardiographic changes accompanied by a new increase ≥20% of cardiac biomarkers measured after the recurrent event. In-hospital mortality had to be verified as death from myocardial infarction, cardiac arrest, or other cardiac causes.
Continuous variables were tested for normal distribution by Kolmogorov–Smirnov test. Continuous data were reported as mean ± SD or median if not normally distributed and compared using Student’s t test or Mann–Whitney U test between groups. Categorical variables were summarized as percentages and compared with chi-square test. We compared the mean N/L ratio with TIMI flow grades using a 1-way analysis of variance model. Pearson correlation coefficients examined the degree of association between examined variables. A p value <0.05 was considered statistically significant. Receiver operating characteristics curve was used to determine the sensitivity and specificity of hs-CRP and the N/L ratio and the optimal cut-off value for predicting poor coronary flow after primary PCI in patients with ST-segment elevation myocardial infarction. Associations of different variables with no reflow and in hospital MACE were calculated in univariate analysis. Variables for which the unadjusted p value was <0.10 in logistic regression analysis were identified as potential risk markers and included in the full multivariate model. Backward elimination multivariate logistic regression analyses using likelihood ratio tests to eliminate variables were used. A p value <0.05 was considered statistically significant. All statistical analyses were performed using SPSS 15.0 (SPSS, Inc., Chicago, Illinois).
Results
Baseline characteristics are listed in Table 1 . There were 158 patients (mean age 62 ± 12 years, 73% men) in group 1 and 260 patients (mean age 59 ± 13 years, 81% men) in group 2. Mean age was significantly older in group 1 (p = 0.007). With respect to coronary risk factors, there were significant differences in the presence of diabetes mellitus (p <0.001) and previous coronary artery disease (p <0.001).
| Variable | TIMI Flow Grade | p Value | |
|---|---|---|---|
| 0–2 | 3 | ||
| (n = 158) | (n = 260) | ||
| Age (years) | 62.1 ± 12.0 | 58.7 ± 12.5 | 0.007 |
| Men | 116 (73%) | 211 (81%) | 0.063 |
| Hypertension | 74 (47%) | 104 (40%) | 0.171 |
| Diabetes mellitus | 69 (44%) | 42 (16%) | <0.001 |
| Smoke | 92 (58%) | 143 (55%) | 0.519 |
| Previous coronary artery disease | 50 (32%) | 31 (12%) | <0.001 |
| Body mass index (kg/m 2 ) | 26.4 ± 2.5 | 25.9 ± 2.6 | 0.112 |
| Peak creatinine kinase-MB (U/L) | 58.8 ± 43.6 | 51.4 ± 45.3 | 0.127 |
| Troponin I (ng/ml) | 5.3 ± 4.3 | 5.0 ± 4.1 | 0.528 |
| High-sensitivity C-reactive protein (mg/L) | 35.7 ± 24.1 | 12.0 ± 8.1 | <0.001 |
| Glomerular filtration rate (ml/min/1.73 m 2 ) | 80.2 ± 21.5 | 83.1 ± 19.5 | 0.126 |
| Left ventricular ejection fraction on admission (%) | 47.9 ± 9.6 | 49.6 ± 10.1 | 0.102 |
| Triglyceride (mg/dl) | 112.1 ± 54.3 | 119.0 ± 69.6 | 0.283 |
| Low-density lipoprotein (mg/dl) | 120.0 ± 35.0 | 118.6 ± 35.8 | 0.696 |
| High-density lipoprotein (mg/dl) | 36.4 ± 10.9 | 37.2 ± 9.3 | 0.465 |
| Total cholesterol (mg/dl) | 178.8 ± 45.1 | 179.6 ± 45.6 | 0.731 |
| Serum glucose (mg/dl) | 196.6 ± 89.6 | 152.7 ± 62.0 | <0.001 |
| Hemoglobin (g/L) | 14.1 ± 1.9 | 14.1 ± 2.0 | 0.933 |
| Platelet (/mm 3 ) | 244.6 ± 61.7 | 249 ± 69.1 | 0.508 |
| White blood cell count (10 3 /μl) | 12.5 ± 5.0 | 11.9 ± 3.9 | 0.168 |
| Neutrophils (%) | 73.7 ± 8.2 | 64.5 ± 9.6 | <0.001 |
| Lymphocytes (%) | 18.1 ± 5.6 | 24.4 ± 6.7 | <0.001 |
| Eosinophils (%) | 2.1 ± 1.1 | 2.2 ± 1.2 | 0.687 |
| Monocytes (%) | 8.3 ± 4.4 | 8.0 ± 3.5 | 0.497 |
| Neutrophil/lymphocyte ratio | 4.6 ± 1.7 | 3.1 ± 1.9 | <0.001 |
| Glycoprotein IIb/IIIa antagonist | 32 (20%) | 27 (10%) | 0.005 |
| Pain-to-balloon time (hours) | 4.8 ± 1.3 | 4.2 ± 1.4 | <0.001 |
| Hospitalization (days) | 7.2 ± 1.8 | 6.4 ± 2.0 | <0.001 |
| Previous medications | |||
| Angiotensin-converting enzyme inhibitors | 67 (42%) | 101 (39%) | 0.472 |
| β Blocker | 56 (35%) | 64 (25%) | 0.018 |
| Statin | 50 (32%) | 55 (21%) | 0.016 |
| Aspirin | 60 (38%) | 53 (20%) | <0.001 |
| Diuretics | 19 (12%) | 28 (11%) | 0.693 |
| Infarct-related coronary artery | |||
| Left anterior descending | 83 (53%) | 125 (48%) | 0.377 |
| Right | 46 (29%) | 77 (30%) | 0.913 |
| Circumflex | 29 (18%) | 58 (22%) | 0.334 |
| Thrombolysis In Myocardial Infarction thrombus grade scale | <0.001 | ||
| 0 | 5 (3%) | 26 (10%) | |
| 1 | 12 (8%) | 18 (7%) | |
| 2 | 18 (11%) | 31 (12%) | |
| 3 | 27 (17%) | 80 (31%) | |
| 4 | 36 (23%) | 55 (21%) | |
| 5 | 60 (38%) | 50 (19%) | |
| Number of coronary arteries narrowed | |||
| 1 | 61 (39%) | 189 (73%) | <0.001 |
| >1 | 97 (61%) | 71 (27%) | <0.001 |
| Primary percutaneous coronary intervention | 0.162 | ||
| Stent implantation | 145 (92%) | 251 (97%) | |
| Bare-metal stent | 127 (80%) | 227 (87%) | |
| Drug-eluting stent | 17 (11%) | 18 (7%) | |
| Stent length (mm) | 18.1 ± 3.4 | 17.6 ± 3.7 | 0.139 |
| Stent diameter (mm) | 3.24 ± 0.35 | 3.21 ± 0.33 | 0.380 |
| In-hospital major adverse cardiac events | 36 (23%) | 18 (7%) | <0.001 |
| In-stent thrombosis | 13 (8%) | 8 (3%) | 0.019 |
| Nonfatal myocardial infarction | 14 (9%) | 8 (3%) | 0.010 |
| In-hospital mortality | 21 (13%) | 9 (4%) | <0.001 |
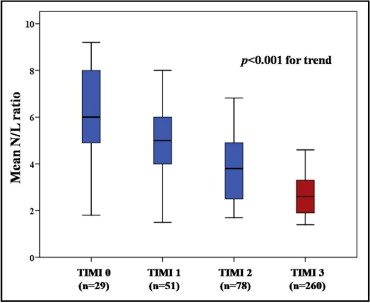
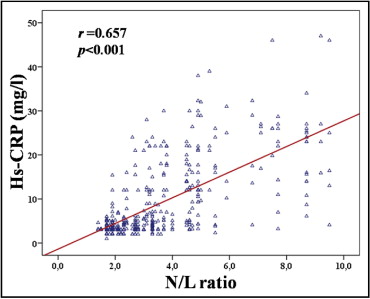
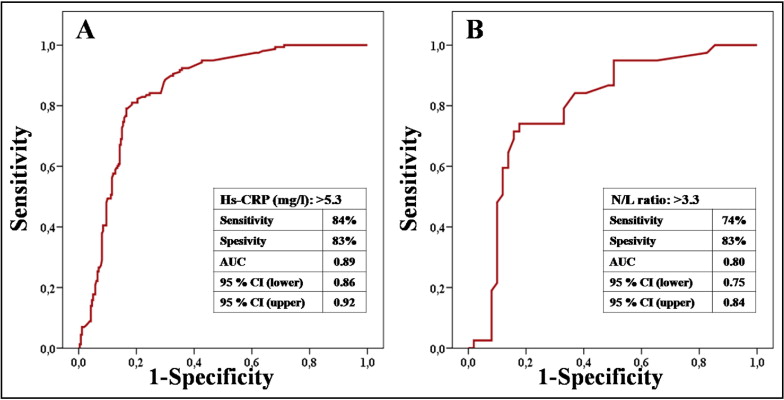
Percent neutrophils (73.7 ± 8.2% vs 64.5 ± 9.6%, p <0.001) and N/L ratio (4.6 ± 1.7% vs 3.1 ± 1.9%, p <0.001) were significantly higher in group 1. In contrast, percent lymphocytes (18.1 ± 5.6% vs 24.4 ± 6.7%, p <0.001) were significantly lower in group 1. A larger proportion of patients with multivessel disease (>50% occlusion for multiple coronary arteries) was in group 1 (p <0.001). The left anterior descending coronary artery was the most common infarct-related artery in the 2 groups. Patients in the no-reflow group were more likely to have a higher grade on the TIMI thrombus scale (p <0.001). Percent stent implantations and stent types were similar between groups (p = 0.162). Also, there was no significant difference in stent length (3.24 ± 0.35 vs 3.21 ± 0.33, p = 0.380) or stent diameter (18.1 ± 3.4 vs 17.6 ± 3.7, p = 0.139) between groups. Beta blockers, statins, and aspirin usage were significantly greater in group 1 (p = 0.018, p = 0.016 and p <0.001, respectively). However, there was no significant difference in angiotensin-converting enzyme inhibitor and diuretic drug usage between the 2 arms (p = 0.472 and p = 0.693, respectively). In-stent thrombosis, nonfatal myocardial infarction, and in-hospital mortality were significantly higher in group 1 (p <0.001, p = 0.019, and p <0.001, respectively). Overall, in-hospital MACEs also were significantly higher in group 1 (23% vs 7%, p <0.001). Mean N/L ratio was associated with TIMI flow grade ( Figure 1 ). N/L ratio and hs-CRP levels on admission were higher in group 1 compared to group 2 (p <0.001 for each). Also, there was a significant association between these 2 parameters (r = 0.657, p <0.001; Figure 2 ). Receiver operating characteristics curves of N/L ratio and hs-CRP for predicting no reflow are shown in Figure 3 . An hs-CRP level >5.3 mg/L measured at admission had 84% sensitivity and 83% specificity in its association with no reflow. N/L ratio >3.3 predicted no reflow with 74% sensitivity and 83% specificity. When the study population was divided into 2 groups according to the N/L ratio cut-off value of 3.3 identified in receiver operating characteristics curve analysis, multivessel disease and no reflow were significantly higher in the group with the higher N/L ratio (p = 0.002). In-hospital MACEs were significantly greater in the higher N/L ratio group (p = 0.008; Table 2 ). With respect to coronary risk factors, only diabetes mellitus and hypertension were significantly higher in the group with a higher N/L ratio (p <0.001 and p = 0.032, respectively). Age and gender were not significantly different between groups (p = 0.164 and p = 0.393, respectively).
| Variable | N/L Ratio | p Value | |
|---|---|---|---|
| ≤3.3 | >3.3 | ||
| (n = 255) | (n = 163) | ||
| Age (years) | 59.3 ± 12.3 | 61.0 ± 12.6 | 0.164 |
| Men | 203 (80%) | 124 (76%) | 0.393 |
| Coronary risk factors | |||
| Diabetes mellitus | 46 (18%) | 55 (34%) | <0.001 |
| Hypertension | 98 (38%) | 80 (49%) | 0.032 |
| Smoking | 135 (53%) | 100 (61%) | 0.091 |
| Previous coronary artery disease | 42 (17%) | 39 (24%) | 0.060 |
| Number of coronary arteries narrowed | 0.002 | ||
| 1 | 168 (66%) | 82 (50%) | |
| >1 | 87 (34%) | 81 (50%) | |
| In-hospital major adverse cardiac events | 24 (9%) | 30 (18%) | 0.008 |
| In stent thrombosis | 8 (3%) | 13 (8%) | 0.027 |
| Nonfatal myocardial infarction | 9 (4%) | 13 (8%) | 0.047 |
| In-hospital mortality | 12 (5%) | 18 (11%) | 0.014 |
| No reflow | 41 (16%) | 117 (72%) | <0.001 |
Some variables associated with impaired flow after primary PCI and in-hospital MACEs were significantly different between the 2 N/ratio L groups. Independent contributions of age, N/L ratio, hs-CRP, body mass index, β blocker, aspirin, male gender, diabetes mellitus, previous coronary artery disease, symptom-to-balloon time, glucose on admission, and multivessel disease were analyzed using multivariate logistic regression ( Table 3 ). On multivariate regression, N/L ratio (odds ratio [OR] 1.537 per unit increase, 95% confidence interval [CI] 1.343 to 1.759, p <0.001) and hs-CRP level (OR 1.209 per unit increase, 95% CI 1.153 to 1.267, p <0.001) remained independent predictors of no reflow after primary PCI ( Table 3 ). In multivariate analyses for in-hospital MACEs, N/L ratio, hs-CRP, aspirin, male gender, previous coronary artery disease, glucose on admission, left ventricular ejection fraction on admission, and use of glycoprotein IIb/IIIa antagonists were analyzed with the multivariate logistic regression model. High N/L ratio (OR 1.137 per unit increase, 95% CI 0.981 to 1.315, p = 0.043) and hs-CRP level (OR 1.024 per unit increase, 95% CI 0.992 to 1.057, p = 0.006) remained independent predictors of in-hospital MACEs ( Table 4 ).
| Variables | Unadjusted OR | 95% CI | p Value | Adjusted OR ⁎ | 95% CI | p Value |
|---|---|---|---|---|---|---|
| Age | 1.023 | 1.006–1.039 | 0.008 | 1.019 | 0.995–1.043 | 0.118 |
| Neutrophil/lymphocyte ratio | 1.513 | 1.344–1.705 | <0.001 | 1.537 | 1.343–1.759 | <0.001 |
| High-sensitivity C-reactive protein | 1.021 | 1.013–1.029 | <0.001 | 1.019 | 1.011–1.026 | <0.001 |
| Body mass index | 1.069 | 0.990–1.155 | 0.088 | 1.125 | 1.012–1.250 | 0.029 |
| Aspirin | 2.391 | 1.539–3.716 | <0.001 | 0.138 | 0.043–0.443 | 0.001 |
| β Blocker | 1.681 | 1.093–2.588 | 0.018 | 0.117 | 0.036–0.382 | <0.001 |
| Male gender | 0.641 | 0.401–1.027 | 0.064 | 0.667 | 0.343–1.296 | 0.232 |
| Hypertension | 1.321 | 0.887–1.969 | 0.171 | |||
| Diabetes mellitus | 3.093 | 1.950–4.907 | <0.001 | 4.360 | 2.101–9.047 | <0.001 |
| Smoke | 1.140 | 0.765–1.701 | 0.519 | |||
| Previous coronary artery disease | 3.420 | 2.068–5.656 | <0.001 | 6.123 | 2.116–9.897 | <0.001 |
| Pain-to-balloon time | 1.414 | 1.214–1.647 | <0.001 | 1.498 | 1.218–1.843 | <0.001 |
| Stent length | 1.043 | 0.986–1.104 | 0.141 | |||
| Stent diameter | 0.379 | 0.714–2.423 | 0.379 | |||
| Glucose on admission | 1.006 | 1.003–1.008 | <0.001 | 1.002 | 0.999–1.005 | 0.144 |
| Left ventricular ejection fraction on admission | 1.182 | 1.051–1.394 | 0.108 | |||
| Glomerular filtration rate | 0.961 | 0.841–1.102 | 0.569 | |||
| Multivessel disease | 4.233 | 2.779–6.447 | <0.001 | 1.936 | 2.260–6.856 | <0.001 |
Stay updated, free articles. Join our Telegram channel

Full access? Get Clinical Tree


