In patients with corrected tetralogy of Fallot (cToF), left ventricular (LV) dysfunction is closely related to right ventricular (RV) dysfunction, indicating adverse ventricular–ventricular interactions. However, the mechanism that links RV dysfunction to LV dysfunction remains unclear. In this prospective study, 32 patients with cToF and 19 controls were enrolled. With cardiac magnetic resonance imaging, biventricular ejection fractions were assessed. Using 2-dimensional speckle tracking, global and regional RV and LV strains and LV twist were assessed. To detect and characterize ventricular–ventricular interaction, the relation between global and regional RV mechanics and global and regional LV mechanics was assessed. Global RV strain, global LV strain, and LV twist were decreased in patients with cToF. Global RV strain correlated with global LV strain (r = 0.66, p <0.001) and LV twist (r = −0.72, p <0.001), indicating the presence of adverse ventricular–ventricular interaction. Furthermore, close relations were observed between apical RV strain and apical LV strain (r = 0.62, p <0.001) and apical LV rotation (r = −0.67, p <0.001). In conclusion, RV strain was significantly related to LV strain and LV twist in patients with cToF and controls. Furthermore, apical RV strain correlated with apical LV strain and apical LV rotation, indicating adverse apical ventricular–ventricular interactions.
Current surgical techniques have improved the clinical outcome of patients with tetralogy of Fallot. However, after the third postoperative decade, risk of death increases dramatically. Recent studies have demonstrated that decreased left ventricular ejection fraction (LVEF), right ventricular ejection fraction (RVEF), and older age at correction of tetralogy of Fallot (cToF) are strong independent determinants of poor clinical outcome in patients with cToF. In addition, several studies have demonstrated a close relation between RVEF and LVEF in patients with cToF, indicating the potential pathophysiologic role of ventricular–ventricular interactions that lead to clinical deterioration late after cToF. However, these ventricular–ventricular interactions have not been completely elucidated and, more importantly, the mechanism that links RV dysfunction to impairment of LV function remains unclear. Two-dimensional speckle tracking echocardiography has enabled assessment of multidirectional myocardial mechanics, providing information on complex RV and LV motion patterns. This imaging technique has proved useful to detect subclinical cardiac dysfunction in several clinical conditions. In the present study, 2-dimensional speckle tracking echocardiography and cardiac magnetic resonance (CMR) were used to comprehensively characterize global and regional RV and LV performance in patients with cToF and in healthy subjects. In addition, global and regional RV mechanics were related to global and regional LV mechanics to detect and characterize ventricular–ventricular interaction.
Methods
Thirty-two consecutive patients with cToF undergoing clinical CMR evaluation from July 2008 to July 2009 (age range 8 to 18 years) were prospectively recruited from an ongoing registry (Center for Congenital Heart Disease Amsterdam–Leiden). Exclusion criteria were previous pulmonary valve replacement and any contraindications for CMR, such as claustrophobia, cardiac devices, or arrhythmia. In addition, 19 healthy subjects, matched by age and body surface area, without structural heart disease underwent echocardiography and CMR evaluation within the same time frame. Subjects with history of cardiomyopathy, valvular heart disease, or arrhythmic disorders were excluded. CMR and transthoracic echocardiography were performed to study LV and RV performance and to assess ventricular–ventricular interactions. RVEF, RV end-diastolic and end-systolic volumes, LVEF, and LV end-diastolic and end-systolic volumes were assessed with CMR. RV and LV longitudinal strains and LV twist were evaluated with 2-dimensional speckle tracking. Ventricular–ventricular interaction was studied by assessing the relations between RV and LV strains and LV rotation. The study protocol was approved by the institutional review board of Leiden University Medical Center and all subjects gave written, informed consent.
CMR was performed on a 1.5-T pulsar gradient system (Intera 11; Philips Medical Systems, Best, The Netherlands) with 33-mT/m amplitude, 100-mT/m/ms slew rate, and 0.33-ms increase time. A 5-element cardiac coil was used for signal reception. After acquiring a series of localizing thoracic scout images, multisection transversal cine imaging was performed. A stack of slices was planned in the transversal plane, covering the 2 ventricles throughout the cardiac cycle. Images were acquired with a steady-state free precession sequence during breath-hold at end-expiration with repetition time 3.9 ms, echo time 1.5 ms, flip angle 50°, slice thickness 8 mm, matrix 160 × 256, field of view 350 mm, and temporal resolution 25 ms.
Images were analyzed using MASS (Medis, Leiden, The Netherlands). LV and RV volumes were calculated by manually tracing the endocardial borders at end-systole and end-diastole in all slices and multiplying the area by slice thickness. Subsequently, LVEF and RVEF were automatically calculated by MASS. LV and RV volumes were indexed for body surface area.
All subjects were imaged in the left lateral decubitus position with a commercially available system (Vingmed Vivid 7, General Electric Medical Systems, Milwaukee, Wisconsin) equipped with a 3.5-MHz transducer. Standard 2-dimensional images and Doppler and color Doppler data were acquired from the parasternal and apical views and digitally stored in cine-loop format. Analyses were performed off-line using EchoPac 108.1.5 (General Electric Medical Systems). For speckle tracking analysis, standard 2-dimensional gray-scale images with a frame rate ≥40 frames/s were used. Three cardiac cycles were obtained and stored in cine-loop format for off-line analysis. All echocardiographic measurements were averaged from 3 cardiac cycles. Presence of pulmonary regurgitation was systematically evaluated with continuous-wave Doppler echocardiography, by measuring duration of pulmonary regurgitation, and color Doppler echocardiography, by measuring width of regurgitant jet, as previously described by Li et al.
Global longitudinal RV strain was assessed with 2-dimensional speckle tracking analysis in the apical 4-chamber view, measuring the longitudinal peak systolic strain of the RV free wall, as described previously ( Figure 1 ). The weighted average of the 3 regional values of the RV free wall (basal, mid, and apical segments) provided the value of global longitudinal RV strain. Regional longitudinal peak systolic strain of the right ventricle was assessed at the basal, mid, and apical components of the RV free wall. Intra- and interobserver reproducibilities for RV strain measurement have been previously reported showing small bias and no significant trend (−0.2 ± 3.6% and 0.6 ± 3.8%, respectively).
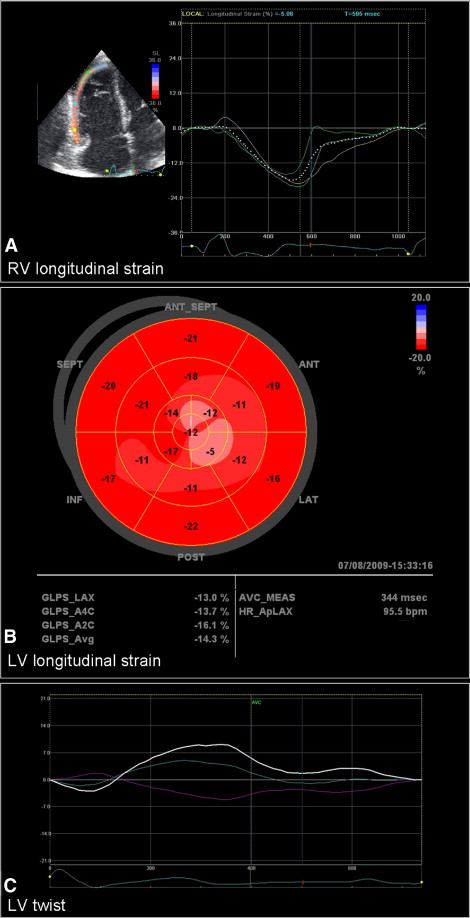
Global longitudinal LV strain was measured in apical long-axis and 2- and 4-chamber views using automated function imaging, a novel 2-dimensional speckle tracking algorithm. End-systolic frame is defined in the apical long-axis view. Closure of the aortic valve is marked and the software measures the interval between the R wave and aortic valve closure. This interval is used as a reference for apical 2- and 4-chamber views. After defining the mitral annulus and LV apex with 3 index points at the end-systolic frame in each apical view, the automated algorithm places the region of interest including the entire myocardial wall. The tracking algorithm follows the endocardium from this single frame throughout the cardiac cycle and allows for manual adjustment of the region of interest. The left ventricle is divided into 6 segments in each view and the tracking quality is manually validated for each segment. The algorithm displays regional and global longitudinal LV peak strains in a 17-segment model “bull’s-eye” plot, with average values of peak longitudinal strain for each view and averaged global peak longitudinal strain for the entire left ventricle ( Figure 1 ). Regional longitudinal LV strain was evaluated at basal, mid, and apical levels by calculating average strain values of basal, mid, and apical segments in apical long-axis and 2- and 4-chamber views. Intra- and interobserver reproducibilities for automated function imaging measurements have been previously reported with small bias and no significant trend (−0.3 ± 0.6% and −0.2 ± 2.6%, respectively).
LV rotation was measured at apical and basal levels in the parasternal short-axis view using 2-dimensional speckle tracking. The basal plane was identified by the presence of the mitral valve. The apical plane was defined as the smallest cavity during systole below the papillary muscles. Off-line, the endocardial border was traced at an end-systolic frame and the region of interest was placed to fit the entire myocardium. Subsequently, LV rotation of apical and basal planes was automatically calculated. Counterclockwise rotation provided a positive value, whereas clockwise rotation provided a negative value, as viewed from the apex. LV twist was defined as the maximal net difference in rotation between the LV apex and base at isochronal time points ( Figure 1 ).
Continuous variables are expressed as mean ± SD. Comparisons between patients and controls were analyzed using Mann-Whitney U test. Categorical variables are presented as numbers and percentages and were compared with Fisher’s exact test. Differences in RV apical strain between controls and subgroups of patients with cToF with mild, moderate, and severe pulmonary regurgitation were assessed with Kruskal-Wallis test. Furthermore, linear regression analysis was used to assess the relation between LVEF and RVEF and between global RV strain and global LV strain and LV twist. In addition, regional ventricular–ventricular interaction was studied by evaluating the relation between RV strain and LV strain and rotation at basal and apical levels with linear regression. To analyze whether surgical technique could determine RV and LV strains or LV rotational mechanics, univariate regression analysis was performed. A p value <0.05 was considered statistically significant.
Results
Characteristics of patients with cToF and healthy subjects are listed in Table 1 . All patients were in New York Heart Association functional class I. Baseline characteristics were not significantly different between patients with cToF and healthy controls with the exception of QRS duration (134 ± 19 ms in patients vs 94 ± 8 ms in controls, p <0.001). RV end-diastolic volume and RV end-systolic volume were larger in patients with cToF and RVEF was significantly decreased. LV dimensions and LVEF did not differ in patients with cToF compared to controls.
| Variable | Patients (n = 32) | Controls (n = 19) | p Value |
|---|---|---|---|
| Age (years) | 13.2 ± 2.9 | 14.1 ± 2.4 | 0.228 |
| Male/female | 19/13 | 12/7 | 0.693 |
| Age at surgery (years) | 0.9 ± 0.6 | N/A | |
| Type of surgery | |||
| Infundibulectomy | 5 (15%) | N/A | |
| Right ventricular outflow tract patch | 4 (13%) | N/A | |
| Transannular patch | 20 (63%) | N/A | |
| Pulmonary artery patch | 3 (9%) | N/A | |
| QRS duration (ms) | 134 ± 19 | 94 ± 8 | <0.001 |
| Body surface area (m 2 ) | 1.4 ± 0.3 | 1.6 ± 0.3 | 0.113 |
| Body mass index (kg/m 2 ) | 18.5 ± 4 | 19.4 ± 3 | 0.368 |
| Pulmonary regurgitation | |||
| Mild | 8 (25%) | 0 | |
| Moderate | 13 (41%) | 0 | |
| Severe | 11 (34%) | 0 | |
| Cardiac magnetic resonance parameters | |||
| Right ventricular end-systolic volume (ml/m 2 ) | 131 ± 30 | 98 ± 13 | <0.001 |
| Right ventricular end-systolic volume (ml/m 2 ) | 110 ± 66 | 59 ± 46 | <0.001 |
| Right ventricular ejection fraction (%) | 50 ± 5 | 53 ± 4 | 0.016 |
| Left ventricular end-diastolic volume (ml/m 2 ) | 88 ± 20 | 95 ± 10 | 0.196 |
| Left ventricular end-diastolic volume (ml/m 2 ) | 40 ± 13 | 42 ± 7 | 0.266 |
| Left ventricular ejection fraction (%) | 56 ± 5 | 56 ± 3 | 0.724 |
Assessment of RV function with 2-dimensional speckle tracking demonstrated significantly decreased global longitudinal RV strain in patients with cToF (−20.5 ± 4.2% vs −30.7 ± 3.3%, p <0.001) compared to controls ( Table 2 ). When assessing regional longitudinal RV strain, patients with cToF had significantly decreased strain in all segments of the RV free wall (basal, mid, and apical; Table 2 ). In addition, RV apical longitudinal strain was significantly different in controls and in patients with cToF with mild, moderate, and severe pulmonary regurgitation (−32.6 ± 4.7%, −20.2 ± 9.6%, −23.6 ± 6%, and −18.0 ± 5.3%, respectively; p <0.001).
| 2-Dimensional Speckle Tracking Parameters | Patients (n = 32) | Controls (n = 19) | p Value |
|---|---|---|---|
| Global right ventricular longitudinal peak systolic strain (%) | −20.5 ± 4.2 | −30.7 ± 3.3 | <0.001 |
| Regional right ventricular longitudinal peak systolic strain (%) | |||
| Basal | −21.9 ± 6.2 | −28.0 ± 5.5 | 0.001 |
| Mid | −23.8 ± 3.7 | −30.4 ± 4.2 | <0.001 |
| Apical | −20.7 ± 6.9 | −32.6 ± 4.7 | <0.001 |
| Global left ventricular longitudinal peak systolic strain (%) | −17.2 ± 1.3 | −20.4 ± 1.3 | <0.001 |
| Regional left ventricular longitudinal peak systolic strain (%) | |||
| Basal | −18.6 ± 2.5 | −19.2 ± 2.4 | 0.519 |
| Mid | −18.1 ± 2.1 | −19.7 ± 2.7 | 0.014 |
| Apical | −15.9 ± 2.8 | −22.1 ± 3.4 | <0.001 |
| Left ventricular twist (°) | 8.8 ± 3.3 | 14.8 ± 3.2 | <0.001 |
| Apical rotation (°) | 5.6 ± 2.4 | 10.0 ± 2.0 | <0.001 |
| Basal rotation (°) | −4.1 ± 2.0 | −5.3 ± 2.3 | 0.073 |
Stay updated, free articles. Join our Telegram channel

Full access? Get Clinical Tree


