Heart failure is a risk factor for Alzheimer’s disease and cerebrovascular disease. In the absence of heart failure, it was hypothesized that left ventricular ejection fraction (LVEF), an indicator of cardiac dysfunction, would be associated with preclinical brain magnetic resonance imaging (MRI) and neuropsychological markers of ischemia and Alzheimer disease in the community. Brain MRI, cardiac MRI, neuropsychological, and laboratory data were collected from 1,114 Framingham Heart Study Offspring Cohort participants free from clinical stroke or dementia (aged 40 to 89 years, mean age 67 ± 9 years, 54% women). Neuropsychological and neuroimaging markers of brain aging were related to cardiac MRI–assessed LVEF. In multivariable-adjusted linear regressions, LVEF was not associated with any brain aging variable (p values >0.15). However, LVEF quintile analyses yielded several U-shaped associations. Compared to the referent (quintile 2 to 4), the lowest quintile (quintile 1) LVEF was associated with lower mean cognitive performance, including Visual Reproduction Delayed Recall (β = −0.27, p <0.001) and Hooper Visual Organization Test (β = −0.27, p <0.001). Compared to the referent, the highest quintile (quintile 5) LVEF values also were associated with lower mean cognitive performance, including Logical Memory Delayed Recall (β = −0.18, p = 0.03), Visual Reproduction Delayed Recall (β = −0.17, p = 0.03), Trail Making Test Part B − Part A (β = −0.22, p = 0.02), and Hooper Visual Organization Test (β = −0.20, p = 0.02). Findings were similar when analyses were repeated excluding prevalent cardiovascular disease. In conclusion, although these observational cross-sectional data cannot establish causality, they suggest a nonlinear association between LVEF and measures of accelerated cognitive aging.
In patients with severe cardiomyopathies, left ventricular ejection fraction (LVEF) is related to abnormal brain aging, including cognitive impairment, structural neuroanatomic abnormalities, and increased risk for Alzheimer’s disease (AD). Cognitive impairment diminishes and cerebral blood flow increases by >50% after heart transplantation, purportedly because of improvement in cardiac function. Therefore, a reduced LVEF may influence cerebral perfusion homeostasis and contribute to clinical brain injury. In the absence of end-stage heart disease, less is known about how LVEF affects or accelerates abnormal brain aging. The aim of this cross-sectional investigation was to better understand relations between LVEF and abnormal brain aging by extending previous work to a large, epidemiologic cohort, assessing LVEF using sensitive cardiac magnetic resonance imaging (MRI), and simultaneously considering shared vascular risks for brain and myocardial injury. On the basis of previous work, we hypothesized that a lower LVEF would be associated with cognitive and neuroimaging markers of preclinical AD (learning and memory, brain volume, temporal horn volume, and hippocampal volume) and cerebrovascular changes (executive functioning and white matter hyperintensities [WMH]) in a community-based cohort of adults free of clinical dementia or stroke.
Methods
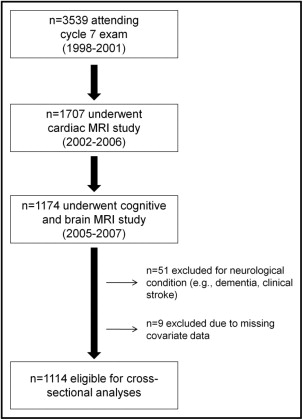
The Framingham Offspring Study design and selection criteria have been described elsewhere. From 1971 to 1975, 5,124 participants were recruited and have been examined every 4 to 8 years since. Details on the derivation of the current sample are provided in Figure 1 . The protocol was approved by the local institutional review board. Participants provided written informed consent before assessments.
Participants completed the following cognitive protocol, which was selected a priori to represent different cognitive systems: (1) delayed memory: Logical Memory Delayed Recall and Visual Reproduction Delayed Recall; (2) language: Boston Naming Test–30 Item; (3) executive functioning: a difference score of Trail Making Test Part B − Part A; (4) verbal reasoning: Similarities; and (5) visuoperceptual abilities: Hooper Visual Organization Test.
For brain imaging acquisition, images were obtained using a Siemens 1-T magnetic resonance machine (Siemens Medical Systems, Erlangen, Germany) using a T2-weighted double spin-echo coronal imaging sequence. Digital information was postprocessed by a central laboratory blinded to demographic and clinical information. A custom-written, semiautomatic segmentation protocol was used to quantify total cranial, total brain, frontal lobar, temporal horn, and hippocampal volumes and WMH segmentation. Interrater reliabilities for these methods have been published elsewhere. For this study, intra- and interrater reliabilities were consistently >0.90. Hippocampal data were available for a subset of participants (n = 423). For cardiac MRI acquisition, images were obtained with participants in the supine position using a Philips 1.5-T MR system (Philips Medical Systems, Andover, Massachusetts) with a 5-element (3 anterior, 2 posterior) surface coil. Images were acquired at end-tidal breath hold and analyzed by a single, experienced, blinded reviewer using a commercial workstation (EasyVision 4.0; Philips Medical Systems). End-systolic phase was determined as the minimal cross-sectional area of a midventricular slice. The time delay from the QRS complex (phase) was analyzed for each contiguous slice, and endocardial borders were segmented. End-diastolic volume and end-systolic volume were computed by summation of disks (i.e., modified Simpson’s rule) to derive the LVEF ([end-diastolic volume − end-systolic volume]/end-diastolic volume). Intra- and interobserver coefficients of variation for these methods have been published elsewhere. For this study, interrater reliabilities were consistently >0.92.
Total brain, frontal lobe, temporal horn, and hippocampal volumes and WMH were expressed as percentages of total cranial volume. WMH, Trail Making Test Part B − Part A, and Hooper Visual Organization Test were natural log–transformed to normalize distributions. As previously described, neuropsychological scores were adjusted for age and education, separately by sex, to enable comparison across measures. Resulting values were standardized, separately by gender, to a mean of 0 and a standard deviation of 1 (i.e., values were transformed to represent standard deviation units from the mean).
We used regression to assess linear relations between the LVEF and each brain aging variable. Next, we compared brain aging variables among participants classified by LVEF quintile and noted U-shaped associations. We therefore compared the lower (quintile 1) and upper (quintile 5) quintiles to the referent (quintiles 2 to 4) for each brain aging variable. On the basis of previous work, we adjusted for covariates defined at the seventh examination cycle, including age, sex, systolic blood pressure, smoking status, diabetes mellitus (i.e., history of fasting blood glucose ≥126 mg/dl or use of oral hypoglycemic or insulin), hypertension treatment, atrial fibrillation, and prevalent cardiovascular disease (CVD), including coronary heart disease, heart failure, and intermittent claudication. Secondary analyses were performed (1) excluding prevalent CVD (n = 77); (2) using the categorical LVEF variable (i.e., quintile 1, quintile 5, and referent quintiles 2 to 4) assessing effect modification by sex, age (<60 vs ≥60 years), and APOE-ε4 status (ε4− vs ε4+) and stratifying analyses by subgroups as indicated. Significance was set at p <0.05 for all models. Data were analyzed using SAS version 9.1 (SAS Institute Inc., Cary, North Carolina).
Results
Clinical characteristics are listed in Table 1 . Cardiac MRI, brain MRI, and neuropsychological descriptive variables are listed in Table 2 . As a continuous variable, the LVEF was unrelated to any brain MRI or neuropsychological variable ( Table 3 ). Findings were not altered when participants with CVD were excluded ( Table 4 ).
| Variable | Value |
|---|---|
| Age at brain MRI (years) | 67 ± 9 |
| Women | 602 (54%) |
| Systolic blood pressure (mm Hg) | 124 ± 17 |
| Cigarette smokers | 102 (9%) |
| Diabetes mellitus | 93 (8%) |
| Atrial fibrillation | 20 (2%) |
| Hypertension treatment | 293 (26%) |
| Prevalent CVD | 77 (7%) |
| Time to brain MRI (years) | 6.9 ± 0.9 |
| Time from cardiac MRI to brain MRI (years) | 2.5 ± 1.1 |
| LVEF (%) | 67.3 ± 6.7 |
| Quintile 1 | 225 (<62.0%) |
| Quintile 2 | 217 (62.0%–65.9%) |
| Quintile 3 | 226 (65.9%–68.8%) |
| Quintile 4 | 226 (68.8%–73.2%) |
| Quintile 5 | 220 (≥73.2%) |
| Variable | Total Sample (n = 1,114) | Quintile 1 (n=225) | Quintiles 2 to 4 (n = 669) | Quintile 5 (n = 220) |
|---|---|---|---|---|
| Brain MRI data (% of total cranial volume) | ||||
| WMH ⁎ | −2.38 ± 1.13 | −2.42 ± 1.17 | −2.45 ± 1.10 | −2.15 ± 1.15 |
| Total brain volume † | 79.02 ± 3.81 | 79.35 ± 3.66 | 79.14 ± 3.82 | 78.32 ± 3.87 |
| Frontal lobar volume † | 36.07 ± 3.37 | 36.23 ± 3.40 | 36.25 ± 3.30 | 35.35 ± 3.49 |
| Temporal horn volume ⁎ , † | −3.08 ± 0.88 | −3.10 ± 0.84 | −3.10 ± 0.92 | −3.00 ± 0.80 |
| Hippocampal volume † | 0.37 ± 0.06 (n = 423) | 0.37 ± 0.06 (n = 88) | 0.37 ± 0.06 (n = 245) | 0.37 ± 0.06 (n = 90) |
| Total sample (n = 1,114) | Quintile 1 (n = 222) | Quintiles 2 to 4 (n = 665) | Quintile 5 (n = 217) | |
|---|---|---|---|---|
| Neuropsychological data | ||||
| Logical Memory Delayed Recall, total | 12 (0, 22) | 12 (0, 22) | 12 (0, 22) | 11 (0, 19) |
| Visual Reproduction Delayed Recall, total | 9 (0, 14) | 8 (0, 14) | 9 (0, 14) | 8 (1, 14) |
| Boston Naming Test–30 Item, total | 28 (12, 30) | 28 (15, 30) | 28 (16, 30) | 28 (12, 30) |
| Trail Making Test Part B − Part A, minutes | 0.77 (0.08, 9.62) | 0.77 (0.15, 9.30) | 0.74 (0.08, 9.62) | 0.84 (0.10, 9.55) |
| Hooper Visual Organization Test, total | 25.5 (11.5, 30.0) | 25.25 (14.5, 30.0) | 26 (12.5, 30.0) | 25 (11.5, 30.0) |
| Similarities, total | 18 (2, 26) | 17 (6, 25) | 18 (2, 26) | 17 (5, 25) |
| Variable | LVEF (n = 1,114) | LVEF Quintiles (n = 1,114) | |||||
|---|---|---|---|---|---|---|---|
| Quintile 1 (Bottom/Low) | Quintiles 2–4 (Middle) | Quintile 5 (Top/High) | |||||
| β ± SE | p Value | β ± SE | p Value | β ± SE | p Value | ||
| Brain MRI data | |||||||
| WMH | 0.000 ± 0.03 | 0.999 | 0.13 ± 0.08 | 0.079 | Referent | 0.04 ± 0.08 | 0.584 |
| Total brain volume | 0.003 ± 0.02 | 0.903 | 0.13 ± 0.23 | 0.564 | Referent | 0.13 ± 0.23 | 0.593 |
| Frontal lobar volume | −0.03 ± 0.03 | 0.186 | 0.13 ± 0.21 | 0.551 | Referent | −0.21 ± 0.21 | 0.319 |
| Temporal horn volume | 0.02 ± 0.02 | 0.349 | −0.04 ± 0.06 | 0.542 | Referent | −0.03 ± 0.06 | 0.577 |
| Hippocampal volume (n = 423) | 0.06 ± 0.05 | 0.208 | −0.002 ± 0.01 | 0.808 | Referent | 0.01 ± 0.01 | 0.430 |
| Neuropsychological data | |||||||
| Logical Memory Delayed Recall | −0.01 ± 0.03 | 0.821 | −0.12 ± 0.08 | 0.159 | Referent | −0.18 ± 0.08 | 0.031 ⁎ |
| Visual Reproduction Delayed Recall | 0.05 ± 0.03 | 0.131 | −0.27 ± 0.08 | <0.001 ⁎ | Referent | −0.17 ± 0.08 | 0.029 ⁎ |
| Boston Naming Test–30 Item | −0.01 ± 0.03 | 0.780 | −0.05 ± 0.08 | 0.521 | Referent | −0.05 ± 0.08 | 0.519 |
| Trail Making Test Part B − Part A | −0.01 ± 0.04 | 0.750 | −0.13 ± 0.09 | 0.174 | Referent | −0.22 ± 0.09 | 0.022 ⁎ |
| Similarities | 0.000 ± 0.03 | 0.997 | −0.12 ± 0.08 | 0.114 | Referent | −0.11 ± 0.08 | 0.178 |
| Hooper Visual Organization Test | −0.006 ± 0.03 | 0.856 | −0.27 ± 0.08 | <0.001 ⁎ | Referent | −0.20 ± 0.08 | 0.015 ⁎ |
| Variable | LVEF (n = 1,037) | LVEF Quintiles (n = 1,037) | |||||
|---|---|---|---|---|---|---|---|
| Quintile 1 (Lowest) | Quintiles 2–4 (Middle) | Quintile 5 (Highest) | |||||
| β ± SE | p Value | β ± SE | p Value | β ± SE | p Value | ||
| Brain MRI data | |||||||
| WMH | 0.01 ± 0.03 | 0.768 | 0.10 ± 0.08 | 0.193 | Referent | 0.02 ± 0.08 | 0.805 |
| Total brain volume | 0.01 ± 0.03 | 0.808 | 0.13 ± 0.24 | 0.594 | Referent | 0.20 ± 0.24 | 0.410 |
| Frontal lobar volume | −0.04 ± 0.03 | 0.164 | 0.14 ± 0.22 | 0.514 | Referent | −0.22 ± 0.22 | 0.333 |
| Temporal horn volume | 0.01 ± 0.03 | 0.690 | −0.01 ± 0.06 | 0.930 | Referent | −0.03 ± 0.06 | 0.574 |
| Hippocampal volume (n = 391) | 0.07 ± 0.05 | 0.151 | −0.002 ± 0.01 | 0.841 | Referent | 0.01 ± 0.01 | 0.425 |
| Neuropsychological data | |||||||
| Logical Memory Delayed Recall | −0.02 ± 0.03 | 0.495 | −0.11 ± 0.09 | 0.213 | Referent | −0.20 ± 0.09 | 0.020 ⁎ |
| Visual Reproduction Delayed Recall | 0.05 ± 0.03 | 0.129 | −0.24 ± 0.08 | 0.003 ⁎ | Referent | −0.14 ± 0.08 | 0.073 |
| Boston Naming Test–30 Item | −0.03 ± 0.03 | 0.377 | −0.003 ± 0.08 | 0.973 | Referent | −0.06 ± 0.09 | 0.465 |
| Trail Making Test Part B − Part A | −0.01 ± 0.04 | 0.806 | −0.12 ± 0.10 | 0.202 | Referent | −0.24 ± 0.10 | 0.017 ⁎ |
| Similarities | 0.03 ± 0.03 | 0.425 | −0.15 ± 0.08 | 0.069 | Referent | −0.10 ± 0.08 | 0.203 |
| Hooper Visual Organization Test | 0.01 ± 0.03 | 0.886 | −0.27 ± 0.08 | 0.001 ⁎ | Referent | −0.15 ± 0.08 | 0.078 |
Stay updated, free articles. Join our Telegram channel

Full access? Get Clinical Tree


