The impact of left ventricular (LV) dyssynchrony on clinical outcomes in patients with tetralogy of Fallot (TOF) is unknown. The aim of this study was to test the hypothesis that LV dyssynchrony assessed by cardiac magnetic resonance (CMR)–derived tissue tracking in patients with repaired TOF is associated with ventricular tachycardia (VT) and death. Included patients had repaired TOF and CMR data from 2000 and 2008. Patients (n = 13) had histories of death or sustained VT. Control subjects (n = 26), with no death or VT, were matched by age at CMR and type of last surgical procedure. Demographic, clinical, and electrocardiographic data were recorded. CMR short-axis cine data were analyzed by tracking the motion of the endocardial border using commercial software. LV dyssynchrony was quantified as the maximum difference in time to peak radial displacement, circumferential strain, and radial strain among the 6 ventricular segments and the standard deviation of the times to peak value. There were no differences between groups in clinical, electrocardiographic, or demographic characteristics. Among CMR parameters, right ventricular volumes were higher and ejection fractions lower in the patient group. Indexes of LV dyssynchrony were higher in the patient group (e.g., maximum time difference of circumferential strain 94 vs 46 ms, p <0.001; standard deviation of circumferential strain 37.8 vs 20.3 ms, p <0.01). In a multivariate model including LV synchrony variables, the best outcome discriminator was maximum time difference to peak circumferential strain (p <0.01). In conclusion, tissue tracking applied to CMR images identifies indexes of LV synchrony associated with death and VT in patients with repaired TOF.
Poor clinical outcomes in tetralogy of Fallot (TOF) have been shown to be related to electrophysiologic abnormalities and changes in ventricular size and function. In this study, we sought to assess left ventricular (LV) synchrony among patients with repaired TOF using a novel technique, tissue tracking of cardiac magnetic resonance (CMR) images. Published research on tissue-tracking CMR using nontagging techniques is scant ; to our knowledge, this is the first report relating these measurements to clinical outcomes. To this end, we compared differences in synchrony indexes between patients who had sustained ventricular tachycardia (VT) or death and a matched control group that did not experience these outcomes. In addition, we evaluated the relation between indexes of dyssynchrony and global LV systolic function.
Methods
This study was designed as a single-center, retrospective case-control analysis. Inclusion criteria included (1) diagnosis of TOF, (2) CMR with adequate quality short-axis cine images occurring from 2000 to 2008, and (3) ≥10 years between TOF repair and CMR evaluation. Patients (n = 13) experienced sustained VT or death after CMR. For each patient in the case group, 2 control subjects who did not experience these outcomes and fulfilled the same inclusion criteria were matched by age at CMR (±5 years) and type of TOF repair (categorized as right ventricular outflow tract patch, right ventricle–to–pulmonary artery conduit, pulmonary valve replacement, or unspecified or unknown). The study was approved by the Scientific Review Committee of the Department of Cardiology and by the Children’s Hospital Boston Committee on Clinical Investigation.
For patients, the CMR studies used for analysis were the last available before the occurrence of death or VT. For control subjects, the CMR study nearest in time to the matched case was used. The following data were extracted from the patients’ medical records: gender, age at TOF repair, type of last surgical procedure, age at CMR, and New York Heart Association class at the time of CMR. QRS duration on electrocardiography at the time of CMR, measured from the first to the last sharp vector crossing the isoelectric line, was recorded. The presence of right bundle branch block and left anterior hemiblock were noted as well.
The details of the CMR protocol used in our laboratory for the assessment of patients with repaired TOF have been published. Briefly, studies were performed with a commercially available 1.5-T whole-body scanner (GE Medical Systems, Milwaukee, Wisconsin; Philips Medical Systems, Best, The Netherlands), using an appropriate coil for patient size. Ventricular dimensions and function were assessed using an electrocardiographically gated steady-state free-precession cine magnetic resonance pulse sequence during brief periods of breath-holding in the following planes: ventricular 2-chamber (vertical long-axis), 4-chamber (horizontal long-axis), and short-axis planes (perpendicular to the ventricular long-axis plane on the basis of the previous 4-chamber images), with 12 to 14 equidistant slices completely covering both ventricles. Flow measurements were performed in the proximal main pulmonary artery using a retrospectively gated velocity-encoded cine magnetic resonance imaging pulse sequence during free breathing. CMR image analysis was performed using commercially available computer workstation (Extended MR WorkSpace version 2.6; Philips Medical Systems) and software (Mass and Flow; MEDIS Medical Imaging Systems, Leiden, The Netherlands). LV and right ventricular end-diastolic (maximal) and end-systolic (minimal) volumes, mass at end-diastole, stroke volumes, and ejection fractions were measured as previously described. The presence of infundibular aneurysm was noted.
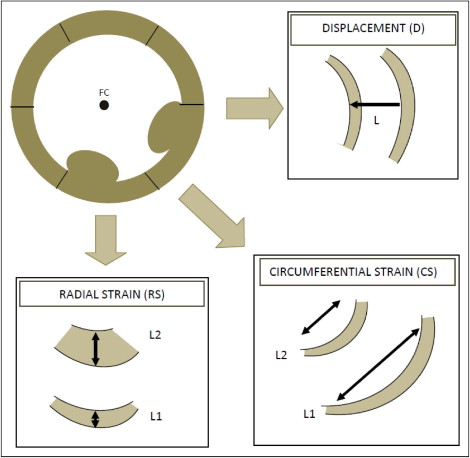
Indexes of LV dyssynchrony were measured from CMR studies using Velocity Vector Imaging version 3.03 (Siemens Medical Systems, Malvern, Pennsylvania), a tissue-tracking software package. Custom-built filters were used to modify the Digital Imaging and Communications in Medicine headers of the CMR data sets to allow them to be analyzed by this package. Tissue tracking was applied to CMR short-axis frames at the midpapillary muscle level, divided into 6 segments of equal size. A series of 8 to 10 points were manually placed on the endocardial and epicardial surfaces. A splined contour was defined by these points and subdivided into 48 points (8 per segment). The motion of the 48 points along the contour was tracked automatically by the software package. Circumferential strain, radial strain, and radial displacement (relative to a floating centroid) were calculated for each of the 48 points ( Figure 1 ). Endocardial contours were used for the calculation of circumferential strain and radial displacement. Values at the 8 points within each segment were averaged to produce 1 value per segment. The frame rate of the cine CMR sequences varied from 20 to 40 frames/s (20 to 30 frames/cardiac cycle).
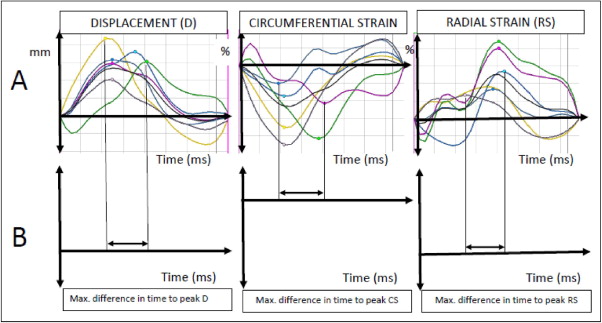
For each of the 6 segments in the short-axis slice, the values of the peak radial and circumferential strain and radial displacement, and times to peak values, were measured ( Figure 2 ). The maximum difference in time to peak displacement and radial and circumferential strain, and the standard deviation of the times to peak values, served as the primary dyssynchrony variables ( Figure 2 ). Each of the measurements was repeated 4 times and the mean value used for analysis.
The nonparametric Mann-Whitney test was used to assess differences between groups of continuous variables; Fisher’s exact test was used for categorical variables. Logistic regression analysis was used to examine relations between CMR data and dyssynchrony indexes and clinical outcomes. A multivariate model was constructed using variables associated with the clinical outcomes and identified by Spearman’s correlation analysis to be most independent. Linear regression analysis was used to examine the relation between LV dyssynchrony indexes and LV function. Continuous data are expressed as median (range) and categorical data as frequency distributions. SPSS version 16 (SPSS, Inc., Chicago, Illinois) was used for statistical analysis. Absolute values of the magnitude of the strain are reported.
Results
Table 1 lists demographic, electrocardiographic, and CMR data. The last surgical procedure before CMR consisted of right ventricular outflow tract patch in 15 patients (38%), right ventricle–to–pulmonary artery conduit in 9 (23%), pulmonary valve replacement in 6 (15%), and unknown in 9 (23%). Of the 13 patients, 6 (46%) died and 7 (54%) had sustained VT. There were no significant differences between groups in demographic or electrocardiographic parameters, although the presence of left anterior hemiblock tended to be more prevalent in patients (p = 0.09). Among CMR variables, patients had higher RV end-diastolic and end-systolic volume indexes, higher LV end-systolic volume indexes, and lower left and right ventricular ejection fractions than control subjects. No differences were seen in the pulmonary regurgitation fraction or the presence of infundibular aneurysm.
| All Patients | Death/VT | Controls | ||
|---|---|---|---|---|
| Variable | (n = 39) | (n = 13) | (n = 26) | p Value |
| Male/female | 24/15 | 9/4 | 15/11 | 0.72 |
| Median age at CMR (years) | 35 (16–72) | 35 (17–72) | 33 (16–64) | 0.67 |
| Median age at TOF repair (years) | 7 (0.3–51) | 9 (0.5–40) | 6 (0.3–51) | 0.83 |
| New York Heart Association class III or IV | 8% | 15% | 4% | 0.25 |
| Electrocardiographic characteristics | ||||
| QRS duration (ms) | 160 (90–210) | 160 (140–210) | 160 (90–210) | 0.36 |
| Right bundle branch block | 64% | 61% | 65% | 1 |
| Left anterior hemiblock | 20% | 38% | 11% | 0.09 |
| CMR variables | ||||
| RV end-diastolic volume index (ml/m 2 ) | 136 (75–348) | 187 (92–348) | 125 (76–272) | 0.01 |
| RV end-systolic volume index (ml/m 2 ) | 73 (22–238) | 119 (60–238) | 57 (22–147) | <0.01 |
| RV ejection fraction (%) | 48 (21–76) | 39 (21–53) | 51 (26–76) | <0.01 |
| Pulmonary regurgitation fraction (%) | 33 (0–62) | 32 (1–62) | 33 (0–61) | 0.38 |
| LV end-diastolic volume index (ml/m 2 ) | 89 (46–168) | 92 (46–159) | 88 (59–169) | 0.37 |
| LV end-systolic volume index (ml/m 2 ) | 39 (19–94) | 41 (27–94) | 35 (19–93) | 0.03 |
| LV ejection fraction (%) | 57 (32–71) | 49 (32–71) | 60 (42–69) | 0.01 |
| Presence of infundibular aneurysm | 13% | 8% | 15% | 0.64 |
The average peak circumferential strain in patients and control subjects was 12% (range 1.3% to 26%) and 19% (range 9% to 32%) (p <0.01). The average peak radial strain was 18% (range 5.7% to 49%) and 31% (range 7% to 59%) (p <0.01). Table 2 lists LV dyssynchrony indexes between the 2 groups.
| Variable | All Patients (n = 39) | Death/VT (n = 13) | Controls (n = 26) | p Value |
|---|---|---|---|---|
| Maximum segmental difference to peak value (ms) | ||||
| Radial displacement | 35 (0–648) | 51 (0–648) | 30 (0–197) | 0.03 |
| Circumferential strain | 59 (0–315) | 94 (46–315) | 46 (0–170) | <0.01 |
| Radial strain | 77 (0–342) | 127 (23–342) | 75 (0–260) | 0.1 |
| SD of time to peak value (ms) | ||||
| SD of radial displacement | 16 (0–286) | 26 (0–286) | 12 (0–73.1) | 0.02 |
| SD of circumferential strain | 25 (0–116) | 38 (16–116) | 20 (0–73.4) | <0.01 |
| SD of radial strain | 30 (0–122) | 48 (10–122) | 28 (0–116) | 0.1 |
A multivariate model was constructed, including the variables from Tables 1 and 2 found to be most closely associated with death or VT and independent from each other. These variables included right ventricular and LV end-systolic volume index and the maximum difference in time to peak circumferential strain. Right ventricular end-systolic volume index emerged as the best independent predictor of death or VT (p = 0.02; Table 3 ). When the analysis was repeated using only dyssynchrony variables, including those that had been associated with death or VT in the univariate analysis, the maximum difference in time to peak circumferential strain was the strongest predictor of poor outcomes (β = 1, p <0.01, receiver operating characteristic curve confidence interval 0.67 to 0.94).


