Few studies have compared the ability of sodium bicarbonate plus N-acetylcysteine (NAC) and sodium chloride plus NAC to prevent contrast-induced nephropathy (CIN) in diabetic patients with impaired renal function undergoing coronary or endovascular angiography or intervention. Diabetic patients (n = 382) with renal disease (serum creatinine ≥1.1 mg/dl and estimated glomerular filtration rate <60 ml/min/1.73 m 2 ) were randomly assigned to receive prophylactic sodium chloride (saline group, n = 189) or sodium bicarbonate (bicarbonate group, n = 193) before elective coronary or endovascular angiography or intervention. All patients received oral NAC 1,200 mg 2 times/day for 2 days. The primary end point was CIN, defined as an increase in serum creatinine >25% or an absolute increase in serum creatinine ≥0.5 mg/dl within 48 hours after contrast exposure. There were no significant between-group differences in baseline characteristics. The primary end point was met in 10 patients (5.3%) in the saline group and 17 (9.0%) in the bicarbonate group (p = 0.17), with 2 (1.1%) and 4 (2.1%), respectively, requiring hemodialysis (p = 0.69). Rates of death, myocardial infarction, and stroke did not differ significantly at 1 month and 6 months after contrast exposure. In conclusion, hydration with sodium bicarbonate is not superior to hydration with sodium chloride in preventing CIN in patients with diabetic nephropathy undergoing coronary or endovascular angiography or intervention.
Several strategies can interrupt the pathophysiology of contrast-induced nephropathy (CIN), including periprocedural hydration, antioxidants such as N-acetylcysteine (NAC) and ascorbic acid, administration of low- or iso-osmolar contrast medium, and hemofiltration or dialysis. Results of these trials have been inconclusive or heterogeneous, although periprocedural volume expansion with hydration has shown some benefit in most trials. Less is known, however, about the effectiveness of hydration in patients with diabetes mellitus. Recent studies have suggested that hydration with sodium bicarbonate may have a greater protective effect in preventing CIN than hydration with sodium chloride. We therefore compared their ability to prevent CIN in diabetic patients with chronic kidney disease who were undergoing coronary and/or endovascular intervention or angiography.
Methods
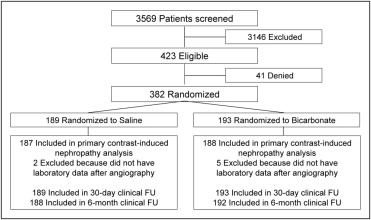
From February 2008 through August 2009, 3,569 patients were screened at 9 major academic institutions in Korea to determine if they met the study inclusion criteria ( Figure 1 ) including serum creatinine ≥1.1 mg/dl, estimated glomerular filtration rate (eGFR) <60 ml/min/1.73 m 2 , age ≥18 years, and diagnosis with diabetes mellitus. Estimated GFR was calculated from serum creatinine concentrations using the Modification of Diet in Renal Disease study equation.
Exclusion criteria included an inability to obtain informed consent, serum creatinine ≥8 mg/dl, eGFR <15 ml/min/1.73 m 2 at rest, end-stage renal disease on hemodialysis, multiple myeloma, pulmonary edema, or uncontrolled hypertension (systolic pressure >160 mm Hg or diastolic pressure >100 mm Hg), acute ST-segment elevation myocardial infarction while undergoing primary percutaneous intervention, emergency coronary angioplasty or angiography, use of contrast media within the previous 2 days, pregnancy, and allergy to contrast medium or medications such as theophylline, dopamine, mannitol, fenoldopam, and NAC.
Eligible patients scheduled for elective coronary or endovascular angiography or intervention were randomly assigned 1:1 to prophylactic administration of sodium chloride (saline group) or sodium bicarbonate (bicarbonate group) using an interactive Web response system. All patients received NAC 1,200 mg 2 times/day for 2 days starting the day before the index procedure. The allocation sequence was computer-generated, stratified according to participating center, and blocked with block sizes of 6 and 10. Patients but not investigators were unaware of treatment assignment. Diabetes mellitus was defined as use of oral hypoglycemic agents or insulin, fasting plasma glucose >126 mg/dl, or random plasma glucose ≥200 mg/dl.
Infusion of sodium bicarbonate (154 mEq/L in dextrose and water) was begun 1 hour before the start of contrast injection, starting at 3 ml/kg/hour and decreasing to 1 ml/kg/hour during the procedure and for 6 hours after completion of the procedure. Patients allocated to the saline group received 0.9% sodium chloride 1 ml/kg/hour for 12 hours before and after the procedure. Infusion rates were decreased to 0.5 ml/kg/hour in patients with left ventricular ejection fraction <45% in the 2 treatment arms.
All patients received intraarterial iodixanol (Visipaque, GE Healthcare, Ltd., Amersham, United Kingdom), a nonionic dimeric iso-osmolar contrast medium. Serum creatinine concentrations were assessed at baseline and on days 1 and 2 after the procedure. Additional assessments were performed until any increase was resolved or further deterioration of renal function was halted. Patients with CIN were also assessed 1 month after the procedure.
The study protocol was approved by the institutional review board of each participating center and all patients provided written informed consent.
The primary end point of the study was development of CIN, defined as a >25% increase in serum creatinine concentration or a ≥0.5 mg/dl absolute increase in serum creatinine from baseline within 48 hours after contrast exposure. Secondary end points were all-cause mortality, myocardial infarction, stroke, and dialysis including hemofiltration at 1 month and at 1 month to 6 months after contrast exposure.
The primary end points were also analyzed in prespecified subgroups of patients including patients with severe renal impairment at baseline, defined as creatinine clearance <30 ml/min, and those with high-contrast load (HCL) during the procedure, defined as contrast medium ≥140 ml and >5 times body weight (kilograms) per serum creatinine (milligrams per deciliter). Myocardial infarction was defined according to universal guidelines but excluding patients with periprocedural myonecrosis. Stroke was defined as an ischemic or hemorrhagic stroke or transient ischemic attack.
Clinical follow-up visits were scheduled at 1 month and 6 months. Clinical, angiographic, procedural, and outcome data were collected using a dedicated, electronic case-report form by specialized personnel at the clinical data management center who were unaware of treatment assignments. All outcomes of interest were confirmed by source documentation collected at each hospital and were centrally adjudicated by an independent clinical events committee, the members of which were blinded to assigned treatment groups. An independent data and safety monitoring board reviewed the data periodically to identify potential safety issues, but there were no formal stopping rules.
The study sample size was calculated by assuming that 10% of the saline group and 2% of the bicarbonate group would develop CIN. Using a 2-sided chi-square test with a significance level of 0.05, 368 randomized patients would give the study 90% power.
Continuous variables were compared using Student’s t test or Wilcoxon rank-sum test, and categorical variables were compared using chi-square test or Fisher’s exact test as appropriate. Multivariate logistic regression analysis was performed using variables with p values ≤0.10 in univariate analyses to identify baseline independent predictors of CIN. The final models were determined by backward elimination.
All p values were 2-sided, and p values <0.05 were considered statistically significant. SAS 9.1 (SAS Institute, Cary, North Carolina) was used for statistical analysis. The authors had full access to the data and take full responsibility for its integrity. All authors have read and agree to the report as written.
Results
During the study period, 423 patients were eligible for inclusion, with 382 randomly assigned to the saline (n = 189) and bicarbonate (n = 193) groups ( Figure 1 ). Of these patients, 7 (2 in the saline and 5 in the bicarbonate group) did not complete the study because their serum creatinine concentration was not measured within 48 hours after contrast exposure. The 2 groups were well balanced in baseline clinical, biochemical, and procedural characteristics ( Table 1 ). The median age of all cohorts was 68 years, 56% of all patients were women, and most had been diagnosed with noninsulin-dependent diabetes, with 65% of patients being treated with oral hypoglycemic agents. Median baseline eGFR in the 2 groups was 46 ml/min/1.73 m 2 .
| Variable | Sodium Chloride Group (n = 189) | Sodium Bicarbonate Group (n = 193) | p Value |
|---|---|---|---|
| Age (years) | 67.5 (62–72) | 68.5 (63–73) | 0.30 |
| Women | 54 (28.6%) | 57 (29.5%) | 0.84 |
| Diabetes mellitus | 0.53 | ||
| Insulin dependent | 9 (4.8%) | 12 (6.2%) | |
| Noninsulin dependent | 180 (95.2%) | 181 (93.8%) | |
| Diabetes, treatment techniques | 0.56 | ||
| Oral hypoglycemic agent | 121 (64.0%) | 129 (66.8%) | |
| Insulin requiring | 68 (36.0%) | 64 (33.2%) | |
| Hemoglobin A 1c (%) | 7.2 (6.6–8.1) | 7.4 (6.4–8.8) | 0.68 |
| Hypertension ⁎ | 151 (79.9%) | 149 (77.2%) | 0.49 |
| Hyperlipidemia † | 63 (33.3%) | 72 (37.3%) | 0.42 |
| Current smoker | 29 (15.3%) | 36 (18.7%) | 0.56 |
| Peripheral vascular disease | 18 (9.5%) | 20 (10.4%) | 0.78 |
| Height (cm) | 162 ± 7.8 | 162 ± 7.8 | 0.56 |
| Weight (kg) | 67 ± 9.7 | 66 ± 9.1 | 0.16 |
| Body mass index (kg/m 2 ) | 25.4 ± 3.3 | 25.1 ± 3.0 | 0.31 |
| Blood pressure (mm Hg) | |||
| Systolic | 131 ± 17 | 132 ± 18 | 0.67 |
| Diastolic | 75 ± 12 | 75 ± 11 | 0.72 |
| Heart rate (beats/min) | 74 ± 13 | 76 ± 12 | 0.07 |
| Baseline creatinine (mg/dl) | 1.5 (1.3–1.7) | 1.5 (1.3–1.9) | 0.49 |
| Baseline estimated glomerular filtration rate (ml/min/1.73 m 2 ) | 46 (37–53) | 46 (34–53) | 0.58 |
| Left ventricular ejection fraction (%) | 60 (50–65) | 58 (48–64) | 0.84 |
| Clinical presentation | 0.22 | ||
| Silent myocardial ischemia | 33 (17.5%) | 35 (18.1%) | |
| Stable angina pectoris | 73 (38.5%) | 98 (50.8%) | |
| Unstable angina pectoris | 72 (38.1%) | 51 (26.4%) | |
| Acute myocardial infarction | 11 (5.8%) | 9 (4.7%) | |
| Contrast volume (ml) | 120 (79–223) | 113 (80–220) | 0.89 |
| High-contrast load ‡ | 50 (26.5%) | 54 (28.0%) | 0.74 |
| Performed procedures | 0.63 | ||
| Coronary angiogram only | 96 (50.8%) | 97 (50.3%) | |
| Percutaneous coronary intervention | 89 (47.1%) | 86 (44.6%) | |
| Peripheral angioplasty § | 3 (1.6%) | 7 (3.6%) | |
| Percutaneous coronary intervention and peripheral angioplasty | 1 (0.5%) | 3 (1.6%) | |
| Medications | |||
| Angiotensin-converting enzyme inhibitors | 43 (22.8%) | 32 (16.6%) | 0.25 |
| Angiotensin receptor blockers | 86 (45.5%) | 84 (43.5%) | 0.70 |
| Calcium channel blockers | 114 (60.3%) | 120 (62.2%) | 0.71 |
| β Blockers | 103 (54.5%) | 103 (53.4%) | 0.92 |
| Diuretics | 69 (36.5%) | 60 (31.1%) | 0.26 |
| Statins | 125 (66.1%) | 138 (71.5%) | 0.63 |
⁎ As documented by (1) history of hypertension diagnosed and treated with medication, diet, and/or exercise; (2) blood pressure >140 mm Hg systolic or >90 mm Hg diastolic on ≥2 occasions; or (3) currently on antihypertensive pharmacologic therapy.
† Includes documentation of (1) total cholesterol >200 mg/dl, (2) low-density lipoprotein ≥130 mg/dl, or (3) currently on lipid-lowering pharmacologic therapy.
‡ Defined as contrast media ≥140 ml and >5 times body weight (kilograms) per serum creatinine (milligrams per deciliter).
Table 2 lists mean creatinine concentrations and eGFR before and after contrast exposure in the 2 groups. In the 2 groups, serum creatinine concentration and eGFR significantly increased after administration of contrast medium (p = 0.02 and p = 0.001, respectively, in the saline group; and p = 0.022 and p = 0.014, respectively, in the bicarbonate group). These values, however, did not differ significantly between the 2 treatment groups ( Table 2 ).
| Measurement | Before Exposure | After Exposure | p Value ⁎ † |
|---|---|---|---|
| Sodium chloride group | |||
| Serum creatinine (mg/dl) | 1.59 ± 0.47 | 1.61 ± 0.76 | 0.02 |
| Estimated glomerular filtration rate (ml/min/1.73 m 2 ) | 47.6 ± 16.16 | 44.3 ± 10.11 | 0.001 |
| Sodium bicarbonate group | |||
| Serum creatinine (mg/dl) | 1.67 ± 0.52 | 1.72 ± 0.77 | 0.022 |
| Estimated glomerular filtration rate (ml/min/1.73 m 2 ) | 45.9 ± 17.48 | 43.21 ± 11.73 | 0.014 |
⁎ Within-group comparisons were assessed using Wilcoxon signed-rank test.
† Between-group comparisons were assessed using Mann–Whitney U test (not shown in this table, p >0.18 for all comparisons).
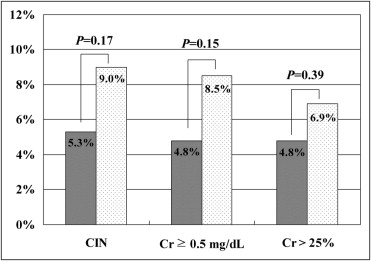
Rates of CIN, the primary end point of the study, were 5.3% (10/187) in the saline group and 9% (17/188) in the bicarbonate group (p = 0.17; Figure 2 ). Detailed analyses showed no significant differences between the saline and bicarbonate groups in percentages of patients showing a ≥0.5 mg/dl absolute increase in serum creatinine concentration (4.8%, 9 of 187, vs 8.5%, 16 of 188, p = 0.15) and those showing a >25% relative increase in serum creatinine (4.8%, 9 of 187, vs 6.9%, 13 of 188, p = 0.39). We evaluated continuous deterioration of renal function, defined as a ≥25% decrease in serum creatinine or permanent hemodialysis, at 1 month in patients who developed CIN, finding persistent renal impairment in 50% (5 of 10) and 41.2% (7 of 17) of patients in the saline and bicarbonate groups, respectively (p = 0.71).
Overall 11.0% of patients had severe renal impairment with basal eGFR <30 ml/min/1.73 m 2 . Of these, 33.3% (5 of 15) and 37.0% (10 of 27) of patients in the saline and bicarbonate groups, respectively, developed CIN (p = 0.81).
Figure 3 shows that incidence of CIN was significantly higher in patients with HCL than those with non-HCL among the total, saline, and bicarbonate groups. However, there were no significant differences of the development of CIN in the saline and bicarbonate groups according to contrast volume.


