Diabetic autonomic neuropathy is a possible link between abnormal metabolism in type 2 diabetes mellitus (T2DM) and risk for atrial fibrillation (AF) and heart failure (HF). The aim of this study was to elucidate the association between attenuated heart rate recovery (HRR) and these manifestations of myocardial dysfunction in T2DM. Nine hundred fourteen consecutive patients with T2DM (mean age 56 ± 11 years, 508 men) without diabetes mellitus complications, with negative results on stress echocardiography, were enrolled. Patients with known cardiac disease were excluded. Demographics, clinical assessment, co-morbidities, and insulin use were collected prospectively. The association of HRR with new-onset HF and AF was sought using a Cox proportional-hazards model. There were 47 events (22 HF and 25 AF) during a median follow-up period of 7.8 years. Events were associated with age, exercise capacity, HRR, and left atrial volume index but not with baseline glycosylated hemoglobin, left ventricular mass index, or standard markers of diastolic function. In sequential Cox models for the combined outcomes, the model based on clinical data (age and gender; overall chi-square = 5.5) was not significantly improved by left atrial volume index (chi-square = 8.6, p = 0.10) or maximum METs (chi-square = 8.7, p = 0.07) but was significantly improved by adding HRR (chi-square = 19.7, p = 0.004). In addition, HRR provided significant incremental prognostic value regarding the composite end point (net reclassification improvement 19.2%, p = 0.04; integrated discrimination improvement 1.58%, p = 0.004). In conclusion, the association of HRR with subsequent HF and AF, independent of and incremental to left atrial volume index and other markers of abnormal cardiac structure and function, indicates a role for autonomic neuropathy as the link between metabolic and cardiac risk in patients with T2DM.
Subclinical left ventricular (LV) dysfunction appears to precede overt heart failure (HF). Diabetic myocardial damage appears to affect diastolic function before systolic function, and diastolic abnormalities of active relaxation and passive stiffness are linked with HF 3 as well as atrial fibrillation (AF). Left atrial volume index (LAVI) is a relatively simple marker of HF risk. The link between metabolic disturbance and HF presentations is complex and may be mediated by a variety of factors. We hypothesized that autonomic neuropathy is 1 of the links between metabolic and cardiac risk in patients with type 2 diabetes mellitus (T2DM). Heart rate recovery (HRR) is 1 of the clinical markers of cardiovascular autonomic dysfunction and predicts mortality and cardiovascular events in patients with T2DM. Thus, we sought to elucidate the independent association of HRR with new-onset HF and AF in patients with T2DM.
Methods
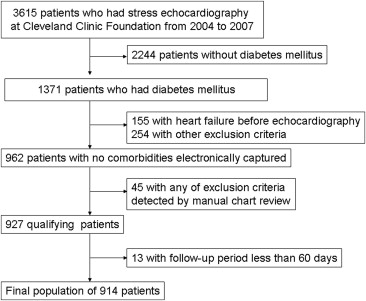
We evaluated the eligibility of consecutive adult patients with T2DM who underwent exercise echocardiography from 2004 to 2007 at our institution. Patients with previous cardiac surgery, myocardial infarction, AF, HF, more than mild valvular heart disease, ejection fractions <50%, or any history of cancer were excluded, as were patients with test results indicating active coronary artery disease, which was defined as the existence of ischemia on stress echocardiography. In addition, patients with follow-up <60 days were excluded (although none developed outcomes). Finally, 914 patients were enrolled in this observational study ( Figure 1 ). Permission for data linkage was approved by the institutional review board.
Demographic data were collected prospectively at the time of exercise echocardiography. A structured interview and chart review were conducted before each exercise test regarding symptoms, medications, risk factors, cardiac history, and noncardiac diagnoses. Hypertension at rest was defined as systolic blood pressure ≥140 mm Hg, diastolic blood pressure ≥90 mm Hg, or treatment with antihypertensive medication. Obesity was determined as a body mass index >30 kg/m 2 . History of coronary artery disease was defined as treatment with percutaneous coronary intervention and absence of ischemia on stress echocardiography. Diagnosis of T2DM was determined on the basis of chart review with the use of International Classification of Disease, Ninth Revision, diagnostic codes (see Supplementary Data ). All clinical data, as well as directly measured height and weight, were recorded prospectively in the database.
Symptom-limited exercise testing procedures in our laboratory have been described. Each patient underwent testing according to standard protocols. Trained exercise physiologists and/or cardiology fellows prospectively collected physiologic and hemodynamic data during testing, including symptoms, heart rate, heart rhythm, blood pressure, and estimated functional capacity in METs. HRR was defined as the difference in heart rate from peak stress to 1 minute after stress, and abnormal HRR was defined as ≤18 beats/min.
Standard commercially available echocardiographic systems were used to perform M-mode and 2-dimensional rest echocardiography. Sector size and depth were adjusted to achieve optimal visualization of all LV myocardium at the highest possible frame rate. Acquisition was obtained at end-expiration. Multiple consecutive cardiac cycles were acquired and stored digitally for subsequent analysis. Left atrial volume was measured using the biplane area-length method, and LV volumes and ejection fractions were calculated using the biplane method of disks. LV mass index was calculated using Devereux’s formula indexed to body surface area. Because mitral annular velocity measurements were not collected routinely in the era of this study, we defined diastolic stage using deceleration time and LAVI. Using this approach, stage 1 (delayed relaxation) was identified when the deceleration time was >240 ms, stage 2 (pseudonormal filling) by LAVI >34 ml/m 2 with a deceleration time of 160 to 240 ms, and stage 3 (restricted filling) if the deceleration time was <160 ms with LAVI >34 ml/m 2 .
New-onset HF or AF >60 days after enrollment was the primary end point. We excluded 13 patients diagnosed as having HF in this interval, because of concern that the diagnosis of HF was triggered by the results of echocardiography in those who may have had symptoms but not definitive diagnoses. Follow-up was obtained by review of patients’ electronic health records. We identified those who subsequently developed HF or AF using International Classification of Diseases, Ninth Revision, diagnostic codes (see Supplementary Data ). Patients were censored at the time of HF or death, and for the rest at new onset of AF or at the end of follow-up. No patient was lost during follow-up. There were no cardiac deaths and 11 noncardiac deaths (1.2%) before censoring.
Continuous data are expressed as mean ± SD and categorical data as percentages. Cox univariate analyses were used for comparisons of baseline characteristics. Student’s t tests, paired t tests, and Mann-Whitney U tests were used to compare continuous variables when appropriate. Cox proportional-hazards analysis was used to determine significant associations of new-onset HF or AF. In addition to HRR, other covariates, including age, gender, exercise capacity, and LAVI (as a marker of diastolic dysfunction), were selected for inclusion into the model on the basis of clinical relevance. The incremental value of HRR >18 beats/min in the first minute after exercise, over clinical data (age and gender), was examined by calculating the model chi-square values, net reclassification improvement, and integrated discrimination improvement. The robustness of HRR was then examined using 4 different models: clinical (age, gender, hypertension, and smoking), diabetes (age, gender, and glycosylated hemoglobin), echocardiography (age, gender, LV mass index, and LAVI), and exercise (age, gender, maximum METs, and pressure-rate product). Statistical analyses were performed using SPSS version 20 (SPSS, Inc., Chicago, Illinois), and p values <0.05 were considered statistically significant.
Results
The clinical characteristics and demographics of patients with and without HRR are listed in Table 1 . There were 47 events (22 HF and 25 AF) during a median follow-up period of 7.8 years. Although the patients with events were older than those without (62 ± 11 vs 56 ± 11 years, p = 0.0002), other clinical characteristics were similar between the groups. Among this population, 28% were obese, and 18% required insulin but renal function was preserved.
| Variable | Entire Cohort (n = 914) | HRR | p Value (Normal vs Abnormal) | |
|---|---|---|---|---|
| Normal (n = 782) | Abnormal (n = 132) | |||
| Age (yrs) | 56.4 ± 11.4 | 55.2 ± 11.2 | 66.4 ± 9.9 | <0.0001 |
| Men | 508 (55.6%) | 434 (55.5%) | 74 (56.1%) | 0.90 |
| Body surface area (m 2 ) | 2.02 ± 0.25 | 2.02 ± 0.26 | 2.04 ± 0.28 | 0.53 |
| Body mass index (kg/m 2 ) | 32.0 ± 6.8 | 31.8 ± 6.6 | 33.3 ± 7.4 | 0.047 |
| Hypertension ∗ | 561 (61.4%) | 461 (59.0%) | 100 (75.8%) | 0.0002 |
| Smoking | 422 (46.2%) | 349 (44.6%) | 73 (55.3%) | 0.024 |
| History of coronary artery disease | 49 (5.4%) | 43 (5.5%) | 6 (4.6%) | 0.65 |
| Body mass index >30 kg/m 2 | 522 (57.1%) | 439 (56.1%) | 83 (62.9%) | 0.15 |
| β blockers | 148 (16.2%) | 124 (15.9%) | 24 (18.2%) | 0.51 |
| Calcium channel antagonist | 132 (14.4%) | 104 (13.3%) | 28 (21.2%) | 0.017 |
| Glycosylated hemoglobin (%) | 7.4 ± 1.7 | 7.4 ± 1.8 | 7.3 ± 1.5 | 0.71 |
| Plasma glucose (mg/dl) | 143.6 ± 63.2 | 144.0 ± 64.2 | 141.2 ± 56.7 | 0.97 |
| Creatinine (mg/dl) | 0.89 ± 0.39 | 0.87 ± 0.23 | 0.99 ± 0.84 | 0.24 |
| Insulin use | 229 (25.1%) | 199 (25.5%) | 30 (23.3%) | 0.60 |
| LV diastolic dimension (cm) | 4.3 ± 0.6 | 4.3 ± 0.6 | 4.2 ± 0.6 | 0.017 |
| LV systolic dimension (cm) | 2.6 ± 0.6 | 2.6 ± 0.5 | 2.5 ± 0.6 | 0.043 |
| Intraventricular septal thickness (cm) | 1.2 ± 0.4 | 1.2 ± 0.4 | 1.3 ± 0.2 | 0.001 |
| Posterior wall thickness (cm) | 1.1 ± 0.2 | 1.1 ± 0.2 | 1.1 ± 0.2 | 0.025 |
| LV mass index (g/m 2 ) | 88.2 ± 45.9 | 88.1 ± 48.6 | 89.0 ± 25.0 | 0.23 |
| End-diastolic volume index (ml/m 2 ) | 42.4 ± 10.7 | 42.9 ± 10.7 | 39.4 ± 10.5 | 0.0002 |
| End-systolic volume index (ml/m 2 ) | 15.8 ± 5.5 | 16.0 ± 5.4 | 14.6 ± 6.0 | 0.0014 |
| Ejection fraction (%) | 62.8 ± 8.0 | 62.7 ± 7.8 | 63.4 ± 9.0 | 0.15 |
| LAVI (ml/m 2 ) | 22.4 ± 7.2 | 22.4 ± 7.0 | 22.8 ± 8.4 | 0.94 |
| Transmitral early diastolic wave (E wave) (cm/s) | 74.6 ± 17.8 | 74.8 ± 17.6 | 73.3 ± 19.4 | 0.23 |
| Transmitral late diastolic wave (A wave) (cm/s) | 78.4 ± 20.1 | 76.4 ± 19.2 | 90.3 ± 21.1 | <0.0001 |
| Transmitral early-to-diastolic wave ratio (E/A ratio) | 1.02 ± 0.50 | 1.05 ± 0.52 | 0.84 ± 0.32 | <0.0001 |
| Deceleration time (cm/s) | 236 ± 63 | 235 ± 61 | 242 ± 71 | 0.33 |
| Diastolic stage | ||||
| 0 (normal) | 472 (51.6%) | 413 (52.8%) | 59 (44.7%) | |
| 1 (abnormal relaxation) | 397 (43.4%) | 333 (42.6%) | 64 (48.5%) | 0.21 |
| 2 (pseudonormal) | 40 (4.4%) | 32 (4.1%) | 8 (6.1%) | |
| 3 (restrictive) | 5 (0.6%) | 4 (0.5%) | 1 (0.8%) | |
| Exercise capacity (METs) | 8.4 ± 2.2 | 8.6 ± 2.2 | 6.9 ± 1.9 | 0.03 |
∗ Systolic blood pressure ≥140 mm Hg, diastolic blood pressure ≥90 mm Hg, or antihypertensive treatment.
The ejection fraction and LV mass index were in the normal ranges (63 ± 8% and 88 ± 46 g/m 2 , respectively) and similar between the groups (p = 0.430 and p = 0.144, respectively) ( Table 2 ). However, in univariate analysis, diastolic parameters, such as LAVI and the E and A waves, were significantly higher in the group with events (p = 0.011, p = 0.016, and p <0.0001, respectively).
| Variable | Events (n = 47) | No Events (n = 867) | HR (95% CI) ∗ | p Value |
|---|---|---|---|---|
| Age (yrs) | 62.4 ± 11.2 | 56.1 ± 11.3 | 1.05 (1.02–1.08) | <0.001 |
| Men | 27 (57.5%) | 481 (55.5%) | 1.05 (0.59–1.89) | 0.88 |
| Body surface area (m 2 ) | 2.02 ± 0.29 | 2.02 ± 0.26 | 1.01 (0.33–3.08) | 0.99 |
| Body mass index (kg/m 2 ) | 32.3 ± 7.1 | 32.0 ± 6.7 | 1.01 (0.97–1.05) | 0.67 |
| Hypertension | 33 (70.2%) | 528 (60.9%) | 1.45 (0.78–2.71) | 0.24 |
| Smoking | 28 (59.6%) | 394 (45.4%) | 0.58 (0.32–1.03) | 0.06 |
| History of coronary artery disease | 4 (8.5%) | 45 (5.2%) | 1.93 (0.69–5.37) | 0.21 |
| Obesity | 25 (53.2%) | 497 (57.3%) | 0.85 (0.48–1.50) | 0.57 |
| β blockers | 11 (23.4%) | 137 (15.8%) | 1.61 (0.82–3.2) | 0.17 |
| Calcium channel antagonists | 9 (19.1%) | 123 (14.2%) | 0.71 (0.34–1.5) | 0.35 |
| Glycosylated hemoglobin (%) | 7.7 ± 1.5 | 7.4 ± 1.7 | 1.08 (0.91–1.29) | 0.37 |
| Plasma glucose (mg/dl) | 152.1 ± 61.8 | 142.5 ± 62.9 | 1.00 (0.998–1.01) | 0.35 |
| Creatinine (mg/dl) | 0.92 ± 0.27 | 0.87 ± 0.25 | 1.82 (0.72–4.62) | 0.21 |
| Insulin use | 10 (22.7%) | 219 (25.3%) | 1.11 (0.55–2.24) | 0.78 |
| LV diastolic dimension (cm) | 4.3 ± 0.59 | 4.3 ± 0.56 | 1.36 (0.82–2.26) | 0.23 |
| LV systolic dimension (cm) | 2.7 ± 0.56 | 2.6 ± 0.55 | 1.41 (0.84–2.35) | 0.19 |
| Intraventricular septal thickness (cm) | 1.2 ± 0.3 | 1.2 ± 0.4 | 1.11 (0.68–1.80) | 0.68 |
| Posterior wall thickness (cm) | 1.1 ± 0.2 | 1.1 ± 0.2 | 1.92 (0.48–7.64) | 0.35 |
| LV mass index (g/m 2 ) | 93.4 ± 25.1 | 88.0 ± 46.8 | 1.00 (0.998–1.00) | 0.54 |
| End-diastolic volume index (ml/m 2 ) | 44.5 ± 10.9 | 42.3 ± 10.7 | 1.02 (0.995–1.05) | 0.12 |
| End-systolic volume index (ml/m 2 ) | 16.2 ± 5.9 | 15.8 ± 5.5 | 1.02 (0.97–1.07) | 0.48 |
| Ejection fraction (%) | 63.9 ± 8.3 | 62.8 ± 7.9 | 5.01 (0.11–237.54) | 0.41 |
| LAVI (ml/m 2 ) | 24.8 ± 8.1 | 22.3 ± 7.1 | 1.05 (1.01–1.09) | 0.011 |
| Transmitral early diastolic wave (E wave) (cm/s) | 80.6 ± 25.2 | 74.2 ± 17.3 | 1.02 (1.00–1.04) | 0.014 |
| Transmitral late diastolic wave (A wave) (cm/s) | 90.0 ± 24.6 | 77.8 ± 19.6 | 1.03 (1.01–1.04) | <0.001 |
| Transmitral early-to-diastolic wave ratio (E/A ratio) | 0.92 ± 0.25 | 1.02 ± 0.51 | 0.42 (0.14–1.22) | 0.11 |
| Deceleration time (cm/s) | 239 ± 58 | 236 ± 63 | 1.00 (0.996–1.01) | 0.68 |
| Diastolic stage | 0.57 ± 0.62 | 0.54 ± 0.61 | 1.11 (0.70–1.77) | 0.67 |
∗ HRs relate to the risk for the combined outcome, on the basis of the univariate Cox analysis.
The 2 groups achieved adequate stress, attaining 94.5 ± 7.4% of predicted maximum heart rate and a maximum rate-pressure product of 27,840 ± 5,033 mm Hg/s. These were similar between the groups ( Table 3 ). Rest systolic pressure was significantly higher in patients with events (144 ± 22 vs 134 ± 18 mm Hg, p <0.0001), but peak heart rate was greater in those without adverse outcomes (155 ± 16 vs 148 ± 15 beats/min, p = 0.0026). Maximum exercise capacity was significantly lower in patients with events (7.5 ± 2.1 vs 8.5 ± 2.1 METs, p = 0.0147). Furthermore, HRR was significantly lower in the event group (23.7 ± 11.7 vs 29.7 ± 12 beats/min, p = 0.0005), although still higher than the cutoff of 18 beats/min.
| Variable | Entire Cohort | Events | No Events | HR (95% CI) | p Value |
|---|---|---|---|---|---|
| Rest heart rate (beats/min) | 77 ± 13 | 80 ± 15 | 77 ± 13 | 1.02 (0.96–1.04) | 0.13 |
| Peak heart rate (beats/min) | 155 ± 16 | 148 ± 15 | 155 ± 16 | 0.97 (0.95–0.99) | 0.003 |
| Rest systolic blood pressure (mm Hg) | 134 ± 18 | 144 ± 22 | 134 ± 18 | 1.03 (1.01–1.04) | <0.001 |
| Peak systolic blood pressure (mm Hg) | 180 ± 26 | 183 ± 24 | 180 ± 26 | 1.00 (0.99–1.02) | 0.46 |
| Rest diastolic blood pressure (mm Hg) | 82 ± 10 | 83 ± 13 | 82 ± 10 | 1.01 (0.98–1.04) | 0.39 |
| Peak diastolic blood pressure (mm Hg) | 84 ± 12 | 86 ± 13 | 84 ± 11 | 1.01 (0.99–1.04) | 0.28 |
| % predicted maximal heart rate | 94.5 ± 7.4 | 93.0 ± 6.8 | 94.5 ± 7.4 | 0.97 (0.93–1.02) | 0.97 |
| Maximum rate-pressure product | 27,840 ± 5,033 | 27,143 ± 5,078 | 27,875 ± 5,031 | 1.00 (1.00–1.00) | 0.37 |
| Exercise capacity (METs) | 8.4 ± 2.2 | 7.5 ± 2.1 | 8.5 ± 2.2 | 0.83 (0.72–0.97) | 0.016 |
| Normal Duke treadmill score | 799 (87%) | 39 (83%) | 760 (88%) | 0.74 (0.34–1.58) | 0.43 |
| HRR (beats/min) | 29.5 ± 12.1 | 23.7 ± 11.7 | 29.7 ± 12.1 | 0.94 (0.91–0.97) | <0.001 |
Stay updated, free articles. Join our Telegram channel

Full access? Get Clinical Tree


