Atherosclerosis is an inflammatory process, and inflammatory biomarkers have been identified as useful predictors of clinical outcomes. The prognostic value of leukocyte count in patients with ST-segment elevation myocardial infarctions who undergo primary percutaneous coronary intervention is not clearly defined. In 325 patients with STEMIs treated with primary percutaneous coronary intervention, total and differential leukocyte counts, once at admission and 24 hours thereafter, were measured. The neutrophil/lymphocyte ratio (NLR) was calculated as the ratio of neutrophil count to lymphocyte count. The primary end point was all-cause death. Twenty-five patients (7.7%) died during follow-up (median 1,092 days, interquartile range 632 to 1,464). The total leukocyte count decreased (from 11,853 ± 3,946/μl to 11,245 ± 3,979/μl, p = 0.004) from baseline to 24 hours after admission. Patients who died had higher neutrophil counts (9,887 ± 5,417/μl vs 8,399 ± 3,639/μl, p = 0.061), lower lymphocyte counts (1,566 ± 786/μl vs 1,899 ± 770/μl, p = 0.039), and higher NLRs (8.58 ± 7.41 vs 5.51 ± 4.20, p = 0.001) at 24 hours after admission. Baseline leukocyte profile was not associated with outcomes. The best cut-off value of 24-hour NLR to predict mortality was 5.44 (area under the curve 0.72, 95% confidence interval [CI] 0.52 to 0.82). In multivariate analysis, a 24-hour NLR ≥5.44 was an independent predictor of mortality (hazard ratio 3.12, 95% CI 1.14 to 8.55), along with chronic kidney disease (hazard ratio 4.23, 95% CI 1.62 to 11.1) and the left ventricular ejection fraction (hazard ratio 0.94 for a 3% increase, 95% CI 0.76 to 0.93). In conclusion, NLR at 24 hours after admission can be used for risk stratification in patients with STEMIs who undergo primary PCI. Patients with STEMIs with 24-hour NLRs ≥5.44 are at increased risk for mortality and should receive more intensive treatment.
There exist some reports that leukocyte and its components are associated with prognosis in patients with ST-segment elevation myocardial infarctions (STEMIs). However, total and differential leukocyte counts are not static but change in acute stages of critical illness. Furthermore, it is unclear which leukocyte component and what timing of measurement have the best prognostic value in patients with STEMI who undergo primary percutaneous coronary intervention (PCI). Therefore, in the present study, we sought to determine the prognostic value of leukocyte profiles in patients with STEMIs treated with primary PCI.
Methods
From July 2003 through February 2010, a total of 325 patients with STEMIs treated with primary PCI and with leukocyte profiles at admission and 24 hours thereafter were analyzed. We excluded patients with symptom onset >12 hours, underlying cancer, chronic inflammatory disease, or any systemic infection that occurred during the first 24 hours after admission. Patients referred to bypass surgery <24 hours after admission were excluded as well. Primary PCI was performed using conventional techniques. The type of stent and the use of thrombectomy devices, predilatation, poststenting adjunctive balloon inflation, intravascular ultrasound, intra-arterial balloon counterpulsation, or glycoprotein IIb/IIIa inhibitors were all left to the operators’ discretion. Total leukocyte count and its subtypes, including neutrophil, lymphocyte, and monocyte absolute counts, were analyzed using an automated blood cell counter. The neutrophil/lymphocyte ratio (NLR) was calculated as the ratio of neutrophil count to lymphocyte count, both obtained from the same blood sample. The left ventricular (LV) ejection fraction was calculated after measuring the end-diastolic and end-systolic LV volumes in the apical 4-chamber and 2-chamber views using the modified Simpson’s method. The study complied with the Declaration of Helsinki and was approved by the institutional review board (B-1112/141-107). The requirement for informed consent was waived.
The primary end point was all-cause death. The secondary end point was change in LV systolic function during follow-up. All patients had regular outpatient visits with a cardiology specialist. Data were prospectively gathered by a dedicated coordinator. When follow-up visits were missed or key data were missing, telephone contact was made by data coordinators. To confirm the completeness of follow-up and minimize underreporting of events, the vital status of all patients was checked with the National Statistical Agency and events of patients with possible follow-up loss with the National Health Insurance Corporation. Adherence to antiplatelet treatment was assessed during the period.
Data are presented as numbers and frequencies for categorical variables and as mean ± SD for continuous variables. For comparisons among groups, the chi-square test (or Fisher’s exact test when any expected cell count was <5 for a 2 × 2 table) was used for categorical variables and the unpaired Student’s t test or 1-way analysis of variance for continuous variables. For changes of leukocyte profiles between the initial and the 24-hour measurements, paired Student’s t tests were performed. Receiver-operating characteristic curve analysis was used to determine the best cut-off value for predicting clinical end points. The chronologic trend of outcomes was expressed as Kaplan-Meier estimates and was compared among the various NLRs. A log-rank test was used to analyze the significant differences in clinical outcomes. A multivariate Cox proportional-hazards regression model was used to find the independent predictors of the primary end point. Factors entered into the multivariate model included those with p values <0.05 from the univariate analysis and variables with known prognostic value. Two-sided p values <0.05 were considered statistically significant. Statistical tests were performed using SPSS version 17 (SPSS, Inc., Chicago, Illinois).
Results
A total of 325 patients were available for the final analysis. The clinical and angiographic characteristics of the study population are listed in Table 1 . Overall, the mean age was 60.9 years, and most patients were men (71%). Fifty percent of patients had hypertension, 27.4% had diabetes mellitus, and 35.7% had chronic kidney disease.
| Variable | Total | Alive (n = 300) | Dead (n = 25) | p Value |
|---|---|---|---|---|
| Age (yrs) | 60.9 ± 13.9 | 60.1 ± 3.8 | 70.6 ± 10.8 | <0.001 |
| Age >70 yrs | 82 (25%) | 69 (23%) | 13 (52%) | 0.001 |
| Men | 235 (72%) | 223 (74%) | 12 (48%) | 0.005 |
| Current smokers | 71 (22%) | 66 (22%) | 5 (20%) | 0.816 |
| Hypertension ∗ | 163 (50%) | 151 (50%) | 12 (48%) | 0.823 |
| Diabetes mellitus | 89 (27%) | 79 (26%) | 10 (40%) | 0.141 |
| Dyslipidemia † | 94 (29%) | 88 (29%) | 6 (24%) | 0.565 |
| Chronic kidney disease ‡ | 116 (36%) | 99 (33%) | 17 (68%) | <0.001 |
| Previous PCI | 23 (7%) | 21 (7%) | 2 (8%) | 0.851 |
| Previous myocardial infarction | 17 (5%) | 14 (5%) | 3 (12%) | 0.114 |
| Cerebrovascular accident | 28 (9%) | 24 (8%) | 4 (16%) | 0.252 |
| Body mass index (kg/m 2 ) | 24.1 ± 3.2 | 24.1 ± 3.1 | 24.2 ± 4.7 | 0.955 |
| Number of coronary arteries narrowed | 0.041 | |||
| 1 | 132 (41%) | 127 (42%) | 5 (20%) | |
| 2 | 99 (31%) | 91 (30%) | 8 (32%) | |
| 3 | 93 (29%) | 81 (27%) | 12 (48%) | |
| Culprit lesion | 0.980 | |||
| Left main coronary artery | 2 (1%) | 2 (1%) | 0 (0%) | |
| Left anterior descending coronary artery | 191 (59%) | 176 (59%) | 15 (60%) | |
| Circumflex coronary artery | 25 (8%) | 23 (8%) | 2 (8%) | |
| Right coronary artery | 107 (33%) | 99 (33%) | 8 (32%) | |
| Glomerular filtration rate (ml/min/1.73 m 2 ) | 65.9 ± 20.1 | 66.8 ± 19.7 | 54.7 ± 21.3 | 0.004 |
| Cholesterol (mg/dl) | 189.0 ± 45.2 | 189.9 ± 44.1 | 178.9 ± 56.2 | 0.243 |
| Triglyceride (mg/dl) (n = 255) | 131.3 ± 85.2 | 132.7 ± 87.3 | 112.5 ± 45.6 | 0.346 |
| High-density lipoprotein cholesterol (mg/dl) | 44.4 ± 11.1 | 44.5 ± 11.2 | 44.5 ± 9.9 | 0.463 |
| Low-density lipoprotein cholesterol (mg/dl) | 115.2 ± 39.6 | 115.6 ± 40.5 | 110.2 ± 24.3 | 0.585 |
| Maximum creatine kinase-MB (ng/ml) (n = 303) | 319 ± 292 | 313 ± 267 | 390 ± 500 | 0.205 |
| LV ejection fraction (%) (n = 303) | 48 ± 12 | 49 ± 11 | 37 ± 18 | 0.006 |
| Initial complete blood count | ||||
| White blood cells (/μl) | 11,853 ± 3,946 | 11,826 ± 3,837 | 12,177 ± 5,161 | 0.670 |
| Neutrophils (/μl) | 8,538 ± 4,035 | 8,551 ± 3,947 | 8,369 ± 5,069 | 0.828 |
| Segment (%) | 69.8 ± 16.2 | 70.1 ± 16.0 | 66.2 ± 18.2 | 0.250 |
| Lymphocytes (/μl) | 2,519 ± 1,447 | 2,487 ± 1,397 | 2,894 ± 1,969 | 0.178 |
| Lymphocyte (%) | 23.1 ± 14.1 | 23.0 ± 13.9 | 25.8 ± 16.3 | 0.330 |
| Monocytes (/μl) | 408 ± 201 | 404 ± 196 | 458 ± 262 | 0.196 |
| Monocyte (%) | 3.5 ± 1.4 | 3.5 ± 1.4 | 3.9 ± 1.5 | 0.145 |
| NLR | 5.03 ± 4.27 | 5.04 ± 4.19 | 4.89 ± 5.25 | 0.866 |
| 24-hour complete blood count | ||||
| White blood cells (/μl) | 11,245 ± 3,979 | 11,152 ± 3,782 | 12,362 ± 5,845 | 0.145 |
| Neutrophils (/μl) | 8,513 ± 3,815 | 8,399 ± 3,639 | 9,887 ± 5,417 | 0.061 |
| Segment (%) | 74.0 ± 9.3 | 73.7 ± 9.2 | 78.1 ± 9.6 | 0.024 |
| Lymphocytes (/μl) | 1,874 ± 775 | 1,899 ± 770 | 1,566 ± 786 | 0.039 |
| Lymphocyte (%) | 18.1 ± 8.1 | 18.4 ± 8.1 | 14.1 ± 7.6 | 0.010 |
| Monocytes (/μl) | 715 ± 329 | 708 ± 323 | 781 ± 402 | 0.295 |
| Monocyte (%) | 6.5 ± 2.4 | 6.5 ± 2.4 | 6.6 ± 2.6 | 0.922 |
| NLR | 5.75 ± 4.58 | 5.51 ± 4.20 | 8.58 ± 7.41 | 0.001 |
∗ Systolic blood pressure >140 mm Hg, diastolic blood pressure >90 mm Hg, or taking antihypertensive medications according to the Seventh Report of the Joint National Committee on Prevention, Detection, Evaluation, and Treatment of High Blood Pressure.
† Serum total cholesterol ≥240 mg/dl, serum triglyceride ≥200 mg/dl, low-density lipoprotein cholesterol ≥130 mg/dl, high-density lipoprotein cholesterol <35 mg/dl, or taking any lipid-lowering medication.
‡ Modification of Diet in Renal Disease glomerular filtration rate <60 ml/min/1.73 m 2 or renal replacement treatment as regular use of peritoneal dialysis or hemodialysis.
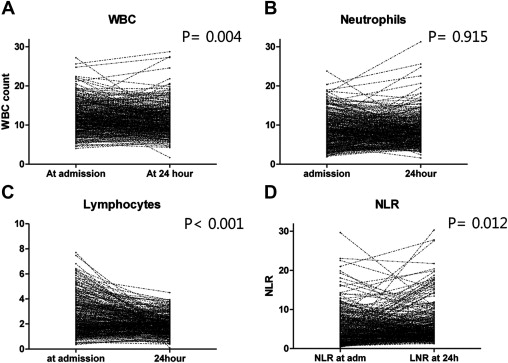
We examined whether there was a change in total and differential leukocyte counts between the initial measurement and those at 24 hours after admission. During the first 24 hours, the total leukocyte count decreased significantly (from 11,853 ± 3,946/μl to 11,245 ± 3,979/μl, p = 0.004). Most of its change was attributable to the change in lymphocyte count, which decreased significantly by 25.6% (from 2,519 ± 1,447/μl to 1,874 ± 775/μl, p <0.001), whereas the neutrophil count did not change (from 8,538 ± 4,035/μl to 8,513 ± 3,815/μl, p = 0.915). Consequently, the NLR increased as well (from 5.03 ± 4.27 to 5.75 ± 4.58, p = 0.012) ( Figure 1 ).
Twenty-five patients (7.7%) died during follow-up (median follow-up duration 1,092 days, interquartile range 632 to 1,464). Patients who died were older, were less likely to be men, and were more likely to have chronic kidney disease. The patients who died had higher neutrophil counts (9,887 ± 5,417/μl vs 8,399 ± 3,639/μl, p = 0.061) and lower lymphocyte counts (1,566 ± 786/μl vs 1,899 ± 770/μl, p = 0.039) at 24 hours after admission. The 24-hour NLR was significantly higher in those who died (8.58 ± 7.41 vs 5.51 ± 4.20, p = 0.001). However, there was no difference in the baseline total and differential leukocyte counts between the 2 groups ( Table 1 ).
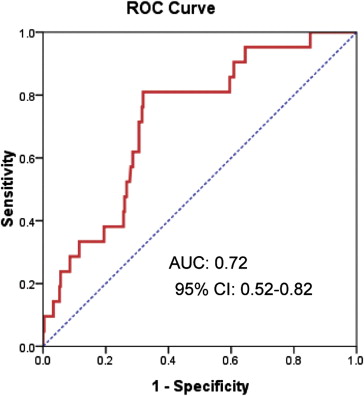
Because patients who died had significantly higher 24-hour NLRs, we performed a receiver-operating characteristic curve analysis to determine the best cut-off value of 24-hour NLR to predict the primary end point. The area under the curve was 0.72 (95% confidence interval [CI] 0.52 to 0.82, p = 0.001), and the best cut-off value was 5.44, with sensitivity, specificity, positive predictive value, negative predictive value, and diagnostic accuracy of 72%, 68%, 16%, 97%, and 68%, respectively ( Figure 2 ). When dividing the patients according to this cut-off value, patients with 24-hour NLRs ≥5.44 were older, more likely to have chronic kidney disease, more frequently had histories of cerebrovascular accident, had more advanced coronary artery disease extent, and had more culprit lesions in the left anterior descending coronary artery, but they were less likely to have dyslipidemia ( Table 2 ).
| Variable | All (n = 325) | NLR <5.44 (n = 211) | NLR ≥5.44 (n = 114) | p Value |
|---|---|---|---|---|
| Age (yrs) | 60.9 ± 13.9 | 58.6 ± 13.5 | 65.2 ± 13.5 | <0.001 |
| Age >70 yrs | 82 (25%) | 38 (18%) | 44 (39%) | <0.001 |
| Men | 235 (72%) | 159 (75%) | 76 (67%) | 0.095 |
| Current smokers | 71 (22%) | 44 (21%) | 27 (24%) | 0.556 |
| Hypertension ∗ | 163 (50%) | 99 (47%) | 64 (56%) | 0.113 |
| Diabetes mellitus | 89 (27%) | 51 (24%) | 38 (33%) | 0.077 |
| Dyslipidemia † | 94 (29%) | 69 (33%) | 25 (22%) | 0.038 |
| Chronic kidney disease ‡ | 116 (36%) | 60 (28%) | 56 (49%) | <0.001 |
| Previous PCI | 23 (7%) | 13 (6%) | 10 (9%) | 0.381 |
| Previous myocardial infarction | 17 (5%) | 14 (7%) | 3 (3%) | 0.122 |
| Cerebrovascular accident | 28 (9%) | 11 (5%) | 17 (15%) | 0.003 |
| Body mass index (kg/m 2 ) | 24.2 ± 3.2 | 24.5 ± 3.0 | 23.5 ± 3.5 | 0.014 |
| Number of coronary arteries narrowed | 0.030 | |||
| 1 | 132 (41%) | 92 (44%) | 40 (35%) | |
| 2 | 99 (31%) | 68 (32%) | 31 (27%) | |
| 3 | 93 (29%) | 50 (24%) | 43 (38%) | |
| Culprit lesion | 0.010 | |||
| Left main coronary artery | 2 (1%) | 2 (1%) | 0 (0) | |
| Left anterior descending coronary artery | 191 (59%) | 111 (53%) | 80 (70%) | |
| Circumflex coronary artery | 25 (8%) | 21 (10%) | 4 (4%) | |
| Right coronary artery | 107 (33%) | 77 (37%) | 30 (26%) | |
| Glomerular filtration rate (ml/min/1.73 m 2 ) | 65.9 ± 20.1 | 69.3 ± 17.6 | 59.6 ± 22.7 | <0.001 |
| Cholesterol (mg/dl) | 189.0 ± 45.2 | 194 ± 46 | 180 ± 42 | 0.007 |
| Triglyceride (mg/dl) (n = 255) | 131.3 ± 85.2 | 142 ± 95 | 112 ± 57 | 0.007 |
| High-density lipoprotein cholesterol (mg/dl) | 44.4 ± 11.1 | 44 ± 11 | 45 ± 11 | 0.425 |
| Low-density lipoprotein cholesterol (mg/dl) | 115.2 ± 39.6 | 119 ± 41 | 109 ± 36 | 0.065 |
| Creatine kinase-MB (ng/ml) | 319 ± 292 | 303 ± 262 | 350 ± 339 | 0.158 |
Stay updated, free articles. Join our Telegram channel

Full access? Get Clinical Tree


