Cardiomyopathy is the leading cause of death in Friedreich’s ataxia. This autosomal recessive disease is caused by a homozygous guanine-adenine-adenine trinucleotide repeat expansion in the frataxin gene (chromosome 9q21). One untoward effect of frataxin deficiency is the lack of iron (Fe)-sulfur clusters. Progressive remodeling of the heart in FA, however, may be more specifically related to sarcoplasmic Fe overload. The Fe-containing inclusions in a small percentage of cardiomyocytes may not represent purely mitochondrial accumulation of the metal. The objective of the present study was to re-examine the contribution of Fe to cardiomyocyte hypertrophy, fiber necrosis, and myocardial scarring, using a combination of X-ray fluorescence, slide histochemistry of Fe, and immunohistochemistry of 2 Fe-related proteins. Polyethylene glycol-embedded human cardiac tissues from the left and right ventricular walls, ventricular septum, right atrium, and atrial septum were studied using qualitative and quantitative X-ray fluorescence. Tissues were recovered from the polyethylene glycol matrix, re-embedded in paraffin, and sectioned for visualization of Fe, ferritin, and ferroportin. X-ray fluorescence showed quantifiable levels of Fe and zinc. Regions of significantly increased Fe (1 to 4 mm 2 ) were irregularly distributed throughout the working myocardium. Fe granules were sparse in conductive tissue. Zinc signals remained unchanged. Robust cytosolic ferritin reaction product occurred in many fibers of the affected regions. Ferroportin displayed no response except in fibers with advanced Fe overload. These observations are at variance with the concept of selective Fe overload only in cardiac mitochondria. In conclusion, Fe-mediated damage to cardiomyocytes and myocardial scarring are more likely due to cytosolic Fe excess.
Cardiomyopathy is the leading cause of death in Friedreich’s ataxia (FA). Progressive thickening of the cardiac walls and a declining left ventricular ejection fraction results in relentless progression and resistance to therapy, and heart disease can antedate the neurologic manifestations. Campuzano et al identified the mutation in FA as an abnormally long homozygous guanine-adenine-adenine trinucleotide repeat expansion in intron 1 of the frataxin gene (chromosome 9q21) that causes a transcriptional block. These investigators also recognized the role of frataxin, a mitochondrial protein, in iron (Fe) metabolism. Cardiomyocytes in autopsy and biopsy specimens of patients with FA often contain minute Fe-positive inclusions. The clinical cardiologic phenotype correlates with the level of the remaining protein, and patients with short guanine-adenine-adenine repeat expansions and long survival have neither heart disease nor Fe-positive inclusions. Fe accumulation in the hearts of patients with FA does not reach the level of primary or secondary Fe-overload cardiomyopathy, and systemic chelation therapy has gained little support. The pathologic features of the heart in FA have been the subject of many case reports; however, sinoatrial and atrioventricular nodes and Purkinje fibers have received little attention. In the present study, access to 8 whole FA hearts allowed qualitative and quantitative evaluation of Fe in both working myocardium and cardiac conductive tissues. X-ray fluorescence (XRF) data and matching ferritin immunohistochemistry reported here support the conclusion that FA causes a significant, highly localized, cytosolic increase of cardiac Fe.
Methods
The basic clinical data and heart weight of 8 patients with genetically confirmed FA are listed in Table 1 . Whole hearts were obtained at autopsy through a formal tissue donation program of the Friedreich’s Ataxia Research Alliance (Downingtown, Pennsylvania) and National Ataxia Foundation (Minneapolis, Minnesota). The specimens were fixed in 10% neutral buffered formalin. Control specimens (3 men and 5 women, age 41 to 66 years) were obtained from the National Disease Research Interchange (Philadelphia, Pennsylvania) and the academic autopsy practice of Albany Medical College (Albany, New York). The mean heart weight ± SD of the controls was 414 ± 119 g (range 260 to 541).
| Pt. No. | Gender | Age at Onset (y) | Age at Death (y) | Disease Duration (y) | Guanine-Adenine-Adenine Repeats | Heart Weight (g) | |
|---|---|---|---|---|---|---|---|
| Allele 1 | Allele 2 | ||||||
| 1 | Male | 7 | 34 | 27 | 1,114 | 1,114 | 418 |
| 2 | Male | 8 | 27 | 19 | 1,070 | 700 | 413 |
| 3 | Female | 8 | 23 | 15 | 864 | 668 | 358 |
| 4 | Male | 9 | 33 | 24 | 925 | 925 | 421 |
| 5 | Male | 10 | 24 | 14 | 1,050 | 700 | 547 |
| 6 | Female | 10 | 24 | 14 | 910 | 740 | 427 |
| 7 | Female | 15 | 69 | 54 | 560 | 560 | 359 |
| 8 | Female | 20 | 50 | 30 | 1,122 | 515 | 487 |
| Mean ± SD | 11 ± 4 | 36 ± 16 | 25 ± 13 | 952 ± 186 | 740 ± 195 | 429 ± 63 | |
The institutional review board at the Veterans Affairs Medical Center (Albany, New York) approved the present study for research on tissue samples obtained by autopsy.
Five tissue samples were collected from each heart: left ventricular wall, right ventricular wall, ventricular septum, right atrium, and atrial septum. Samples of the left ventricular wall, right ventricular wall, and ventricular septum were taken from transverse slices midway between the cardiac apex and atrioventricular groove. The right atrium and atrial septum were dissected according to Aschoff and Anderson et al to obtain the sinoatrial and atrioventricular nodes with adjacent working myocardium on the same section.
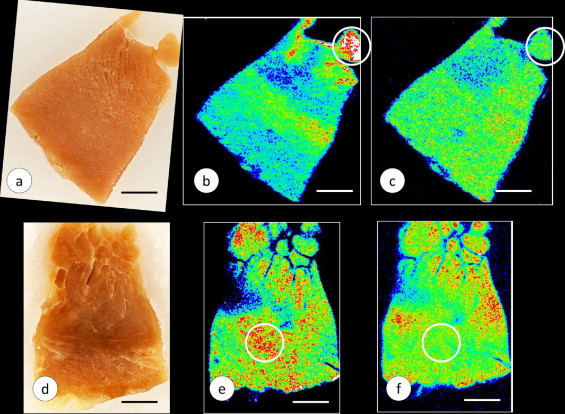
The preparation of tissue samples and Fe and zinc (Zn) calibration standards in polyethylene glycol (PEG) for XRF and subsequent tissue recovery were previously described in detail. In brief, the cardiac tissues were infiltrated at room temperature by immersion in progressively more concentrated aqueous solutions of PEG 400 (30% to 90%, weight/vol; Sigma Aldrich, St. Louis, Missouri) followed by liquefied PEG 1000 and PEG 1450 at 60°C. After cooling, the solid blocks of PEG 1450 were “faced” by microtome to present a smooth surface for XRF ( Figure 1 ). XRF maps were produced by delivery of a monochromatic X-ray beam from a molybdenum target source to the surface of the specimen. The beam moved across a user-defined region of the specimen in a raster-like manner to generate element-specific maps with millimeter scales in the x- and y-axes. The proprietary computer program (X-Ray Optical Systems, East Greenbush, New York) was used to segment the maps and assign pseudocolors to regions of high, low, and intermediate XRF intensity. White and red indicated maximum XRF. Background XRF was obtained from the PEG 1450 matrix outside the limits of the specimen. Calibration standards for the 2 elements in cardiac tissue with the highest XRF, Fe and Zn, were prepared from Fe–III- and Zn–II-mesoporphyrin, as described previously. Ten measurements were made in the zones of the tissue samples that exhibited maximum XRF (white or red). The mean concentrations of these metals in each specimen were obtained by averaging 10 measurements, reducing the values (counts/5 seconds) by subtracting the background XRF, and comparing them with the Fe and Zn calibration standards. The results were expressed as μg/ml PEG 1450. Given the high solubility of PEG 1450 in water, the embedded tissues were recovered without distortion and re-embedded in paraffin. The Fe and Zn maps were compared with sections stained with hematoxylin and eosin, and for Fe, cytosolic ferritin, and ferroportin.
Paraffin sections, 6-μm thick, were cut for routine staining with hematoxylin and eosin. Trivalent Fe was visualized with Perls’s reagents (1% each of potassium ferrocyanide and hydrochloric acid, weight/vol). Paraffin sections were also used for immunohistochemistry with polyclonal antihuman liver holoferritin (2 μg protein/ml; Dako, Carpinteria, California) and polyclonal anti-ferroportin peptide (0.21 μg protein/ml). Anti-ferroportin was raised against the antigenic peptide NLHKDTEPKPLEGT linked to keyhole limpet hemocyanin and immunoaffinity-purified under contract with AnaSpec (San José, California). The sections were dewaxed using standard techniques, and endogenous peroxidase activity was suppressed by immersion in methanol containing 3% hydrogen peroxide for 30 minutes. The sections were chelated with a solution of 2,2′-dipyridyl and sodium hydrosulfite (2 mM each in acetic acid-sodium acetate buffer, pH 6). Antigen retrieval for ferritin consisted of immersion in DIVA, a proprietary decloaking solution (Biocare Medical, Concord, California), for 30 minutes at 95°C. The sections intended for visualization of ferroportin were heated for 10 minutes in an autoclave at 120°C while immersed in dilute hydrochloric acid (2 mM). The sequence of incubations after rehydration, oxidation, chelation, and antigen retrieval was background suppression by normal horse serum (10% by volume) in phosphate-buffered saline containing 0.5% bovine serum albumin (weight/vol), followed by primary antibody (0.2 to 4 μg protein/ml in 0.5% bovine serum albumin in phosphate-buffered saline), secondary biotinylated anti-rabbit IgG (Vector, Burlingame, California; 0.6 μg protein/ml in phosphate-buffered saline), horseradish peroxidase-labeled streptavidin (2 μg/ml in phosphate-buffered saline; Sigma-Aldrich), diaminobenzidine/urea hydrogen peroxide (Sigma-Aldrich). The Fe and Zn levels in the regions of maximum XRF were quantified and examined for statistically significant differences (α = 0.05) between the FA and control samples, using a standard t test.
Results
The mean heart weight of the patients with FA ( Table 1 ) did not differ significantly from the heart weight of the 8 normal controls (414 ± 119 g, range 260 to 541) but were greater than reported for men and women who had died from injuries (men 365 ± 71 g, range 90 to 630; women 312 ± 78 g, range 174 to 590). The difference between the control groups included younger age (men 42 ± 17 years, women 49 ± 20 years) and wider weight range in the forensic cases. The height and weight of the patients with FA were not available, and the cardiac mass index could not be calculated.
Figure 1 illustrates the PEG 1450-embedded and “faced” gross specimens from the left ventricular wall of a patient with FA and a normal control, with matching Fe and Zn maps. The maps display variation in pseudocolors, indicating the range of XRF signals from high (white and red) to intermediate (orange and green) and low (light and dark blue). All signals were corrected by subtracting background XRF, rendering the specimen-free areas of the PEG block black. In the case of FA, the cut surface of a papillary muscle showed the strongest Fe signal (white and red; Figure 1 ). Zn XRF was low ( Figure 1 ). The control specimen showed heterogeneous Fe and Zn signals ( Figure 1 ). Areas of peak emission for Fe and Zn did not coincide ( Figure 1 ).
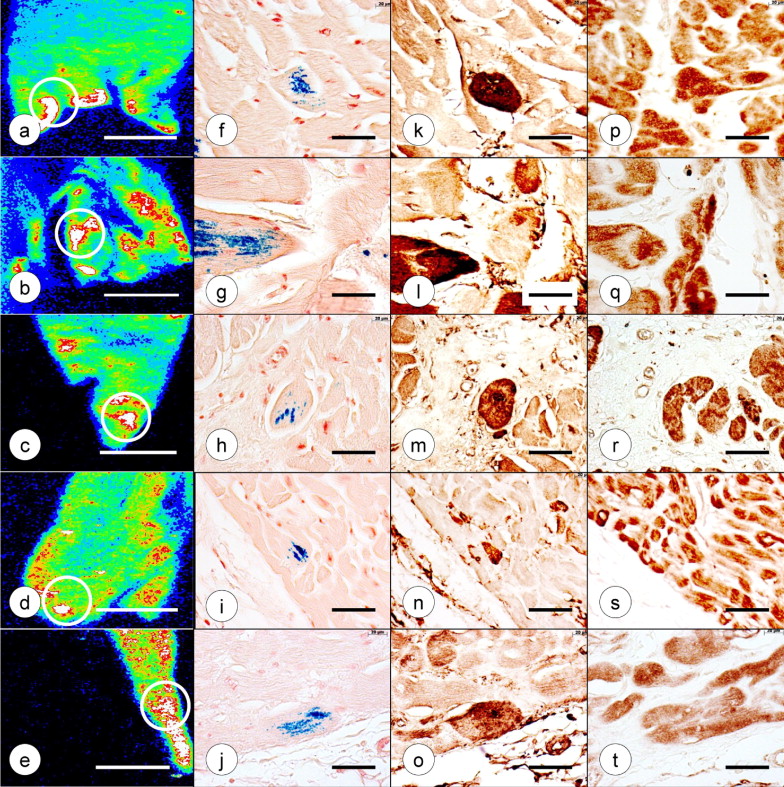
The XRF-based quantitative analyses of Fe and Zn in 5 identified regions of the heart of the 8 cases of FA and 8 normal controls are listed in Table 2 . To determine a possible correlation of Fe and Zn, the data points for both metals were collected from regions of maximum Fe XRF, such as illustrated by the white circles in Figures 1 and 2 . All 5 regions of FA myocardium yielded significantly greater Fe concentrations compared to controls. The mean Zn concentration in the FA hearts did not differ from that of the normal controls. Quantification of Fe and Zn by XRF of PEG 1450-infiltrated tissues was validated by comparison with the results obtained using different methods.
| Variable | Samples (n) | LVW (μg/ml) | RVW (μg/ml) | VS (μg/ml) | RA (μg/ml) | AS (μg/ml) |
|---|---|---|---|---|---|---|
| Fe | ||||||
| FA | 8 | 190.8 ± 58.1 | 113.2 ± 43.8 | 180.4 ± 75.4 | 114.5 ± 43.2 | 98.4 ± 33 |
| Controls | 8 | 115.2 ± 25.5 | 73.5 ± 26.3 | 96.6 ± 25.5 | 54.7 ± 22.7 | 60.0 ± 17.1 |
| p Value | 0.005 | 0.045 | 0.012 | 0.004 | 0.016 | |
| Zn | ||||||
| FA | 8 | 24.1 ± 11.2 | 21.5 ± 16.7 | 29.8 ± 21.5 | 14.3 ± 7 | 15.1 ± 6.7 |
| Controls | 8 | 26.2 ± 6.5 | 20.0 ± 6.7 | 28.6 ± 10.6 | 13.7 ± 8.9 | 15.9 ± 13.1 |
| p Value | 0.64 | 0.811 | 0.886 | 0.878 | 0.88 |