Although obesity is a coronary heart disease risk factor, in cohorts of patients with coronary heart disease, an “obesity paradox” exists whereby patients with obesity have a better prognosis than do leaner patients. Obesity is generally defined by body mass index, with relatively little described regarding body fat (BF). In this study, 581 consecutive patients with coronary heart disease divided into the Gallagher BF categories of underweight (n = 12), normal (n = 189), overweight (n = 214), and obese (n = 166) were evaluated, and 3-year mortality was assessed using the National Death Index. Mortality was U shaped, being highest in the underweight group (25%, p <0.0001 vs all groups) and lowest in the overweight group (2.3%), with intermediate mortality in the normal-BF (6.4%, p = 0.02 vs overweight) and obese (3.6%) groups. In multiple regression analysis, high BF (odds ratio 0.89, 95% confidence interval 0.82 to 0.95) and higher Gallagher class (odds ratio 0.46, 95% confidence interval 0.25 to 0.84) were independent predictors of lower mortality. In conclusion, on the basis of Gallagher BF, an obesity paradox exists, with the highest mortality in the underweight and normal-BF groups and the lowest mortality in the overweight group. Lower BF as a continuous variable and by Gallagher classification as a categorical value were independent predictors of higher mortality.
It has been theorized by many investigators that part of the inconsistent relation between obesity and major clinical prognoses, including mortality, may be due to the inaccurate diagnosis of overweight and obesity by the conventional body mass index (BMI) assessment. Clearly, defining obesity by other methods, including waist circumference, waist-to-hip ratio, and percentage body fat (BF), may be more accurate. However, we have reported that the obesity paradox is present by both BMI and BF in cohorts with heart failure and coronary heart disease (CHD). In the present study, we assess mortality in a cohort with CHD using the Gallagher BF method, which uses age, gender, and BF to classify patients as underweight, normal, overweight, or obese.
Methods
We retrospectively reviewed the records of 622 consecutive patients with stable CHD who were referred for potential entry into phase 2 cardiac rehabilitation and exercise programs from January 1, 2000 to July 31, 2005, who had baseline anthropometric, lipid, and clinical data, as we have previously described (41 patients were excluded because of incomplete data). The subjects were referred after coronary artery bypass graft surgery (33%), myocardial infarctions (21%), and/or a percutaneous coronary intervention (27%). Patients were divided into 4 groups on the basis of Gallagher BF thresholds ( Table 1 ), which also include gender, age, and race (which was not incorporated in our analyses) to divide the population into underweight, normal BF, overweight, and obese. In addition patients were divided according to BMI into underweight (<18.5 kg/m 2 ), normal (≤18.5 and <25 kg/m 2 ), overweight (≤25 and <30 kg/m 2 ), and obese (≥30 kg/m 2 ) groups.
| Age (yrs) | Percentage BF Cutoffs by Age and Gender | ||
|---|---|---|---|
| Category | Gender | ||
| Men | Women | ||
| 20–39 | Underweight | <8.0% | <21.0% |
| Normal | 8.0%–20.9% | 21.0%–32.9% | |
| Overweight | 21.0%–25.9% | 33.0%–38.9% | |
| Obese | ≥26.0% | ≥39.0% | |
| 40–59 | Underweight | <11.0% | <23.0% |
| Normal | 11.0%–22.9% | 23.0%–34.9% | |
| Overweight | 23.0%–28.9% | 35.0%–40.9% | |
| Obese | ≥29.0% | ≥41.0% | |
| ≥60 | Underweight | <13.0% | <25.0% |
| Normal | 13.0%–24.9% | 25.0%–37.9% | |
| Overweight | 25.0%–30.9% | 38.0%–42.9% | |
| Obese | ≥31.0% | ≥43.0% | |
Percentage BF was assessed by the sum of the skin-fold method, which uses the average of 3 skin folds (chest, abdomen, and thigh in men and thigh, triceps, and suprailiac in women), as previously described. All measurements were made in the early morning before cardiopulmonary stress testing, as previously described. Prevalence of hypertension, current smoking, and diabetes was assessed using diagnostic codes. Patients were followed for an average of >3 years (mean 1,257 ± 528 days, range 231 to 2,149) to determine all-cause mortality using the National Death Index. The study was approved by the institutional review board at Ochsner Medical Center.
Data for the 4 groups were compared using analysis of variance and chi-square tests, and Kaplan-Meier survival curves were constructed to assess survival. Multivariate logistic regression was performed to predict mortality adjusting for age, gender, ejection fraction, peak oxygen consumption, and BF (either as a continuous variable or by Gallagher group).
Results
Baseline characteristics of the subject population and of the 4 distinct Gallagher BF groups are listed in Table 2 , which demonstrates that our population was overall overweight or obese as determined by either BMI or BF. The groups differed in age, peak oxygen consumption, high-density lipoprotein cholesterol, low-density lipoprotein cholesterol, and fasting glucose. The underweight group contained significantly more women, and underweight patients more often had histories of hypertension and were less likely to have diabetes. Overweight patients were more likely than those in the normal and obese groups to have hypertension, and were less likely to be women, and were slightly less likely to have diabetes than obese patients (p = 0.10).
| Variable | Population (n = 581) | 4 Groups Based on Gallagher Percentage BF Cutoffs | p Value (Analysis of Variance) | |||
|---|---|---|---|---|---|---|
| Underweight | Normal | Overweight | Obese | |||
| (n = 12) | (n = 189) | (n = 214) | (n = 166) | |||
| BMI (kg/m 2 ) | 28.6 ± 5.1 | 21.2 ± 3.7 | 25.3 ± 3.3 | 28.1 ± 3.4 | 33.5 ± 4.8 | <0.0001 |
| Percentage BF | 29.4 ± 7.9 | 16.3 ± 5.9 | 24.4 ± 5.8 | 28.8 ± 5.2 | 37.0 ± 6.7 | <0.0001 |
| Age (yrs) | 63.9 ± 10.7 | 68.8 ± 8.5 | 66.6 ± 10.1 | 63.4 ± 10.7 | 61.7 ± 10.6 | <0.0001 |
| Systolic blood pressure (mm Hg) | 125.5 ± 19.1 | NA | 126.3 ± 20.2 | 126.3 ± 19.1 | 125.4 ± 18.5 | 0.80 |
| Diastolic blood pressure (mm Hg) | 73.8 ± 10.7 | NA | 73.0 ± 9.7 | 73.0 ± 10.5 | 74.9 ± 11.3 | 0.35 |
| Ejection fraction (%) | 54.7 ± 11.2 | 55.7 ± 10.5 | 54.3 ± 11.4 | 54.3 ± 11.5 | 55.2 ± 11.0 | 0.85 |
| Peak oxygen consumption (ml/kg/min) | 16.7 ± 5.3 | 14.2 ± 3.9 | 16.5 ± 4.9 | 16.5 ± 5.6 | 15.7 ± 5.1 | 0.001 |
| Total cholesterol (mg/dl) | 166.8 ± 37.1 | 194.4 ± 35.6 | 166.6 ± 38.8 | 166.6 ± 33.4 | 169.9 ± 40.1 | 0.04 |
| High-density lipoprotein (mg/dl) | 41.4 ± 12.7 | 67.3 ± 24.1 | 43.8 ± 13.8 | 43.8 ± 10.6 | 38.3 ± 10.4 | <0.0001 |
| Low-density lipoprotein (mg/dl) | 97.3 ± 34.9 | 101.5 ± 23.1 | 95.8 ± 28.9 | 95.8 ± 27.1 | 102.7 ± 42.4 | 0.04 |
| Triglycerides (mg/dl) | 147.6 ± 83.0 | 127.6 ± 79.0 | 139.6 ± 66.0 | 139.6 ± 86.0 | 159.8 ± 94.9 | 0.12 |
| C-reactive protein (mg/L) | 5.6 ± 9.2 | 10.1 ± 12.8 | 4.9 ± 10.1 | 4.9 ± 9.2 | 6.3 ± 7.0 | 0.22 |
| Fasting glucose (mg/dl) | 110.3 ± 29.7 | 97.0 ± 13.2 | 106.2 ± 23.5 | 108.9 ± 28.7 | 116.9 ± 35.9 | 0.003 |
| Categorical variables | ||||||
| Gender (% female) | 157/581 (27) | 8/12 (67) | 67/189 (36) | 39/214 (18) | 43/166 (26) | |
| History of hypertension (%) | 189/536 (34) | 9/11 (82) | 52/172 (30) | 83/197 (42) | 45/156 (29) | |
| Active smoker (%) | 6/446 (1.3) | 0/11 (0) | 4/140 (2.9) | 2/156 (1.3) | 0/139 (0) | |
| History of diabetes (%) | 55/243 (24) | 0/12 (0) | 19/74 (26) | 18/99 (18) | 18/58 (31) | |
| Comparison categorical variables | Underweight vs normal | Underweight vs overweight | Underweight vs obese | Normal vs overweight | Overweight vs obese | Normal vs obese |
| Gender (% female) | 0.03 | <0.0001 | 0.003 | <0.0001 | 0.07 | 0.052 |
| History of hypertension | 0.0004 | 0.01 | 0.0003 | 0.02 | 0.01 | 0.78 |
| Active smokers | <0.0001 | <0.0001 | NA | 0.33 | <0.0001 | <0.0001 |
| History of diabetes | 0.046 | 0.10 | 0.03 | 0.23 | 0.06 | 0.50 |
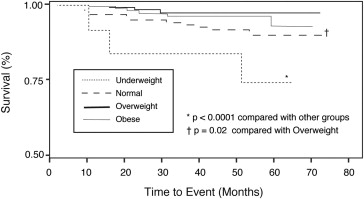
Mortality during 3-year follow-up was U shaped. The underweight group had the highest mortality (25% [3 of 12], significantly higher than other groups), mortality was lowest in the overweight group (2.3% [5 of 214]), and mortality was intermediate in the normal-BF group (6.4% [12 of 189], significantly higher than in the overweight group) and the obese group (3.6% [6 of 166]) ( Figure 1 ). In the underweight group according to BMI, mortality was 50% (3 of 6), in the normal-BF group 8.0% (11 of 137), in the overweight group 2.8% (7 of 243), and in the obese group 2.6% (5 of 195).
In multiple regression analysis, higher BF ( Table 3 ) was an independent predictor of lower mortality after adjusting for confounders. Increasing Gallagher classification ( Table 4 ) was also protective. Other independent predictors of better survival were a high left ventricular ejection fraction and higher exercise capacity as measured by peak oxygen consumption. After excluding the underweight group by BMI, the overweight and obese patients retained a mortality benefit (odds ratio 0.35, 95% confidence interval 0.13 to 0.98) compared to the underweight and normal patients by BF. When we excluded all the underweight patients by BF, this became borderline insignificant (odds ratio 0.36, 95% confidence interval 0.13 to 1.02) after adjustment for confounders.


