Ventricular strain and dyssynchrony can be measured in patients with repaired tetralogy of Fallot (TOF), but their effect on clinical outcomes is poorly understood. The purpose of this study was to investigate if ventricular strain and dyssynchrony measured by cardiac magnetic resonance feature tracking are associated with death and sustained ventricular tachycardia. Patients with TOF who died or had ventricular tachycardia (TOF case, n = 16) were compared with age-matched patients with TOF with no adverse outcome (TOF control, n = 32). For each patient, midventricular short-axis and 4-chamber cine steady-state free precession images were analyzed using cardiac magnetic resonance feature-tracking software. Peak left ventricular (LV) and right ventricular (RV) global circumferential and longitudinal strain and indexes of dyssynchrony were compared between groups. Compared with the TOF control group, median strain values were significantly lower for the TOF case group for both the LV (circumferential: 17% vs 23%, p = 0.003; longitudinal: 13% vs 18%, p <0.001) and the RV (circumferential: 10% vs 16%, p = 0.001; longitudinal: 11% vs 18%, p <0.001). In a multivariate model including strain and dyssynchrony parameters, RV and LV longitudinal strain were strongly associated with the adverse outcome (p = 0.003 and 0.04, respectively; area under the curve = 0.92). No differences in ventricular dyssynchrony were identified between the groups. In conclusion, patients with TOF in this cohort who experienced adverse outcomes had lower values of all strain parameters than those who did not, and impaired longitudinal strain of both ventricles was strongly associated with adverse clinical outcomes.
Despite excellent results of surgical management of tetralogy of Fallot (TOF) and good early clinical outcomes, the rates of exercise intolerance, major arrhythmias, and death increase substantially beginning in the third decade of life. Traditional factors linked to poor long-term outcomes in this population include older age at complete repair, longer time since surgery, prolonged QRS duration, and left ventricular (LV) or right ventricular (RV) dysfunction, measured by ejection fraction. Increasingly, strain and synchrony have been measured using speckle-tracking echocardiography to evaluate regional ventricular function allowing new insights into cardiac mechanics. Echocardiographic views of the RV, however, are often limited in patients with TOF, and RV circumferential strain frequently cannot be determined reliably by ultrasound-based techniques. Cardiac magnetic resonance (CMR) imaging overcomes most of these limitations to allow accurate and reproducible evaluation of the RV. Speckle tracking–based techniques have been applied to CMR data, and these CMR-based techniques have been termed “feature tracking.” The goals of this investigation were to use these new tools to (1) determine whether LV and RV strain measurements in patients with repaired TOF are associated with poor clinical outcomes such as death and sustained ventricular tachycardia (VT) and (2) evaluate whether indexes of dyssynchrony are related to the same clinical outcomes.
Methods
This was a single-center, retrospective, case-control design. The study was approved by the Committee on Clinical Investigation at Boston Children’s Hospital. Patients were identified for review from an internal institutional database. The clinical outcome in this study was death or sustained VT occurring after CMR imaging. The study group consisted of TOF case and TOF control patients. Inclusion criteria for the TOF case patients were (1) history of surgical TOF repair, (2) death or documented sustained VT, and (3) CMR from 2000 to 2011, with high-quality short- and long-axis cine images, before death or VT. TOF control patients were selected from a pool of patients with TOF with no adverse outcomes (defined previously). Case and control patients with ≤10-year interval between TOF repair and CMR evaluation were excluded, as were patients with pulmonary valve replacement after CMR. TOF control patients were individually matched 2:1 to TOF cases by date of birth (2 controls closest in age to the TOF case chosen), with the maximum allowable age difference between the matched case and control of 5 years.
Data extracted from the patients’ medical records included gender, surgical history, age at CMR, date and type of adverse outcome (in the case group), and QRS duration on electrocardiogram nearest in time to the CMR. For the TOF case group, the CMR used for analysis was the most recent study before the adverse outcome. For the TOF control group, the CMR was the most recent study available occurring at least 1 year before data analysis to provide a period of follow-up during which an adverse event could have occurred in this population.
Details of the CMR protocol used in our laboratory for the assessment of patients with repaired TOF, including calculation of ventricular size and function and pulmonary regurgitation fraction, have been previously published. Briefly, CMR studies were performed on a commercially available 1.5-T whole-body scanner (GE Medical Systems, Milwaukee, Wisconsin; Philips Medical Systems, Best, The Netherlands), using the appropriate receiver coil for body size. CMR image analysis was performed using a commercially available workstation (Extended MR WorkSpace; Philips Medical Systems) and software (Mass and Flow; MEDIS Medical Imaging Systems, Leiden, The Netherlands).
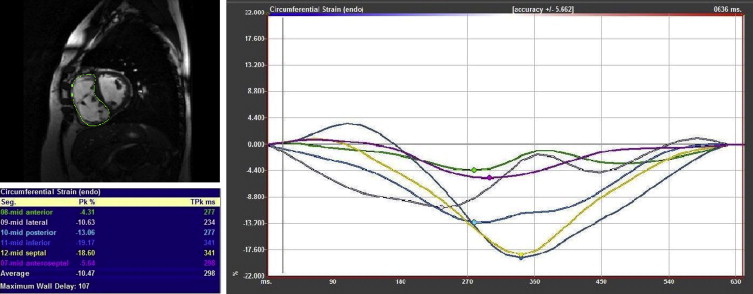
Feature-tracking analysis was performed on ventricular short-axis and 4-chamber cine images of both the RV and LV using commercially available software (Image-Arena VA 3.0 with Diogenes v. 1.1.02; TomTec Imaging Systems; Unterschleissheim, Germany). Starting at the LV midpapillary level, the short-axis slice used for analysis was the first one, proceeding in an apical direction, in which the RV myocardium was continuous (e.g., patch was no longer present). The LV was analyzed at the same level. For the 4-chamber analysis, a central slice was used. The feature-tracking process was the same in short-axis and 4-chamber views. A splined curve was defined by a series of points placed manually along the endocardium at end-diastole. The analysis software then subdivided this curve into 48 points and 6 segments. The motion of these points was tracked in an automated fashion, and a peak strain value and time to peak strain for each of the 6 segments were calculated ( Figure 1 ). Peak global strain was calculated as the average of the 6 segmental values.
Given the lack of a well-established reference method for calculating dyssynchrony, several different methods were used. The first was the SD of the time to peak strain of each of the 6 segments (referred to as “SD time to peak strain”). The second method identified the maximum time delay between the wall segment with the earliest time to peak strain and the segment with the latest time to peak strain (“maximum wall delay”). Next, cross-correlation analysis was used to calculate the maximum cross-correlation delay (“cross-correlation delay”), using the method described by Fornwalt et al. Finally, interventricular dyssynchrony was assessed using both difference in time to peak global strain (RV − LV) and maximum cross-correlation delay between global strain curves for the RV and LV.
Demographic, electrocardiographic, and CMR parameters (including indexes of strain and dyssynchrony) were compared between TOF case and TOF control patients. Absolute values of strain are reported, with median and maximum/minimum values listed unless otherwise noted. Categorical variables are reported as number and percentage. Comparisons between groups were made using Fisher’s exact test for categorical variables and the Wilcoxon rank sum test for continuous variables. Multivariate analysis was performed using logistic regression for the outcome occurrence of event (death or sustained VT), first considering all variables, and then including only strain and dyssynchrony variables. Stata 12.1 (StataCorp, College Station, Texas) was used for statistical analysis. A p value <0.05 was considered statistically significant.
Results
The TOF case and TOF control groups included 16 and 32 patients, respectively. Among the TOF case group, 13 patients died after CMR and 3 patients had documented sustained VT. Demographic, electrocardiographic, and CMR data for the 2 groups are presented in Table 1 . Global strain values and results of the dyssynchrony analyses for the 2 groups are presented in Tables 2 and 3 , respectively.
| Variable | TOF Case (n=16) | TOF Control (n=32) | p Value |
|---|---|---|---|
| Male/female | 10/6 | 16/16 | 0.54 |
| Age at surgical repair (years) | 7 (0-31) | 6 (0-49) | 0.43 |
| Age at CMR (years) | 38 (9-62) | 42 (13-64) | 0.41 |
| Time from complete repair to CMR (years) | 29 (6-40) | 32 (13-46) | 0.10 |
| Electrocardiographic characteristics | |||
| QRS duration (ms) (n=16, 30) | 158 (112-208) | 152 (72-188) | 0.14 |
| Heart rate (beats/minute) | 81 (58-142) | 72 (46-117) | 0.02 |
| CMR variables | |||
| Body surface area (m 2 ) | 2.0 (0.8-2.4) | 1.8 (1.1-2.4) | 0.10 |
| Pulmonary regurgitation fraction (%) | 22 (0-52) ∗ | 32 (0-67) | 0.71 |
| RV end-diastolic volume index (ml/m 2 ) | 146 (75-247) | 127 (56-287) | 0.35 |
| RV end-systolic volume index (ml/m 2 ) | 103 (40-195) | 65 (27-192) | 0.03 |
| RV ejection fraction (%) | 40 (21-52) | 50 (33-64) | <0.001 |
| RV mass index (g/m 2 ) | 42 (24-81) | 28 (0-56) | <0.001 |
| RV mass/volume (g/ml) | 0.28 (0.14-0.67) | 0.20 (0.14-0.41) † | 0.01 |
| LV end-diastolic volume index (ml/m 2 ) | 78 (63-209) ‡ | 87 (61-139) | 0.52 |
| LV ejection fraction (%) | 51 (40-61) ‡ | 57 (34-71) | 0.02 |
| LV mass index (g/m 2 ) | 73 (40-102) ‡ | 53 (36-90) | 0.01 |
| LV mass/volume (g/m 2 ) | 0.80 (0.36-1.4) ‡ | 0.61 (0.44-0.86) | 0.03 |
| Variable | TOF Case (n=16) | TOF Control (n=32) | p Value |
|---|---|---|---|
| Left Ventricle | |||
| Circumferential (%) | 17 (7-29) | 23 (9-30) | 0.003 |
| Longitudinal (%) | 13 (8-20) ∗ | 18 (10-27) | <0.001 |
| Right Ventricle | |||
| Circumferential (%) | 10 (6-21) | 16 (8-26) | 0.001 |
| Longitudinal (%) | 11 (5-21) | 18 (11-23) | <0.001 |
| Variable | TOF Case (n=16) | TOF Control (n=32) | p Value |
|---|---|---|---|
| Left Ventricle | |||
| Circumferential | |||
| Standard deviation time to peak | 39 (16-163) | 43 (15-143) | 0.84 |
| Maximum wall delay | 96 (29-481) | 112 (28-303) | 0.89 |
| Cross-correlation delay | 82 (29-333) | 75 (26-456) | 0.82 |
| Longitudinal | |||
| Standard deviation time to peak | 80 (13-157) ∗ | 93 (12-252) | 0.21 |
| Maximum wall delay | 214 (26-400) ∗ | 246 (24-730) | 0.13 |
| Cross-correlation delay | 270 (36-714) ∗ | 202 (0-975) | 0.42 |
| Right Ventricle | |||
| Circumferential | |||
| Standard deviation time to peak | 66 (12-165) | 66 (16-135) | 0.62 |
| Maximum wall delay | 188 (22-474) | 166 (30-344) | 0.39 |
| Cross-correlation delay | 182 (22-725) | 121 (28-825) | 0.48 |
| Longitudinal | |||
| Standard deviation time to peak | 71 (26-230) | 89 (40-184) | 0.29 |
| Maximum wall delay | 183 (57-530) | 236 (92-466) | 0.26 |
| Cross-correlation delay | 118 (33-588) | 170 (26-756) | 0.39 |
| Interventricular | |||
| Circumferential | |||
| (RV – LV) time to peak | 47 (0-185) | 57 (-76-136) | 0.65 |
| Cross-correlation delay | 56 (0-203) | 33 (0-114) | 0.16 |
| Longitudinal | |||
| (RV – LV) time to peak | 23 (-146-151) ∗ | 4 (-149-133) | 0.24 |
| Cross-correlation delay | 53 (0-392) ∗ | 34 (0-180) | 0.31 |
Stay updated, free articles. Join our Telegram channel

Full access? Get Clinical Tree


